| Param | Original file | Final file |
|---|---|---|
| Filename | modeM0/AS1C04_010T01_9000003158_21391cztM0_level2.evt | modeM0/AS1C04_010T01_9000003158_21391cztM0_level2_quad_clean.evt |
| Size (bytes) | 114,085,440 | 28,791,360 |
| Size | 108.8 MB | 27.5 MB |
| Events in quadrant A | 871,931 | 194,872 |
| Events in quadrant B | 838,731 | 198,093 |
| Events in quadrant C | 814,901 | 184,953 |
| Events in quadrant D | 825,699 | 183,282 |
| Mode SS | |||
|---|---|---|---|
| Quadrant | BADHDUFLAG | Total packets | Discarded packets |
| A | 0 | 30 | 0 |
| B | 0 | 30 | 0 |
| C | 0 | 30 | 0 |
| D | 0 | 30 | 0 |
| Mode M0 | |||
|---|---|---|---|
| Quadrant | BADHDUFLAG | Total packets | Discarded packets |
| A | 0 | 3549 | 2 |
| B | 0 | 3340 | 1 |
| C | 0 | 3261 | 1 |
| D | 0 | 3301 | 1 |
| Mode M9 | |||
|---|---|---|---|
| Quadrant | BADHDUFLAG | Total packets | Discarded packets |
| A | 0 | 9 | 0 |
| B | 0 | 9 | 0 |
| C | 0 | 9 | 0 |
| D | 0 | 9 | 0 |
| Quadrant | Total seconds | Saturated seconds | Saturation percentage |
|---|---|---|---|
| A | 1485 | 6 | 0.404040% |
| B | 1485 | 7 | 0.471380% |
| C | 1485 | 11 | 0.740741% |
| D | 1485 | 8 | 0.538721% |
Noise dominated data is calculated using 1-second bins in cleaned event files. If a bin has >2000 counts, and if more than 50% of those come from <1% of pixels, then it is considered to be noise-dominated and hence unusable.
| Quadrant | # 1 sec bins | Bins with >0 counts | Bins with >2000 counts | High rate bins dominated by noise | Noise dominated (total time) | Noise dominated (detector-on time) | Marked lightcurve |
|---|---|---|---|---|---|---|---|
| A | 1485 | 1485 | 0 | 0 | 0.00% | 0.00% | 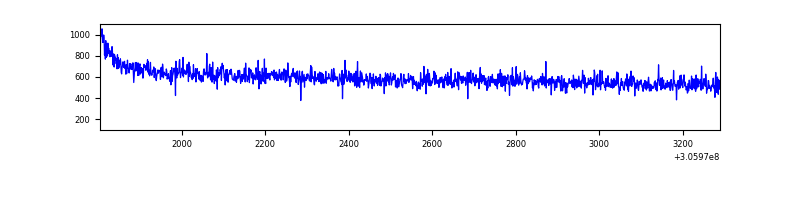 |
| B | 1485 | 1485 | 0 | 0 | 0.00% | 0.00% | 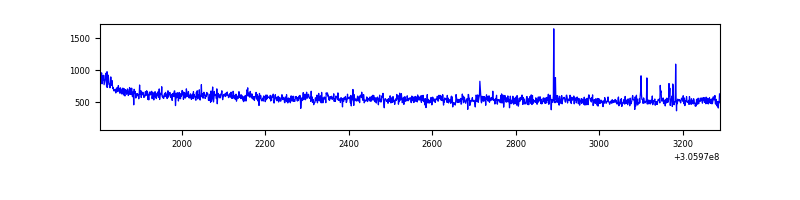 |
| C | 1485 | 1485 | 0 | 0 | 0.00% | 0.00% |  |
| D | 1485 | 1485 | 1 | 1 | 0.07% | 0.07% | 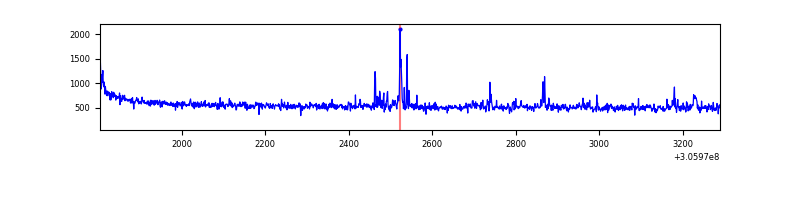 |
Top three noisy pixels from each quadrant. If the there are fewer than three noisy pixels in the level2.evt file, extra rows are filled as -1
| Pixel properties | Quadrant properties | ||||||
|---|---|---|---|---|---|---|---|
| Quadrant | DetID | PixID | Counts | Sigma | Mean | Median | Sigma |
| A | 5 | 168 | 36475 | 825.04 | 215 | 212 | 44.0 |
| A | 11 | 47 | 5984 | 131.32 | 215 | 212 | 44.0 |
| A | 13 | 254 | 2111 | 43.21 | 215 | 212 | 44.0 |
| B | 0 | 230 | 10047 | 239.99 | 210 | 206 | 41.0 |
| B | 12 | 111 | 4432 | 103.06 | 210 | 206 | 41.0 |
| B | 11 | 111 | 3859 | 89.08 | 210 | 206 | 41.0 |
| C | 14 | 238 | 32422 | 684.82 | 199 | 201 | 47.1 |
| C | 3 | 233 | 3877 | 78.13 | 199 | 201 | 47.1 |
| C | 13 | 61 | 1346 | 24.34 | 199 | 201 | 47.1 |
| D | 12 | 235 | 29374 | 572.11 | 207 | 202 | 51.0 |
| D | 2 | 234 | 5476 | 103.43 | 207 | 202 | 51.0 |
| D | 14 | 35 | 4799 | 90.15 | 207 | 202 | 51.0 |
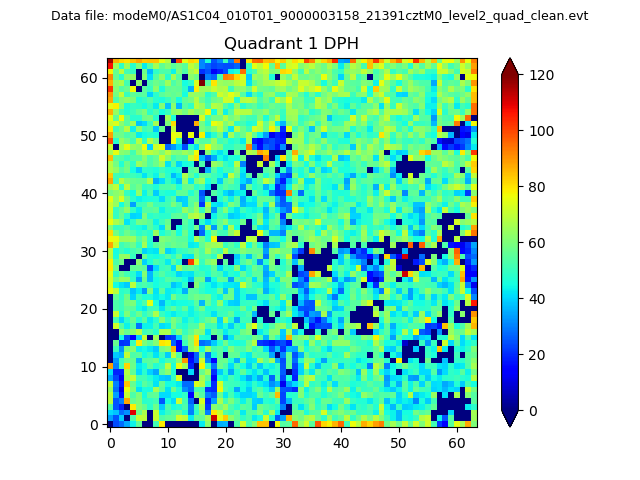
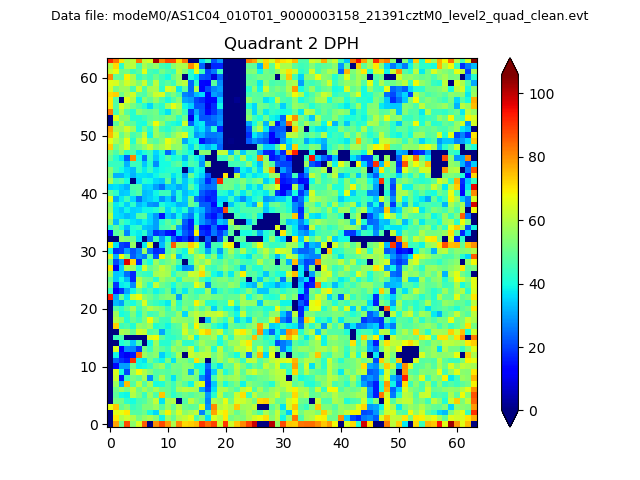
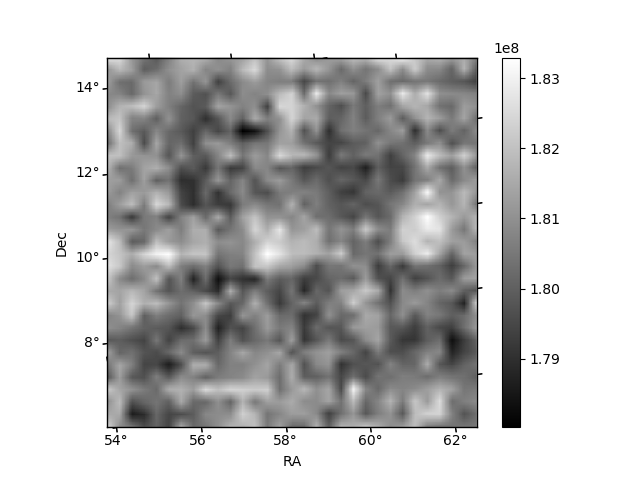
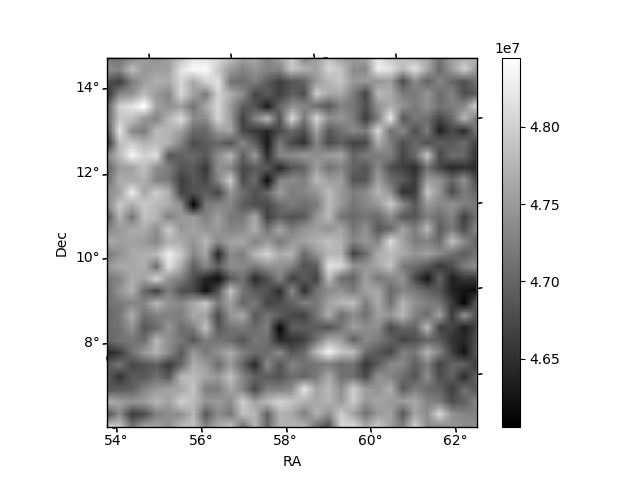
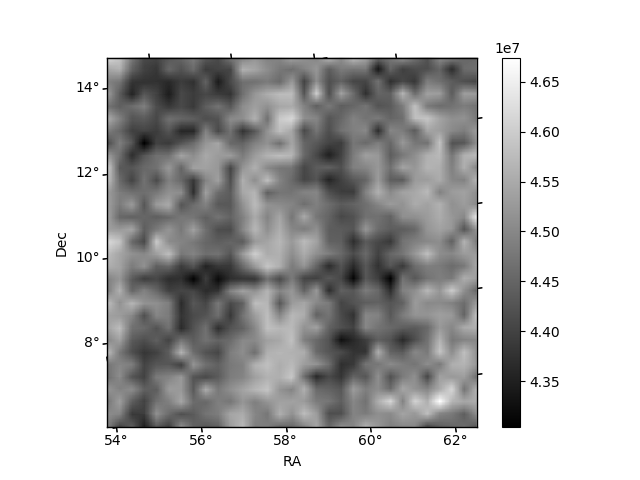
Histogram calculated using DETX and DETY for each event in the final _common_clean file
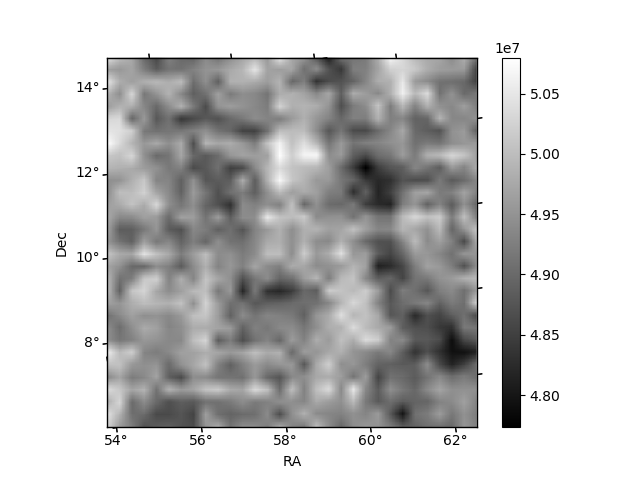
| Quadrant A | 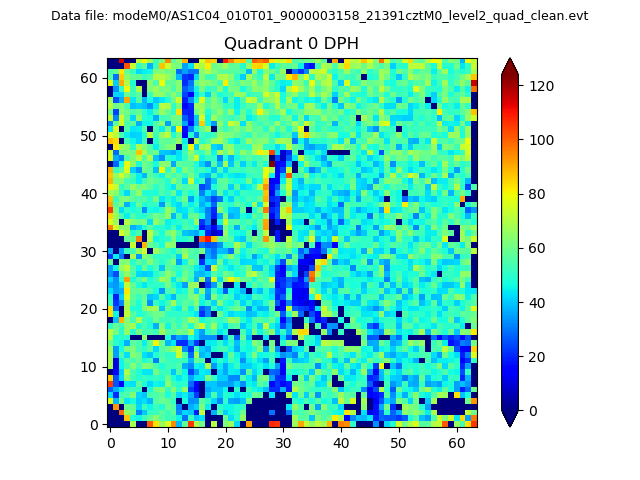 |
 |
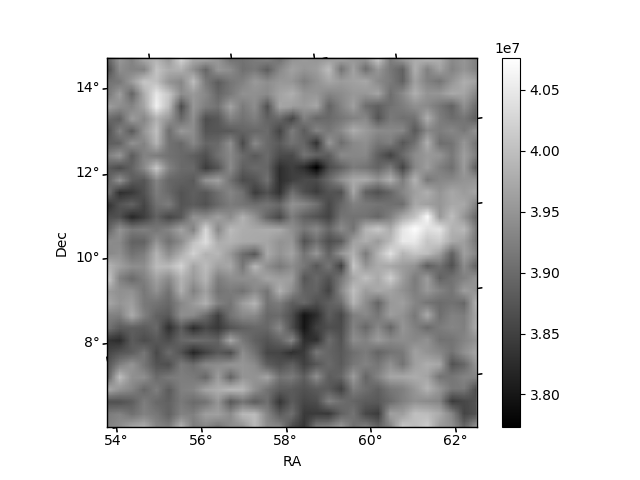
Quadrant B |
|---|---|---|---|
| Quadrant D | 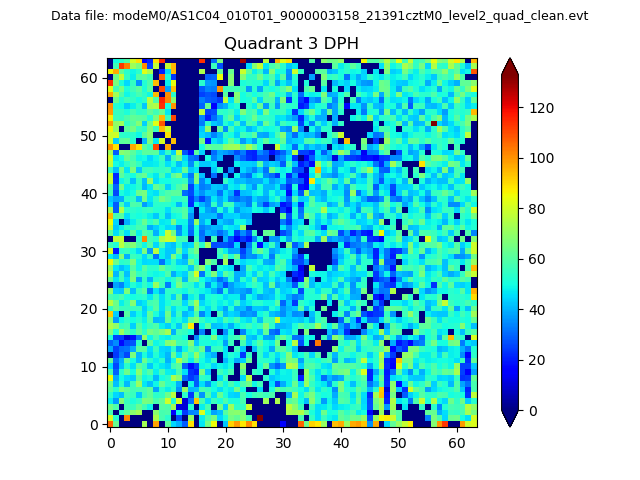 |
 |
Quadrant C |
| Plot type | Count rate plots | Images |
|---|---|---|
| Comparison with Poisson distribution Blue bars denote a histogram of data divided into 1 sec bins. Red curve is a Poisson curve with rate = median count rate of data. |
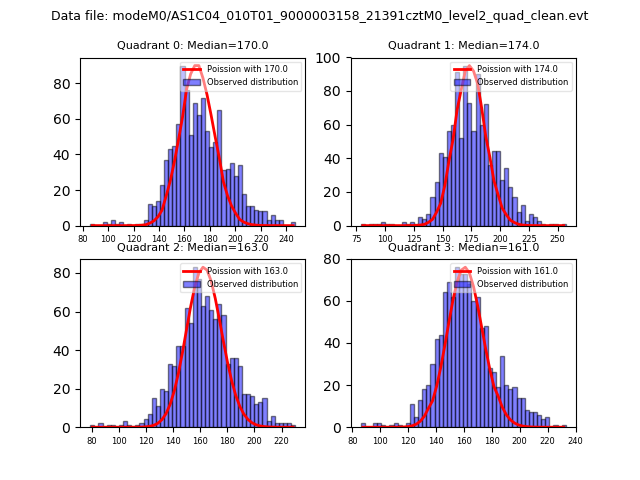 |
 |
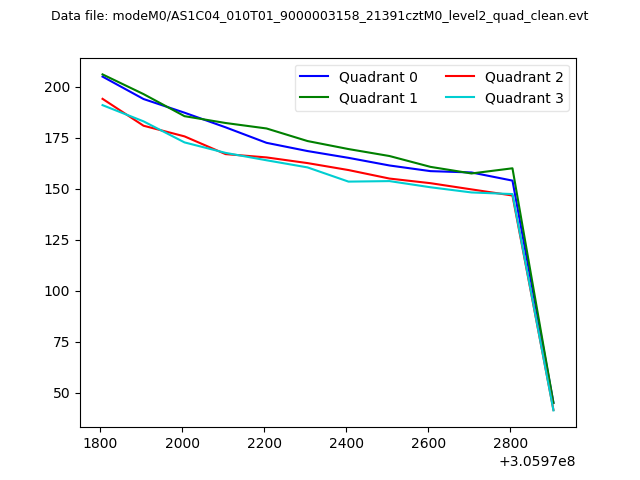
| Quadrant-wise count rates Data is divided into 100 sec bins |
 |
|
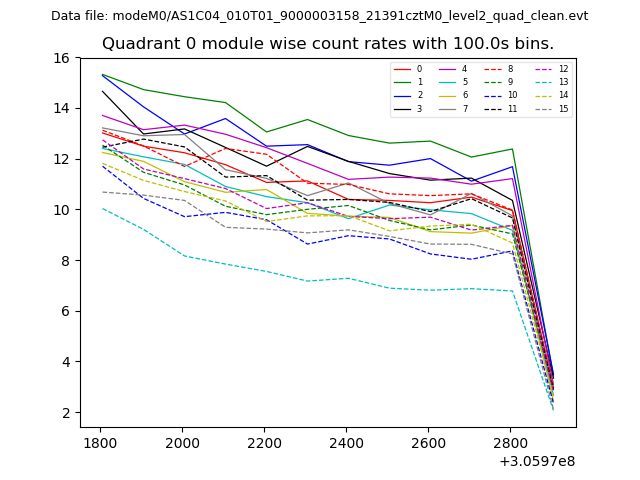
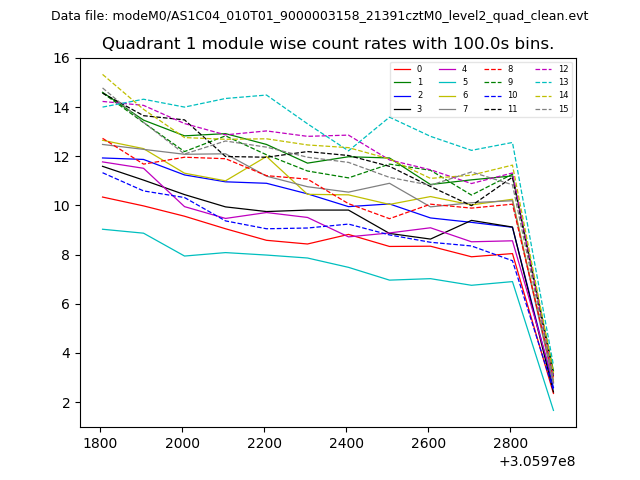
| Module-wise count rates for Quadrant A Data is divided into 100 sec bins |
 |
 |
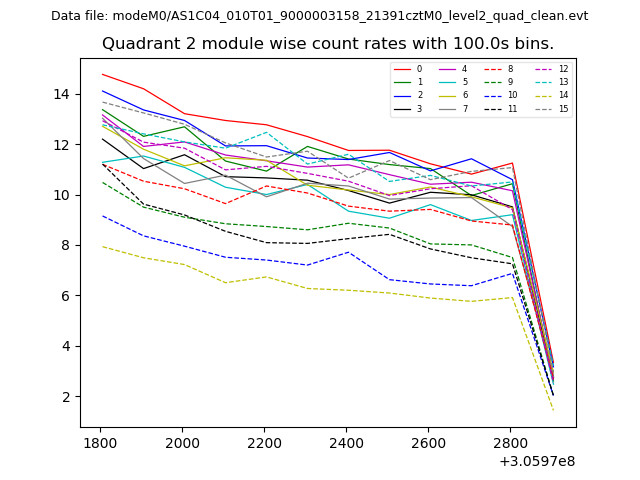
| Module-wise count rates for Quadrant B Data is divided into 100 sec bins |
 |
 |
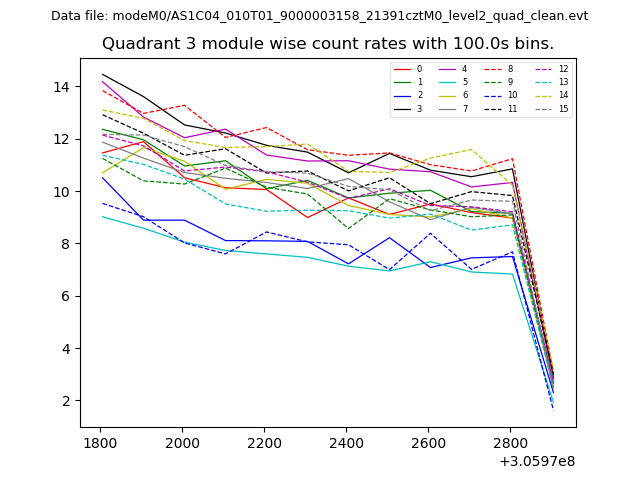
| Module-wise count rates for Quadrant C Data is divided into 100 sec bins |
 |
 |
| Module-wise count rates for Quadrant D Data is divided into 100 sec bins |
 |
 |
| Parameter | Plot |
|---|---|
| CZT HV Monitor | 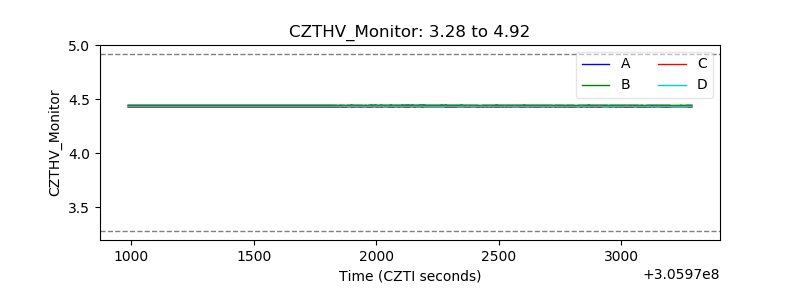 |
| D_VDD | 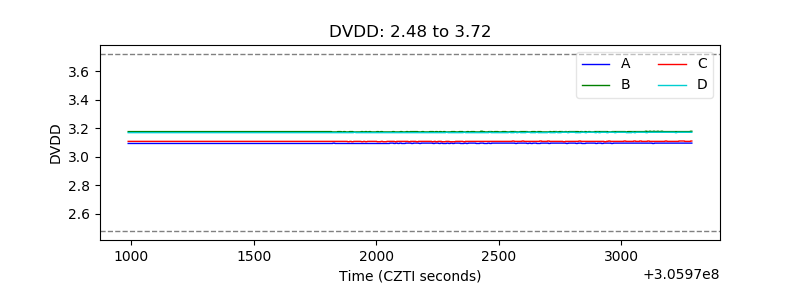 |
| Temperature 1 | 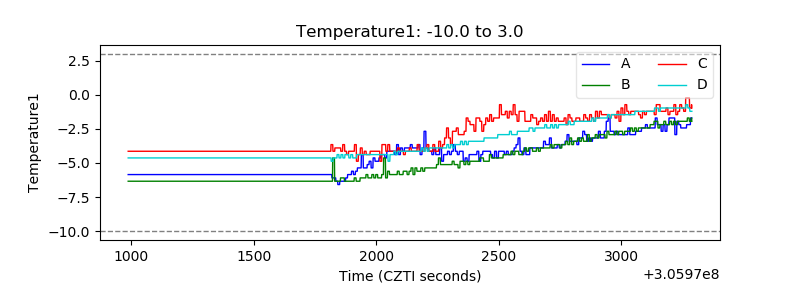 |
| Veto HV Monitor | 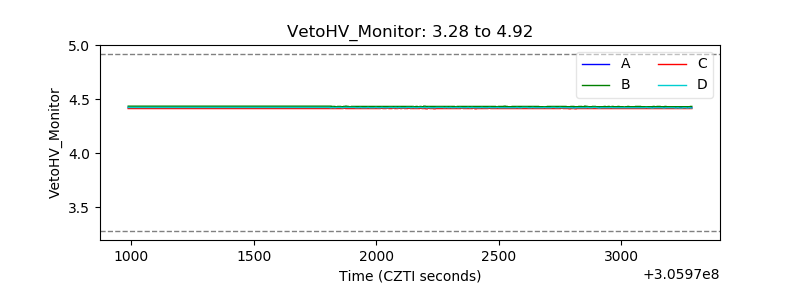 |
| Veto LLD | 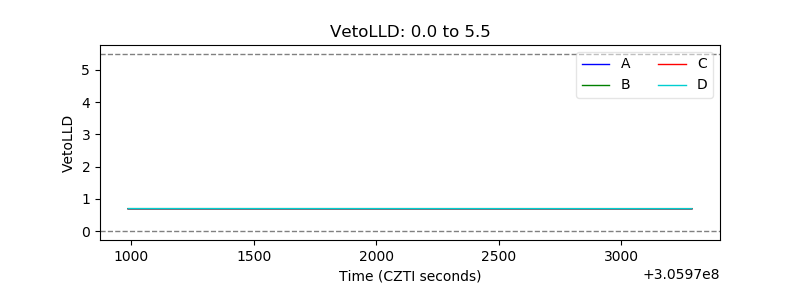 |
| Alpha Counter | 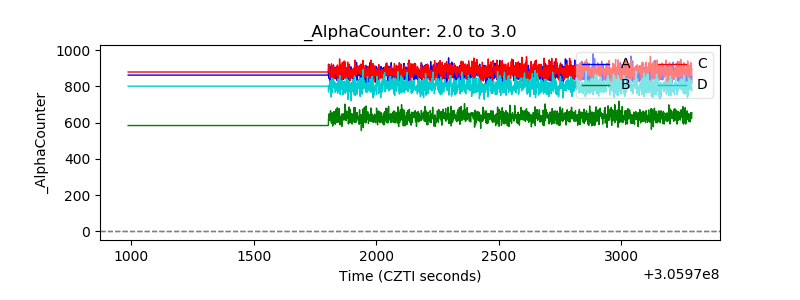 |
| _CPM_Rate | 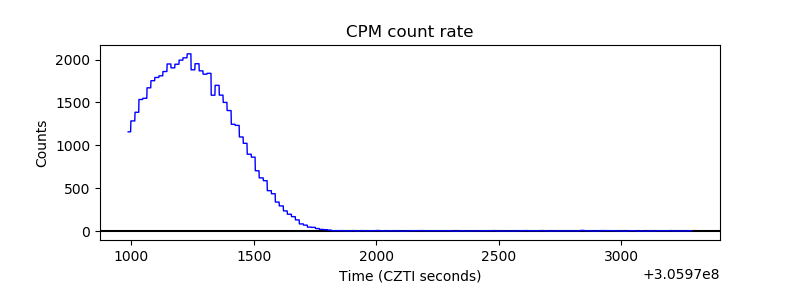 |
| CZT Counter |  |
| +2.5 Volts monitor | 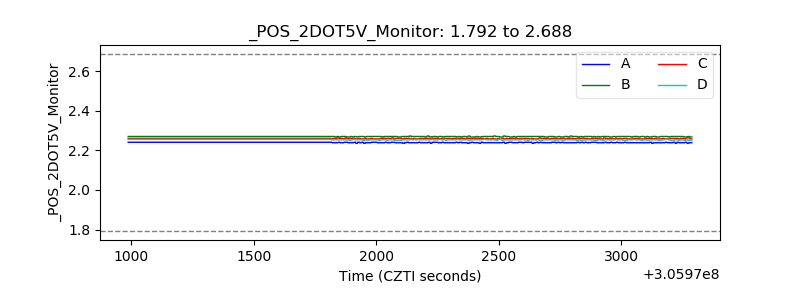 |
| +5 Volts monitor |  |
| _ROLL_ROT | 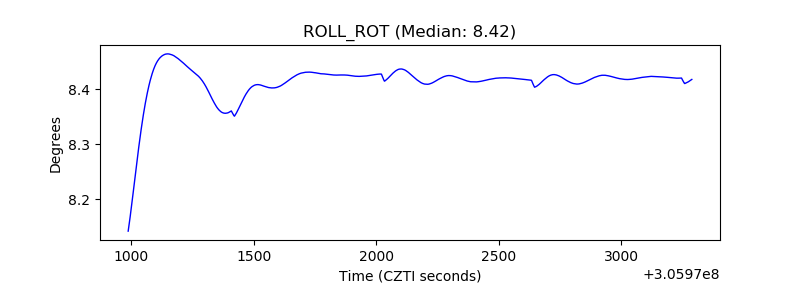 |
| _Roll_DEC | 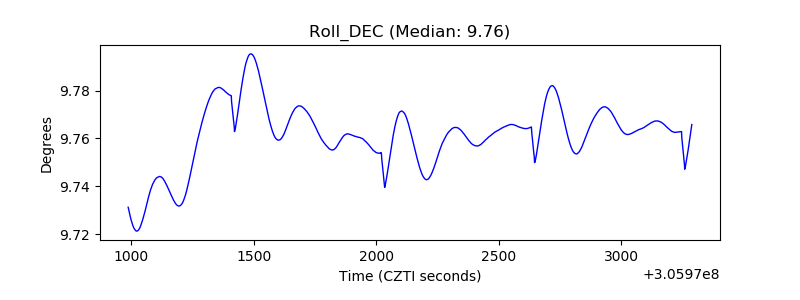 |
| _Roll_RA | 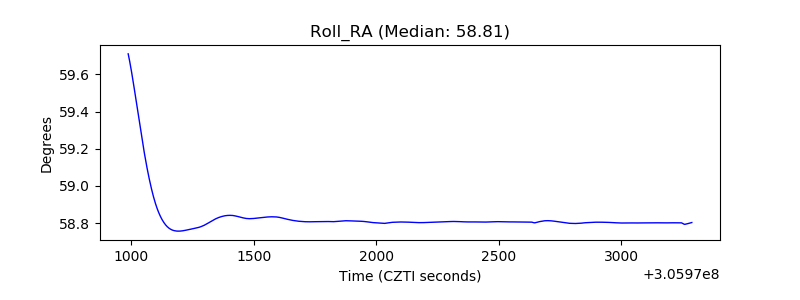 |
| Veto Counter | 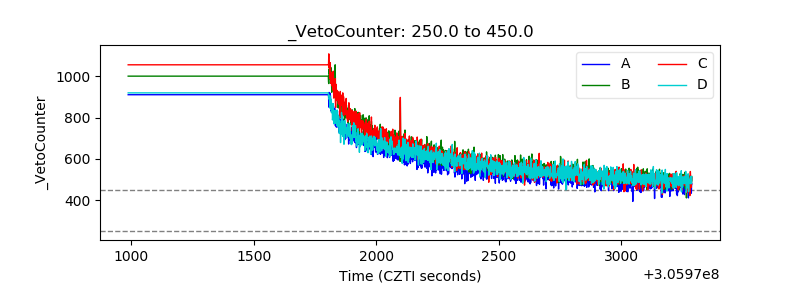 |