| Param | Original file | Final file |
|---|---|---|
| Filename | modeM0/AS1C04_010T01_9000003158_21392cztM0_level2.evt | modeM0/AS1C04_010T01_9000003158_21392cztM0_level2_quad_clean.evt |
| Size (bytes) | 444,481,920 | 20,039,040 |
| Size | 423.9 MB | 19.1 MB |
| Events in quadrant A | 3,053,964 | 52,559 |
| Events in quadrant B | 3,005,600 | 56,867 |
| Events in quadrant C | 3,890,214 | 53,069 |
| Events in quadrant D | 3,132,900 | 53,429 |
| Mode SS | |||
|---|---|---|---|
| Quadrant | BADHDUFLAG | Total packets | Discarded packets |
| A | 0 | 131 | 17 |
| B | 0 | 130 | 16 |
| C | 0 | 130 | 16 |
| D | 0 | 130 | 16 |
| Mode M0 | |||
|---|---|---|---|
| Quadrant | BADHDUFLAG | Total packets | Discarded packets |
| A | 0 | 14334 | 2094 |
| B | 0 | 14095 | 2014 |
| C | 0 | 16912 | 1901 |
| D | 0 | 14483 | 1949 |
| Mode M9 | |||
|---|---|---|---|
| Quadrant | BADHDUFLAG | Total packets | Discarded packets |
| A | 0 | 21 | 1 |
| B | 0 | 22 | 2 |
| C | 0 | 22 | 1 |
| D | 0 | 23 | 3 |
| Quadrant | Total seconds | Saturated seconds | Saturation percentage |
|---|---|---|---|
| A | 5549 | 82 | 1.477744% |
| B | 5560 | 78 | 1.402878% |
| C | 5572 | 269 | 4.827710% |
| D | 5582 | 85 | 1.522752% |
Noise dominated data is calculated using 1-second bins in cleaned event files. If a bin has >2000 counts, and if more than 50% of those come from <1% of pixels, then it is considered to be noise-dominated and hence unusable.
| Quadrant | # 1 sec bins | Bins with >0 counts | Bins with >2000 counts | High rate bins dominated by noise | Noise dominated (total time) | Noise dominated (detector-on time) | Marked lightcurve |
|---|---|---|---|---|---|---|---|
| A | 7582 | 5672 | 0 | 0 | 0.00% | 0.00% | 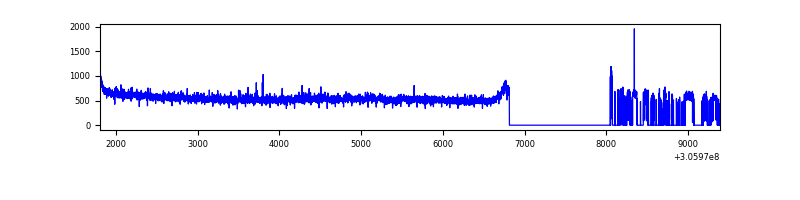 |
| B | 7587 | 5683 | 1 | 1 | 0.01% | 0.02% | 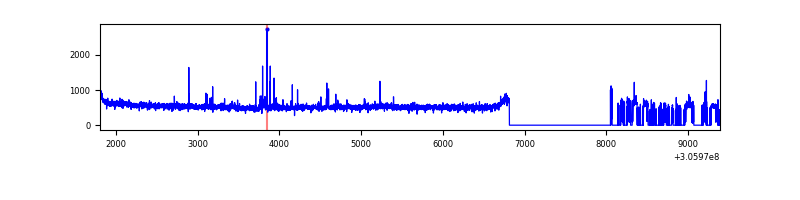 |
| C | 7588 | 5701 | 74 | 74 | 0.98% | 1.30% | 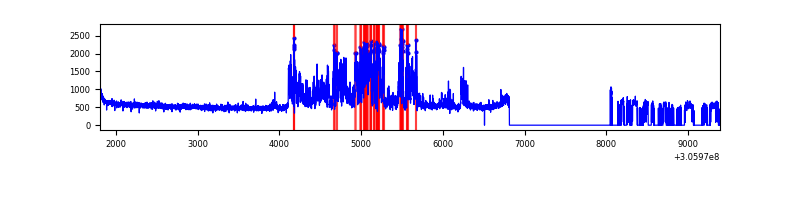 |
| D | 7577 | 5714 | 16 | 16 | 0.21% | 0.28% | 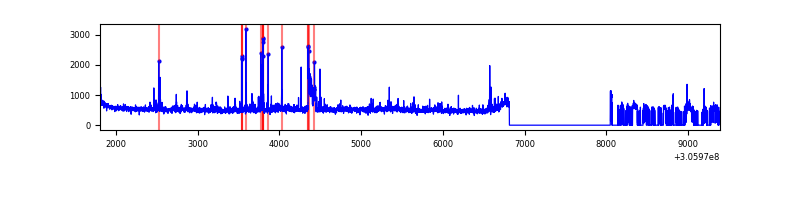 |
Top three noisy pixels from each quadrant. If the there are fewer than three noisy pixels in the level2.evt file, extra rows are filled as -1
| Pixel properties | Quadrant properties | ||||||
|---|---|---|---|---|---|---|---|
| Quadrant | DetID | PixID | Counts | Sigma | Mean | Median | Sigma |
| A | 5 | 168 | 115702 | 756.81 | 756 | 741 | 151.9 |
| A | 11 | 47 | 11795 | 72.77 | 756 | 741 | 151.9 |
| A | 13 | 254 | 8713 | 52.48 | 756 | 741 | 151.9 |
| B | 0 | 230 | 22828 | 157.6 | 746 | 730 | 140.2 |
| B | 0 | 190 | 17637 | 120.58 | 746 | 730 | 140.2 |
| B | 12 | 111 | 16144 | 109.93 | 746 | 730 | 140.2 |
| C | 3 | 233 | 1009113 | 6155.76 | 709 | 714 | 163.8 |
| C | 14 | 238 | 112845 | 684.5 | 709 | 714 | 163.8 |
| C | 13 | 61 | 5008 | 26.21 | 709 | 714 | 163.8 |
| D | 12 | 235 | 102084 | 567.32 | 737 | 717 | 178.7 |
| D | 13 | 172 | 77461 | 429.52 | 737 | 717 | 178.7 |
| D | 7 | 38 | 54219 | 299.44 | 737 | 717 | 178.7 |
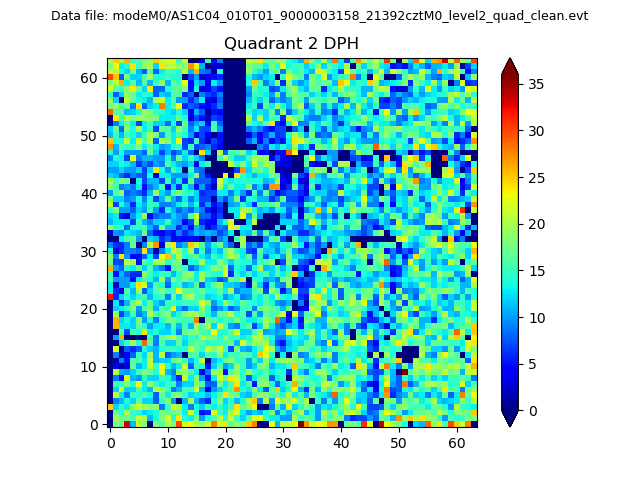
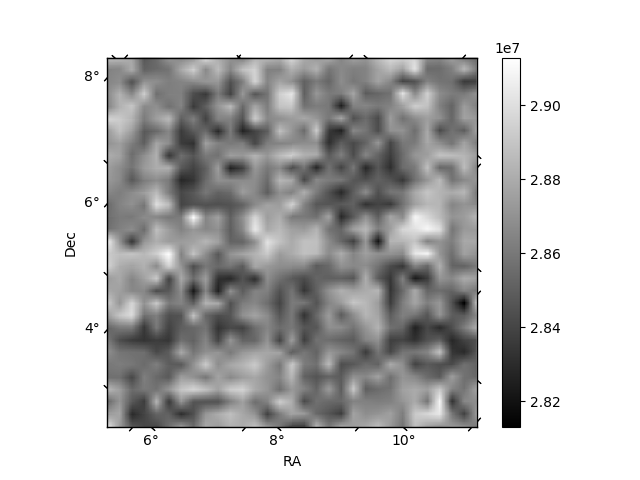
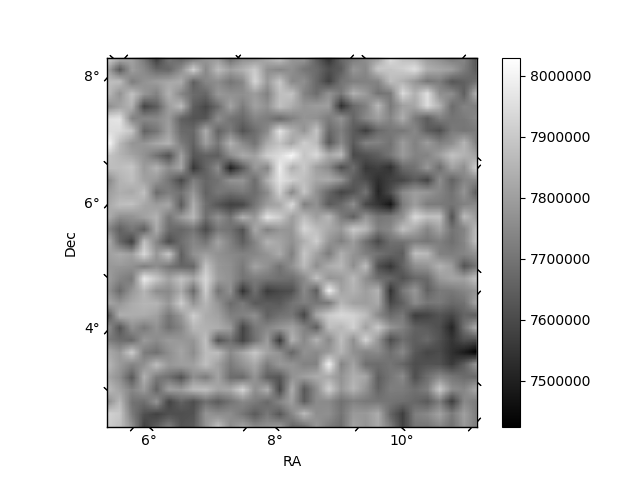
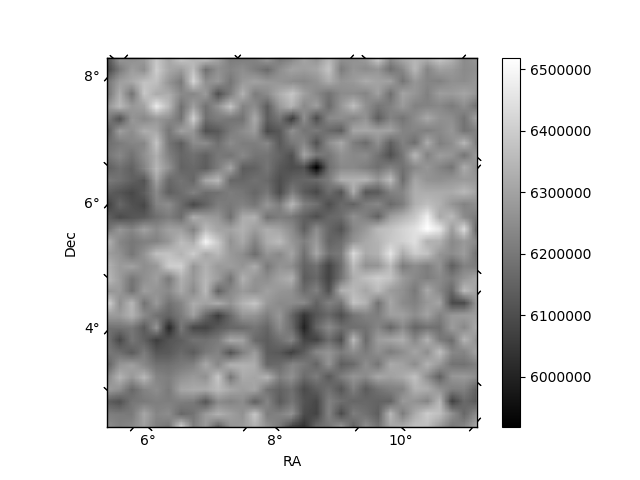
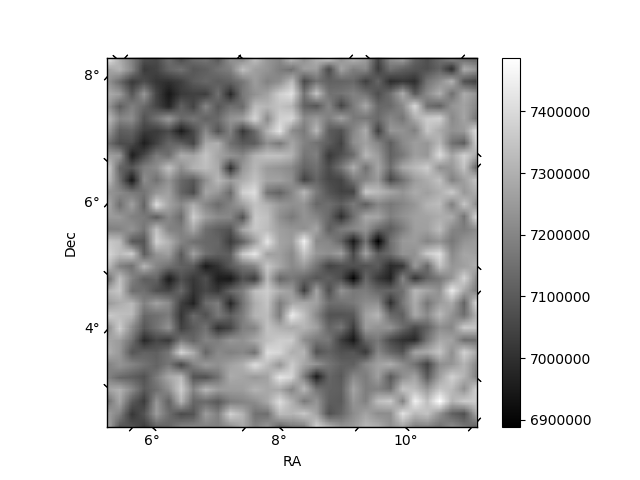
Histogram calculated using DETX and DETY for each event in the final _common_clean file
| Quadrant A | 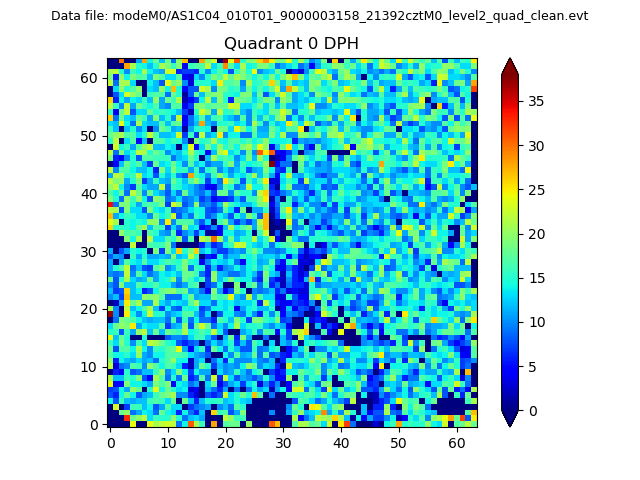 |
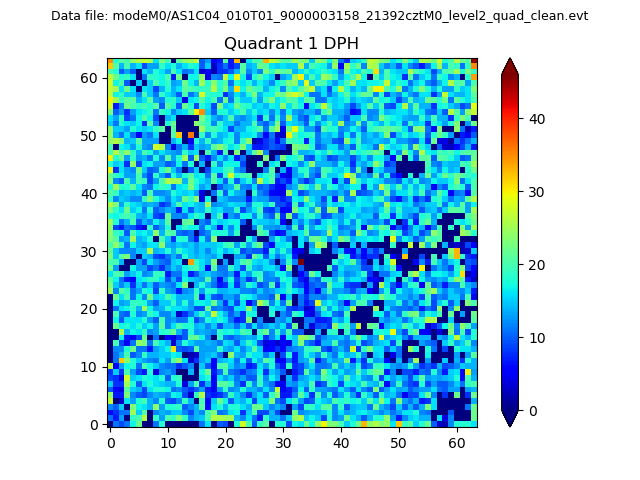 |
Quadrant B |
|---|---|---|---|
| Quadrant D | 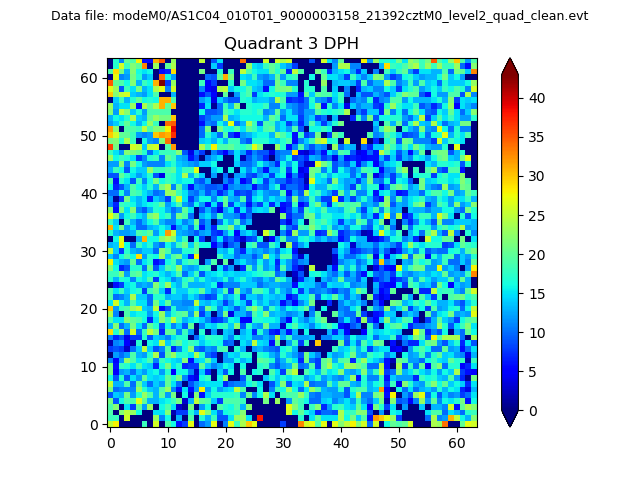 |
 |
Quadrant C |
| Plot type | Count rate plots | Images |
|---|---|---|
| Comparison with Poisson distribution Blue bars denote a histogram of data divided into 1 sec bins. Red curve is a Poisson curve with rate = median count rate of data. |
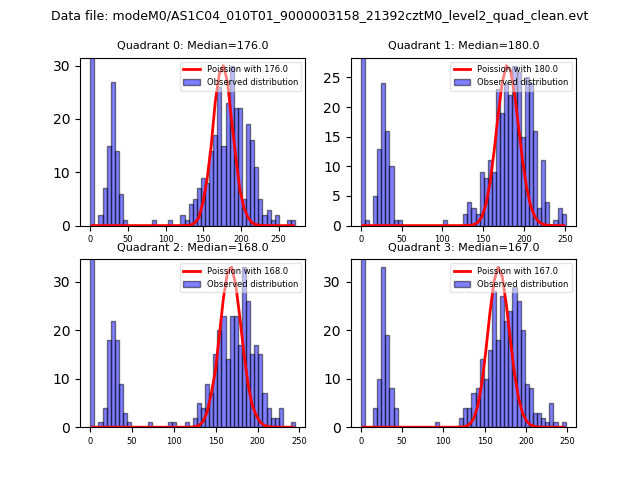 |
 |
| Quadrant-wise count rates Data is divided into 100 sec bins |
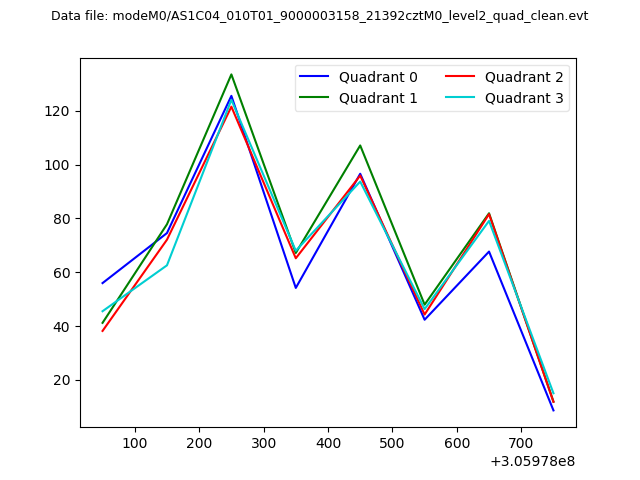 |
|
| Module-wise count rates for Quadrant A Data is divided into 100 sec bins |
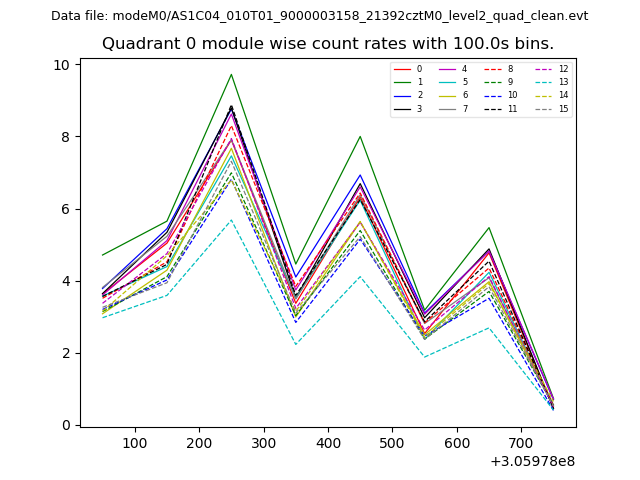 |
 |
| Module-wise count rates for Quadrant B Data is divided into 100 sec bins |
 |
 |
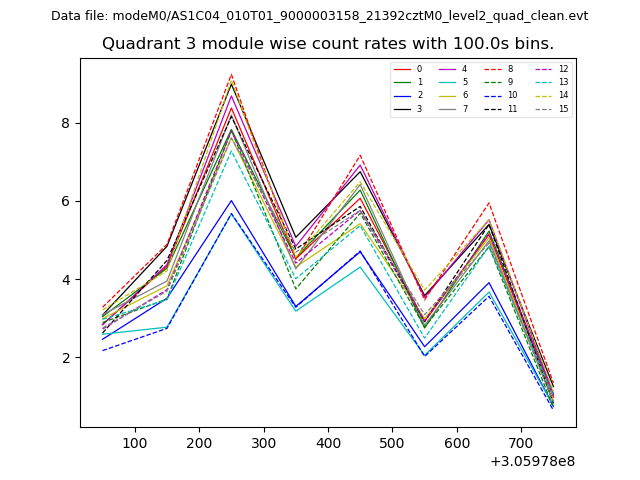
| Module-wise count rates for Quadrant C Data is divided into 100 sec bins |
 |
 |
| Module-wise count rates for Quadrant D Data is divided into 100 sec bins |
 |
 |
| Parameter | Plot |
|---|---|
| CZT HV Monitor | 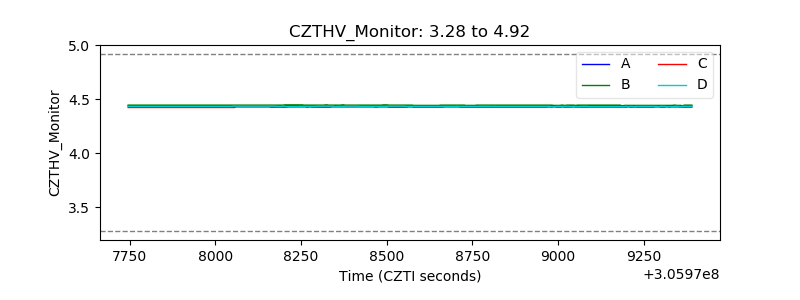 |
| D_VDD |  |
| Temperature 1 | 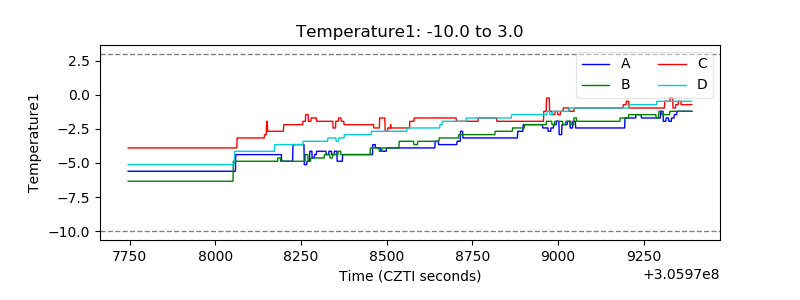 |
| Veto HV Monitor |  |
| Veto LLD | 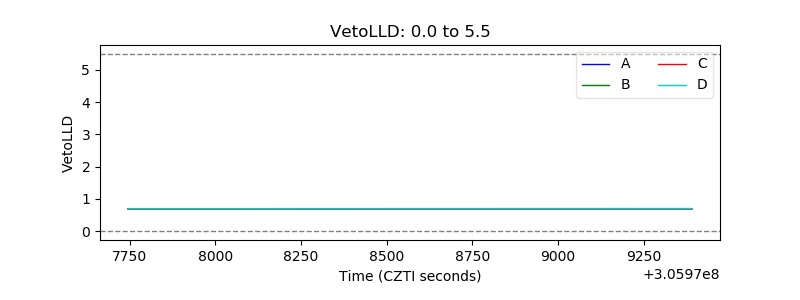 |
| Alpha Counter | 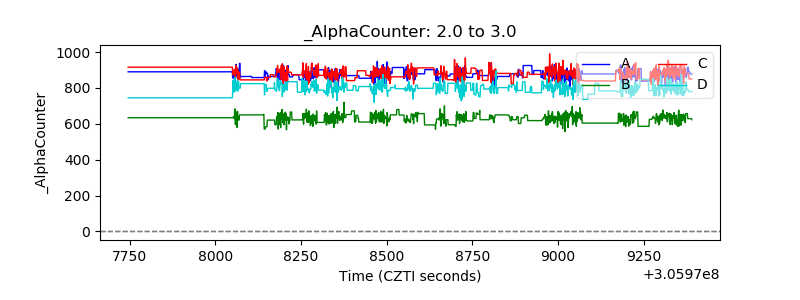 |
| _CPM_Rate | 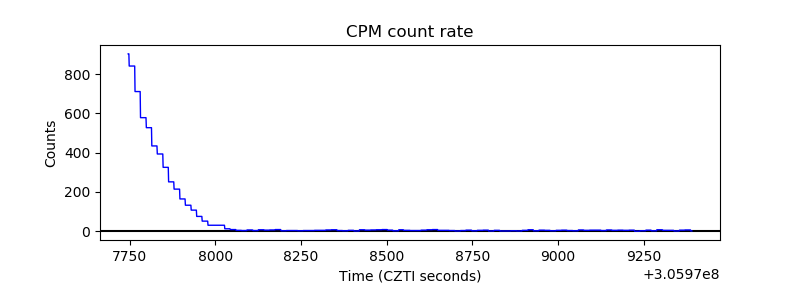 |
| CZT Counter | 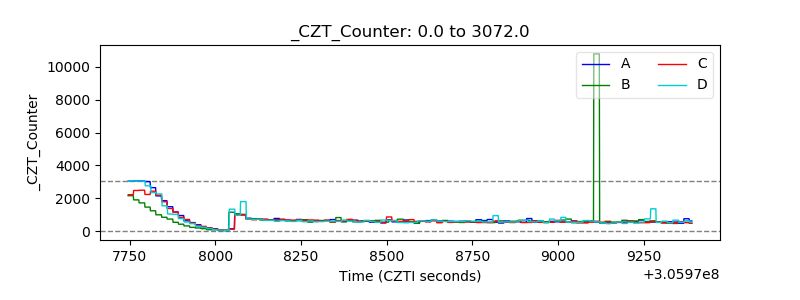 |
| +2.5 Volts monitor |  |
| +5 Volts monitor |  |
| _ROLL_ROT | 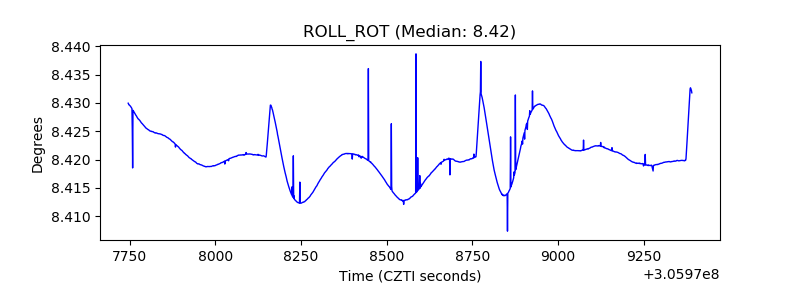 |
| _Roll_DEC | 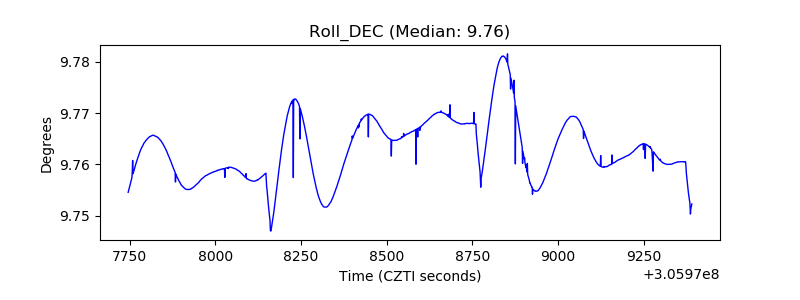 |
| _Roll_RA |  |
| Veto Counter | 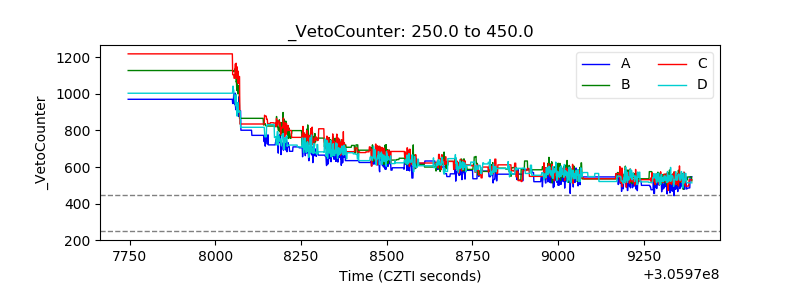 |