| Param | Original file | Final file |
|---|---|---|
| Filename | modeM0/AS1C04_010T01_9000003158_21395cztM0_level2.evt | modeM0/AS1C04_010T01_9000003158_21395cztM0_level2_quad_clean.evt |
| Size (bytes) | 646,473,600 | 68,031,360 |
| Size | 616.5 MB | 64.9 MB |
| Events in quadrant A | 3,685,493 | 410,237 |
| Events in quadrant B | 3,613,621 | 415,800 |
| Events in quadrant C | 4,692,078 | 394,392 |
| Events in quadrant D | 7,141,814 | 379,877 |
| Mode SS | |||
|---|---|---|---|
| Quadrant | BADHDUFLAG | Total packets | Discarded packets |
| A | 0 | 134 | 0 |
| B | 0 | 134 | 0 |
| C | 0 | 134 | 0 |
| D | 0 | 134 | 0 |
| Mode M0 | |||
|---|---|---|---|
| Quadrant | BADHDUFLAG | Total packets | Discarded packets |
| A | 0 | 15131 | 2 |
| B | 0 | 14745 | 2 |
| C | 0 | 18331 | 2 |
| D | 0 | 25843 | 2 |
| Mode M9 | |||
|---|---|---|---|
| Quadrant | BADHDUFLAG | Total packets | Discarded packets |
| A | 0 | 14 | 0 |
| B | 0 | 15 | 0 |
| C | 0 | 15 | 0 |
| D | 0 | 15 | 0 |
| Quadrant | Total seconds | Saturated seconds | Saturation percentage |
|---|---|---|---|
| A | 6588 | 117 | 1.775956% |
| B | 6587 | 127 | 1.928040% |
| C | 6587 | 318 | 4.827691% |
| D | 6587 | 861 | 13.071201% |
Noise dominated data is calculated using 1-second bins in cleaned event files. If a bin has >2000 counts, and if more than 50% of those come from <1% of pixels, then it is considered to be noise-dominated and hence unusable.
| Quadrant | # 1 sec bins | Bins with >0 counts | Bins with >2000 counts | High rate bins dominated by noise | Noise dominated (total time) | Noise dominated (detector-on time) | Marked lightcurve |
|---|---|---|---|---|---|---|---|
| A | 7723 | 6588 | 0 | 0 | 0.00% | 0.00% | 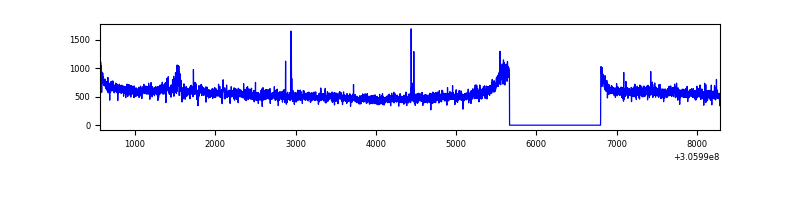 |
| B | 7722 | 6587 | 5 | 5 | 0.06% | 0.08% | 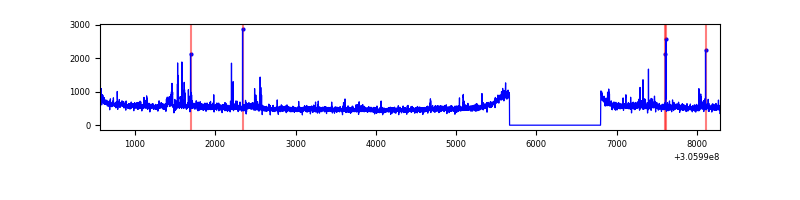 |
| C | 7722 | 6587 | 52 | 52 | 0.67% | 0.79% | 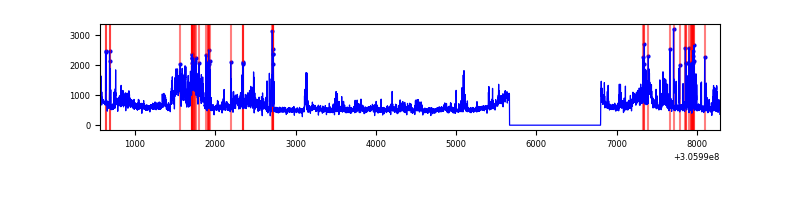 |
| D | 7722 | 6587 | 662 | 662 | 8.57% | 10.05% | 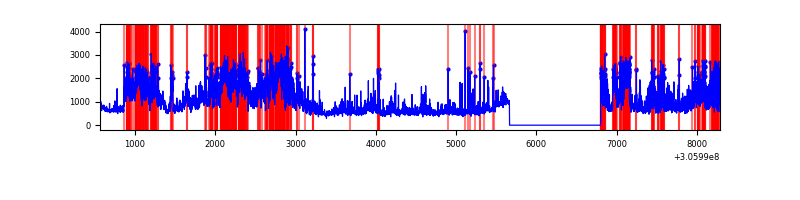 |
Top three noisy pixels from each quadrant. If the there are fewer than three noisy pixels in the level2.evt file, extra rows are filled as -1
| Pixel properties | Quadrant properties | ||||||
|---|---|---|---|---|---|---|---|
| Quadrant | DetID | PixID | Counts | Sigma | Mean | Median | Sigma |
| A | 5 | 168 | 188468 | 1063.11 | 893 | 879 | 176.5 |
| A | 5 | 203 | 26734 | 146.53 | 893 | 879 | 176.5 |
| A | 5 | 16 | 14521 | 77.31 | 893 | 879 | 176.5 |
| B | 0 | 190 | 43762 | 255.71 | 884 | 863 | 167.8 |
| B | 0 | 230 | 35243 | 204.93 | 884 | 863 | 167.8 |
| B | 0 | 228 | 20401 | 116.46 | 884 | 863 | 167.8 |
| C | 3 | 233 | 1265275 | 6448.4 | 844 | 850 | 196.1 |
| C | 14 | 238 | 132817 | 673.01 | 844 | 850 | 196.1 |
| C | 13 | 61 | 5957 | 26.05 | 844 | 850 | 196.1 |
| D | 12 | 235 | 2901136 | 14064.91 | 844 | 820 | 206.2 |
| D | 1 | 52 | 623588 | 3020.07 | 844 | 820 | 206.2 |
| D | 1 | 20 | 217000 | 1048.35 | 844 | 820 | 206.2 |
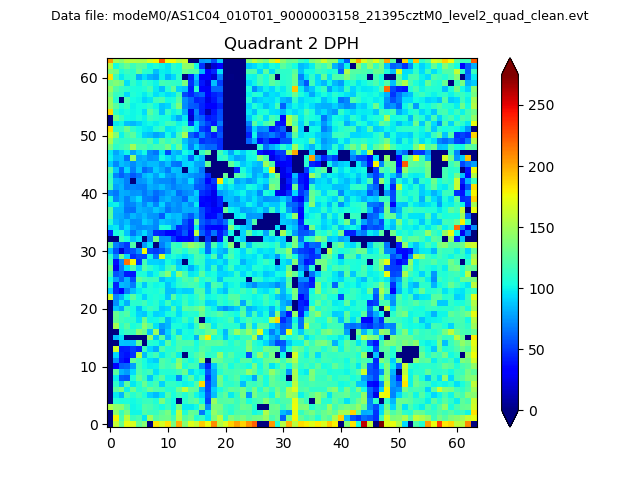
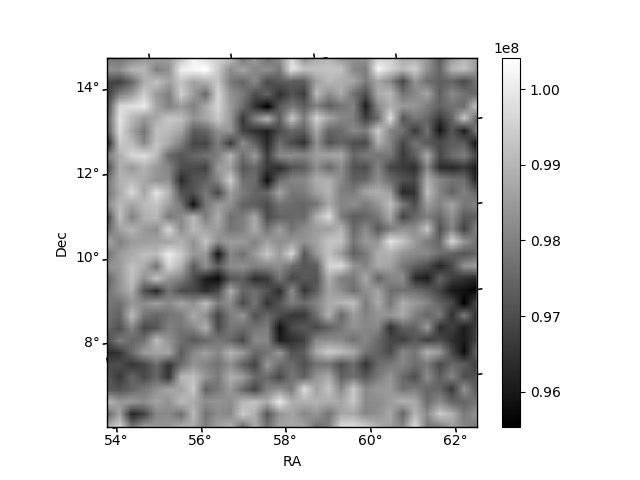
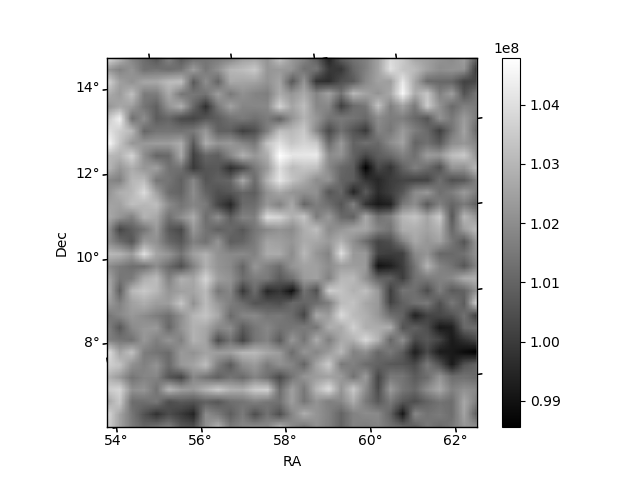
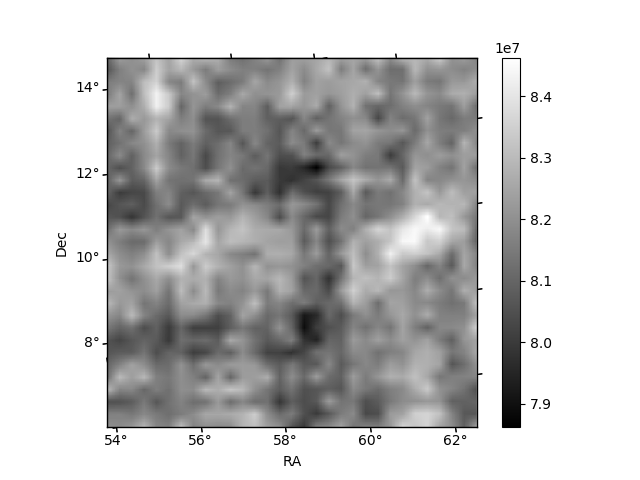
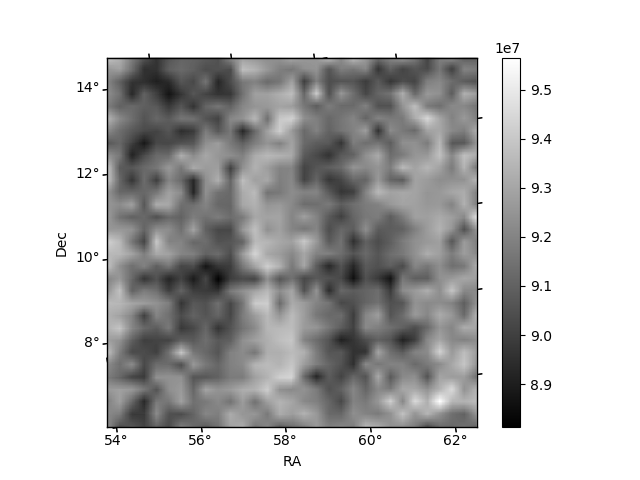
Histogram calculated using DETX and DETY for each event in the final _common_clean file
| Quadrant A |  |
 |
Quadrant B |
|---|---|---|---|
| Quadrant D | 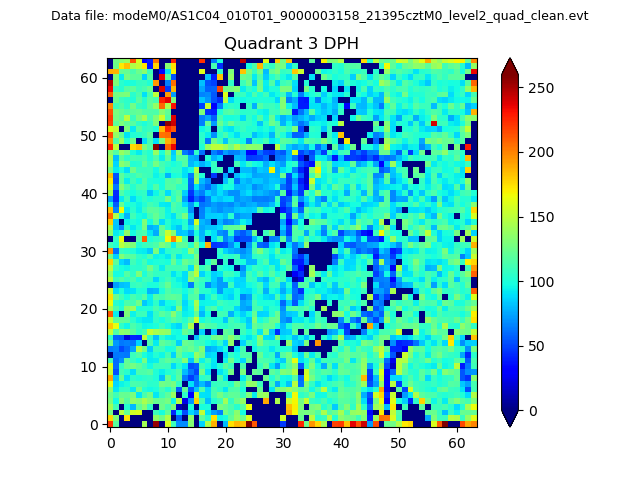 |
 |
Quadrant C |
| Plot type | Count rate plots | Images |
|---|---|---|
| Comparison with Poisson distribution Blue bars denote a histogram of data divided into 1 sec bins. Red curve is a Poisson curve with rate = median count rate of data. |
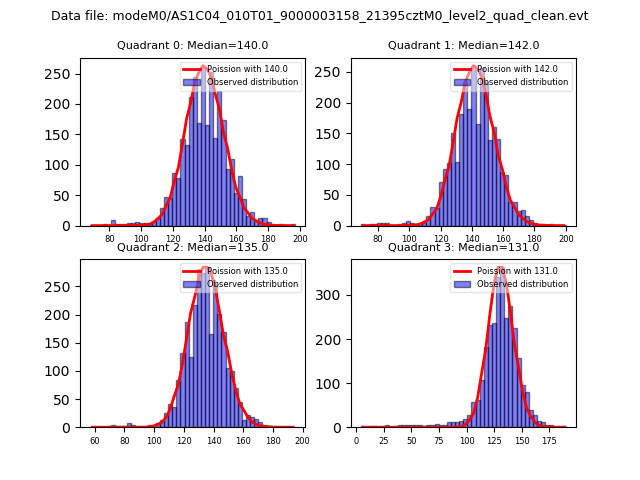 |
 |
| Quadrant-wise count rates Data is divided into 100 sec bins |
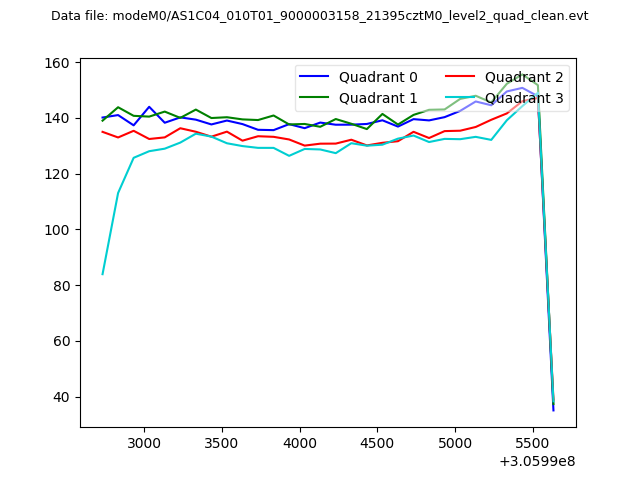 |
|
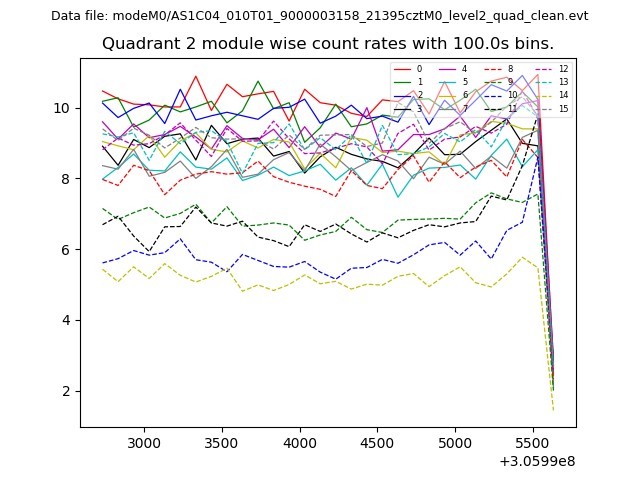
| Module-wise count rates for Quadrant A Data is divided into 100 sec bins |
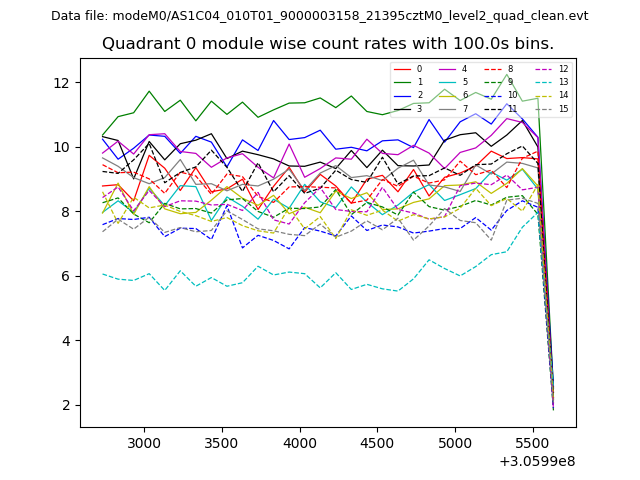 |
 |
| Module-wise count rates for Quadrant B Data is divided into 100 sec bins |
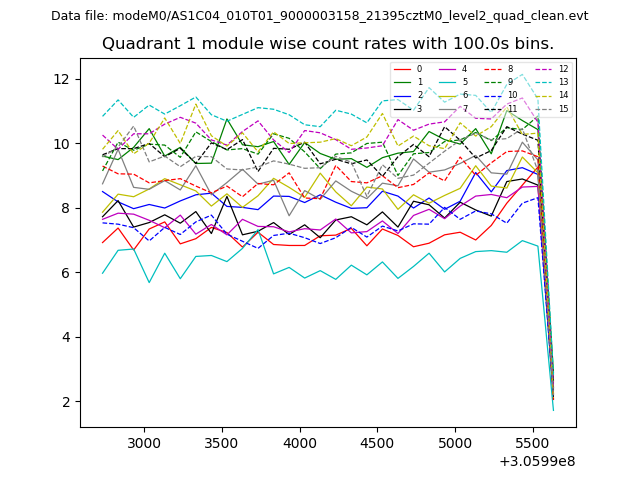 |
 |
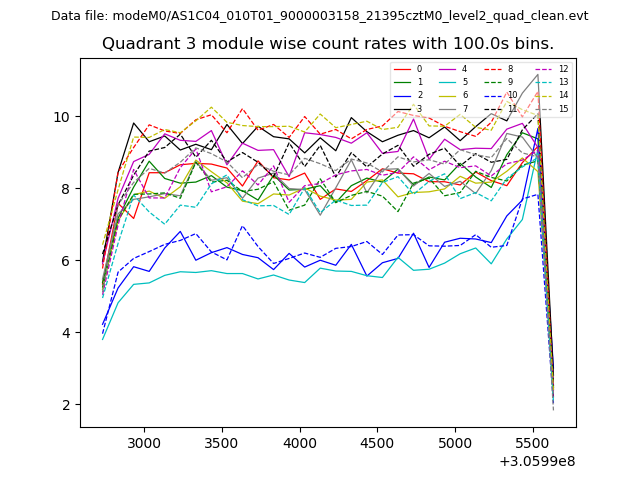
| Module-wise count rates for Quadrant C Data is divided into 100 sec bins |
 |
 |
| Module-wise count rates for Quadrant D Data is divided into 100 sec bins |
 |
 |
| Parameter | Plot |
|---|---|
| CZT HV Monitor |  |
| D_VDD | 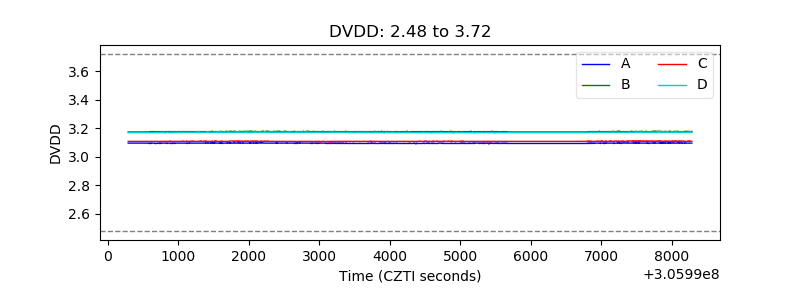 |
| Temperature 1 | 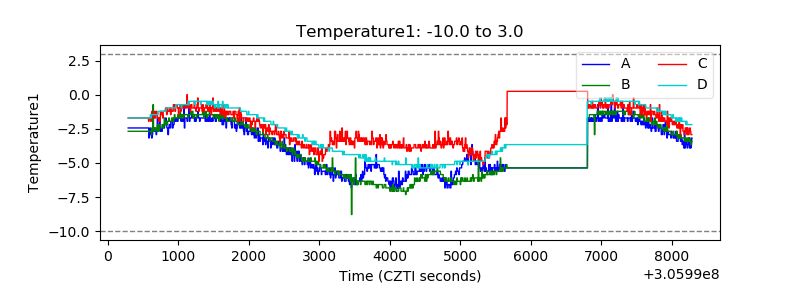 |
| Veto HV Monitor | 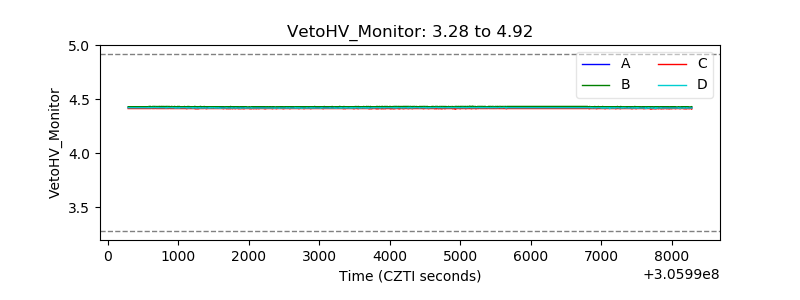 |
| Veto LLD | 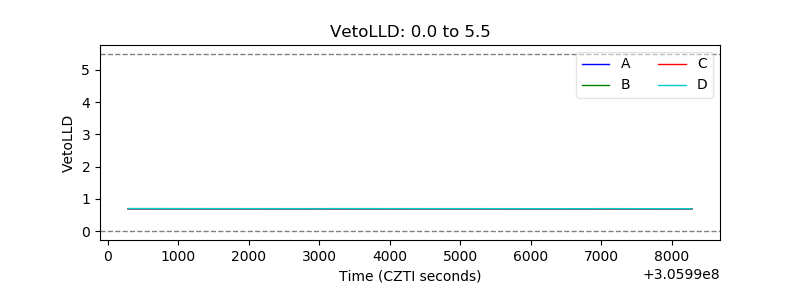 |
| Alpha Counter | 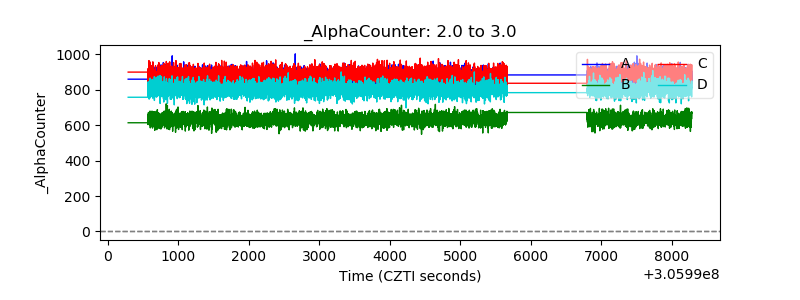 |
| _CPM_Rate | 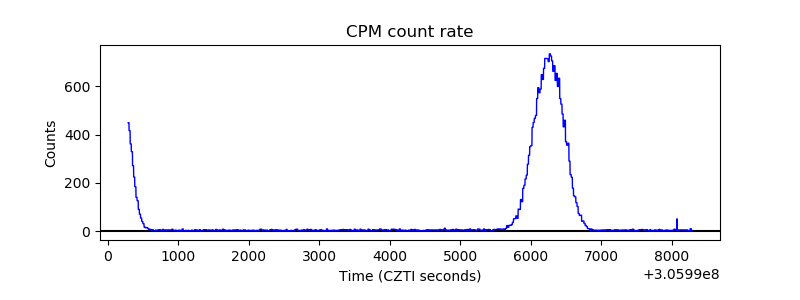 |
| CZT Counter | 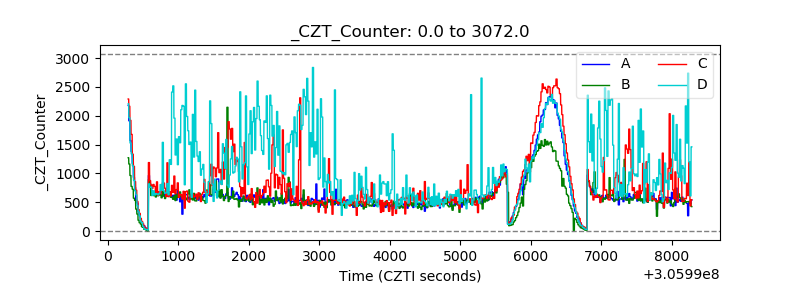 |
| +2.5 Volts monitor |  |
| +5 Volts monitor | 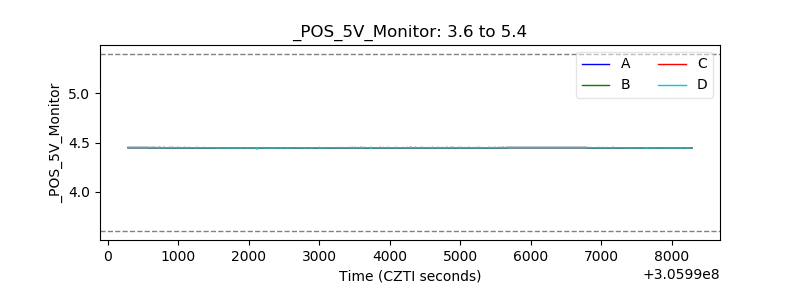 |
| _ROLL_ROT | 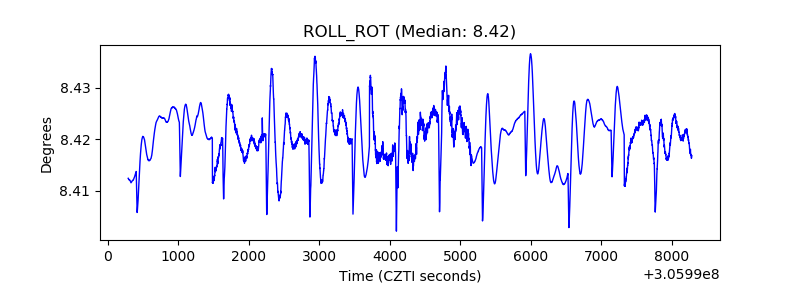 |
| _Roll_DEC | 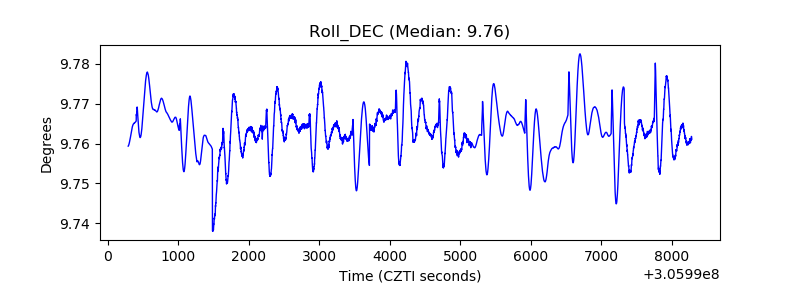 |
| _Roll_RA | 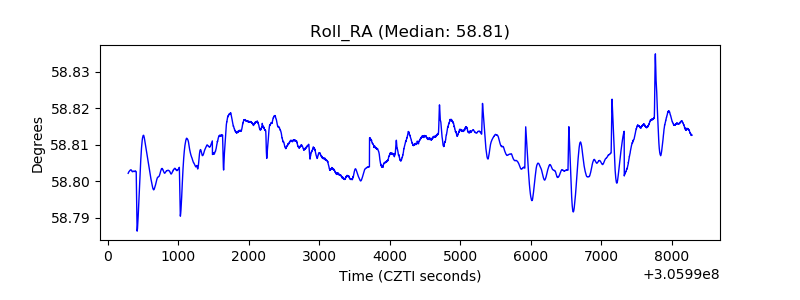 |
| Veto Counter | 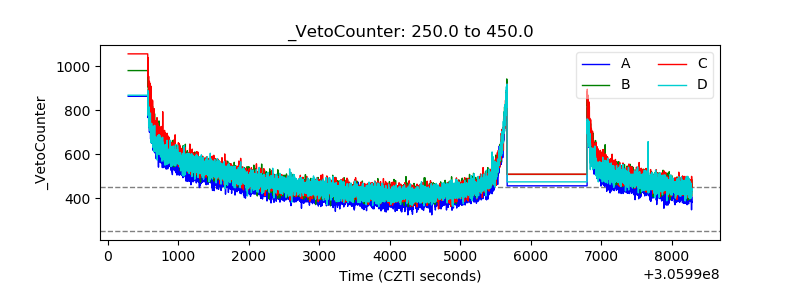 |