| Param | Original file | Final file |
|---|---|---|
| Filename | modeM0/AS1C04_010T01_9000003158_21396cztM0_level2.evt | modeM0/AS1C04_010T01_9000003158_21396cztM0_level2_quad_clean.evt |
| Size (bytes) | 668,099,520 | 77,915,520 |
| Size | 637.1 MB | 74.3 MB |
| Events in quadrant A | 3,600,021 | 492,880 |
| Events in quadrant B | 3,510,687 | 499,508 |
| Events in quadrant C | 4,195,931 | 475,315 |
| Events in quadrant D | 8,464,374 | 414,974 |
| Mode SS | |||
|---|---|---|---|
| Quadrant | BADHDUFLAG | Total packets | Discarded packets |
| A | 0 | 138 | 0 |
| B | 0 | 138 | 0 |
| C | 0 | 138 | 0 |
| D | 0 | 138 | 0 |
| Mode M0 | |||
|---|---|---|---|
| Quadrant | BADHDUFLAG | Total packets | Discarded packets |
| A | 0 | 14764 | 2 |
| B | 0 | 14594 | 2 |
| C | 0 | 16853 | 2 |
| D | 0 | 29789 | 3 |
| Mode M9 | |||
|---|---|---|---|
| Quadrant | BADHDUFLAG | Total packets | Discarded packets |
| A | 0 | 15 | 0 |
| B | 0 | 16 | 0 |
| C | 0 | 16 | 0 |
| D | 0 | 16 | 0 |
| Quadrant | Total seconds | Saturated seconds | Saturation percentage |
|---|---|---|---|
| A | 6837 | 57 | 0.833699% |
| B | 6837 | 75 | 1.096972% |
| C | 6837 | 186 | 2.720491% |
| D | 6836 | 1683 | 24.619661% |
Noise dominated data is calculated using 1-second bins in cleaned event files. If a bin has >2000 counts, and if more than 50% of those come from <1% of pixels, then it is considered to be noise-dominated and hence unusable.
| Quadrant | # 1 sec bins | Bins with >0 counts | Bins with >2000 counts | High rate bins dominated by noise | Noise dominated (total time) | Noise dominated (detector-on time) | Marked lightcurve |
|---|---|---|---|---|---|---|---|
| A | 7732 | 6837 | 0 | 0 | 0.00% | 0.00% | 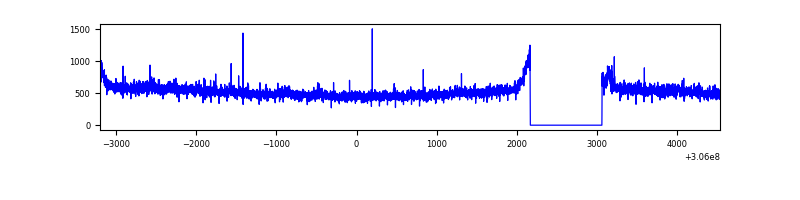 |
| B | 7732 | 6837 | 3 | 3 | 0.04% | 0.04% | 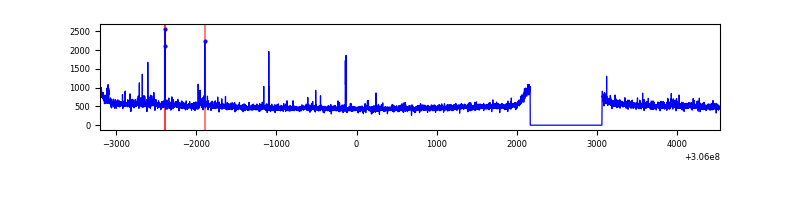 |
| C | 7732 | 6837 | 22 | 22 | 0.28% | 0.32% | 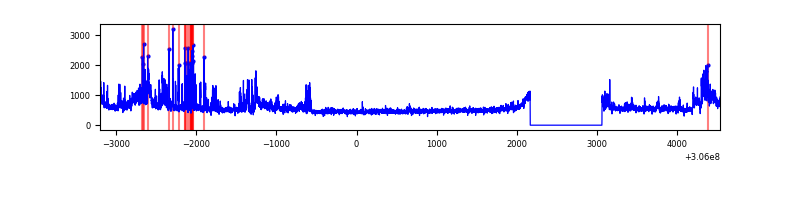 |
| D | 7731 | 6836 | 1571 | 1571 | 20.32% | 22.98% | 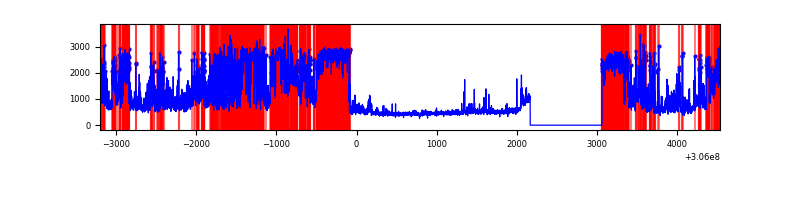 |
Top three noisy pixels from each quadrant. If the there are fewer than three noisy pixels in the level2.evt file, extra rows are filled as -1
| Pixel properties | Quadrant properties | ||||||
|---|---|---|---|---|---|---|---|
| Quadrant | DetID | PixID | Counts | Sigma | Mean | Median | Sigma |
| A | 5 | 168 | 184940 | 1043.13 | 877 | 858 | 176.5 |
| A | 11 | 47 | 29732 | 163.62 | 877 | 858 | 176.5 |
| A | 13 | 254 | 10816 | 56.43 | 877 | 858 | 176.5 |
| B | 0 | 190 | 24070 | 140.02 | 872 | 853 | 165.8 |
| B | 0 | 245 | 20697 | 119.68 | 872 | 853 | 165.8 |
| B | 12 | 111 | 19151 | 110.35 | 872 | 853 | 165.8 |
| C | 3 | 233 | 786784 | 4022.67 | 836 | 842 | 195.4 |
| C | 14 | 238 | 132450 | 673.61 | 836 | 842 | 195.4 |
| C | 10 | 91 | 16190 | 78.56 | 836 | 842 | 195.4 |
| D | 13 | 174 | 2507623 | 13367.77 | 767 | 743 | 187.5 |
| D | 12 | 235 | 1857377 | 9900.38 | 767 | 743 | 187.5 |
| D | 1 | 52 | 597521 | 3182.28 | 767 | 743 | 187.5 |
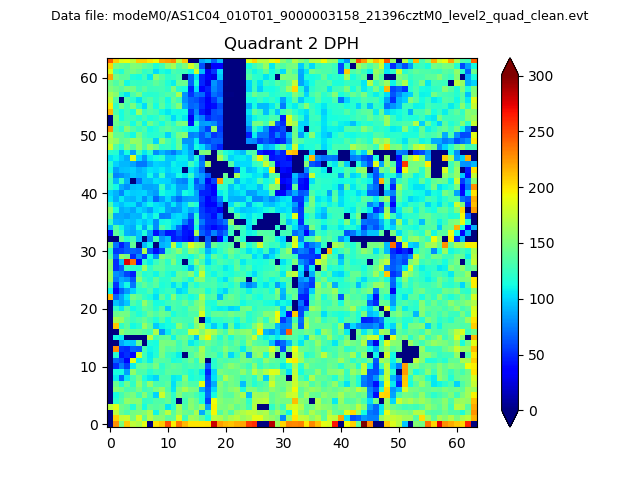
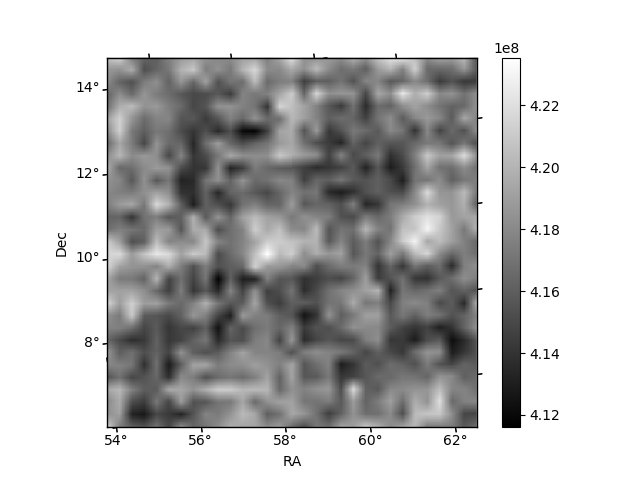
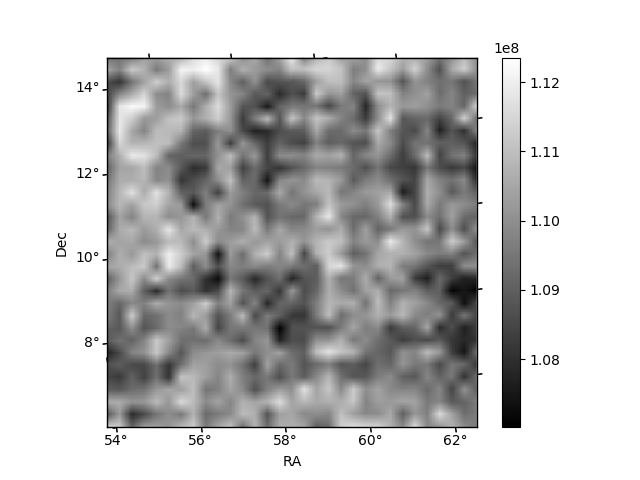
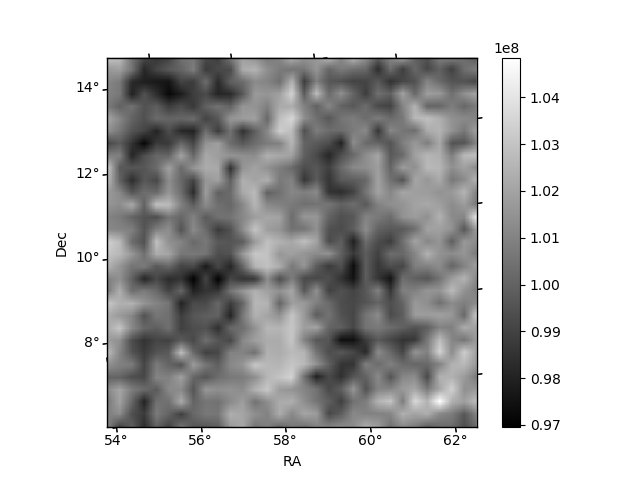
Histogram calculated using DETX and DETY for each event in the final _common_clean file
| Quadrant A | 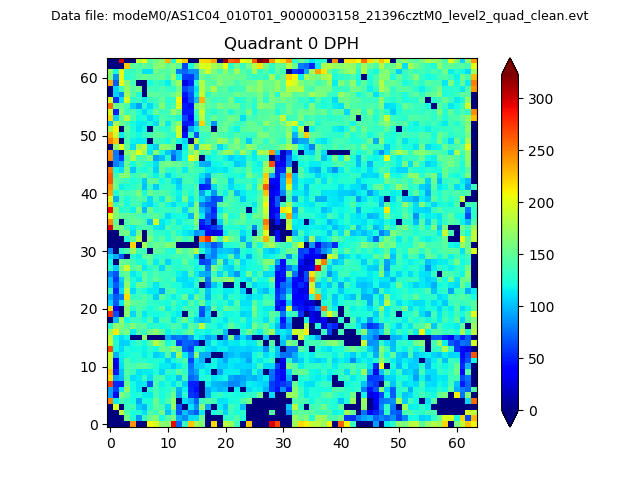 |
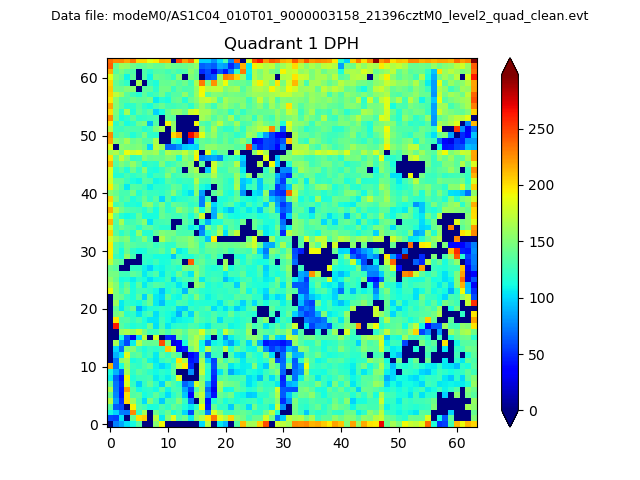 |
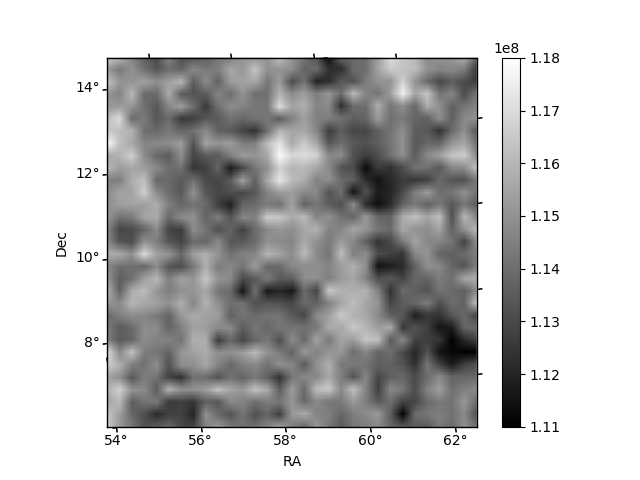
Quadrant B |
|---|---|---|---|
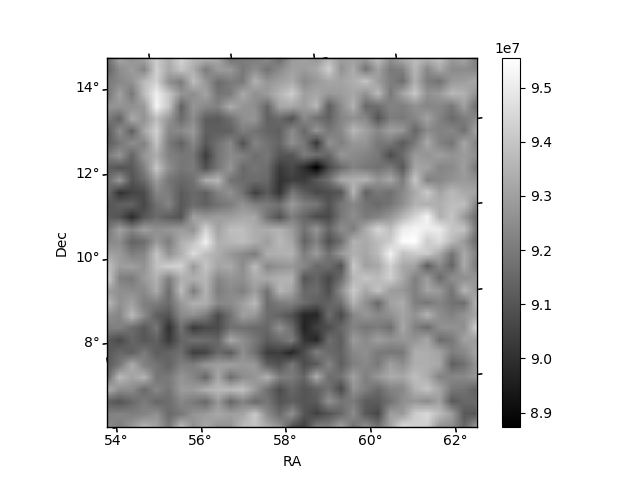
| Quadrant D | 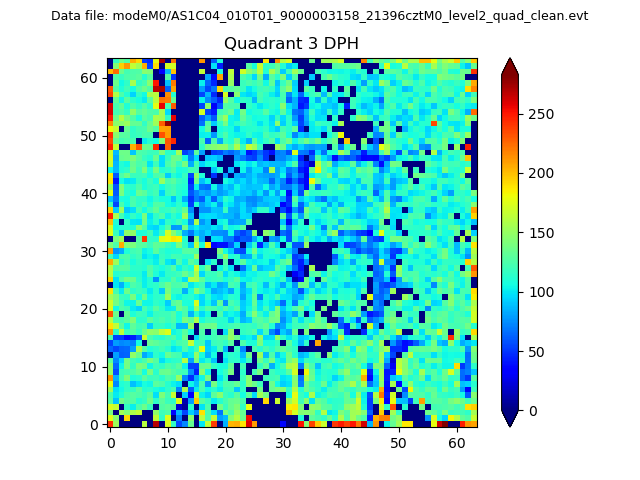 |
 |
Quadrant C |
| Plot type | Count rate plots | Images |
|---|---|---|
| Comparison with Poisson distribution Blue bars denote a histogram of data divided into 1 sec bins. Red curve is a Poisson curve with rate = median count rate of data. |
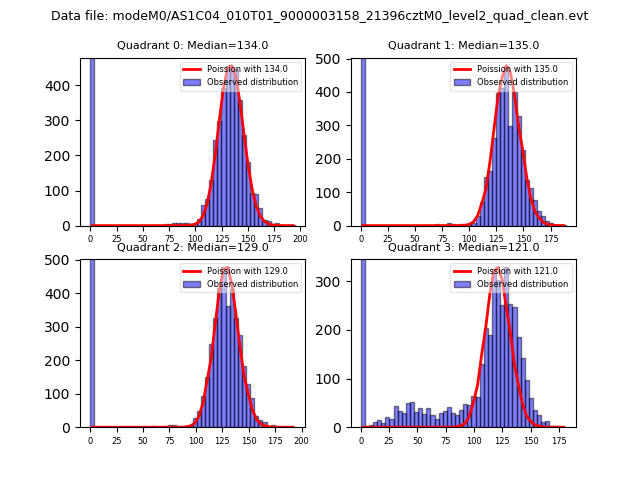 |
 |
| Quadrant-wise count rates Data is divided into 100 sec bins |
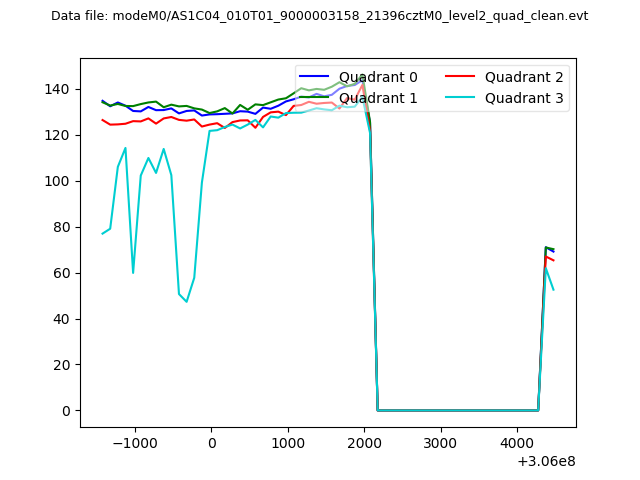 |
|
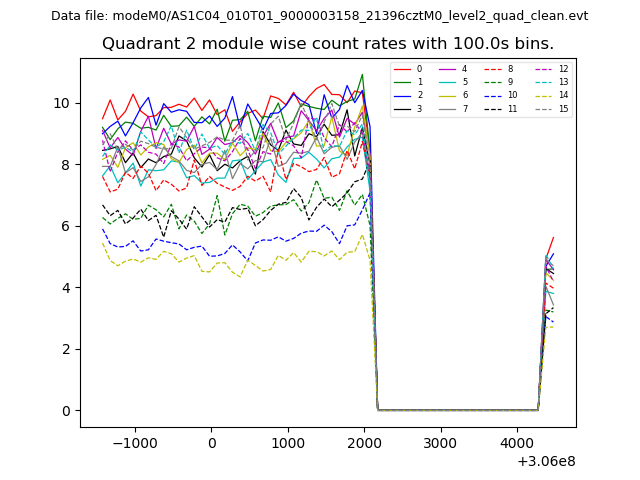
| Module-wise count rates for Quadrant A Data is divided into 100 sec bins |
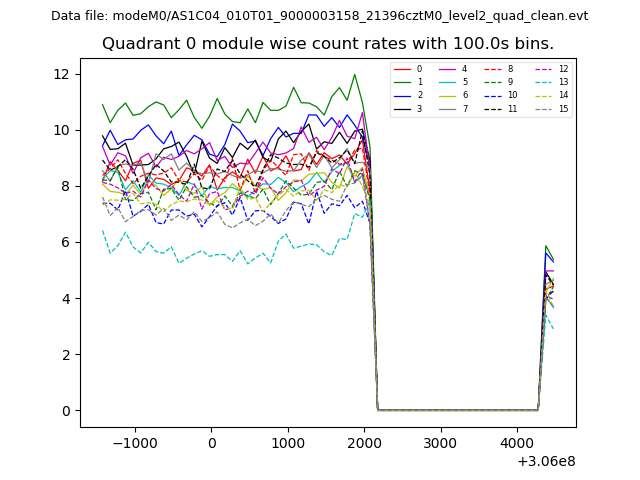 |
 |
| Module-wise count rates for Quadrant B Data is divided into 100 sec bins |
 |
 |
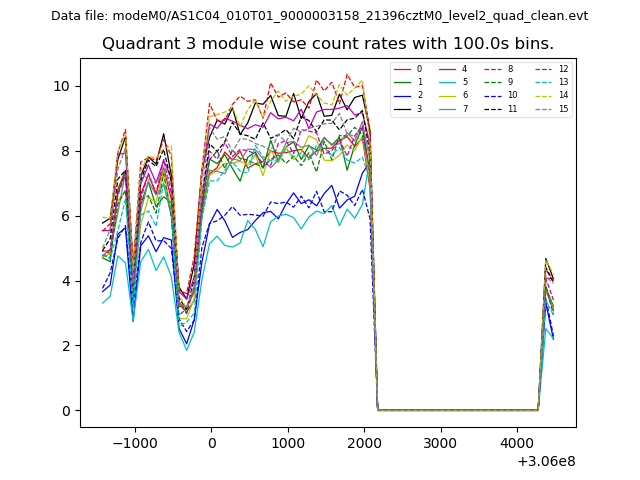
| Module-wise count rates for Quadrant C Data is divided into 100 sec bins |
 |
 |
| Module-wise count rates for Quadrant D Data is divided into 100 sec bins |
 |
 |
| Parameter | Plot |
|---|---|
| CZT HV Monitor | 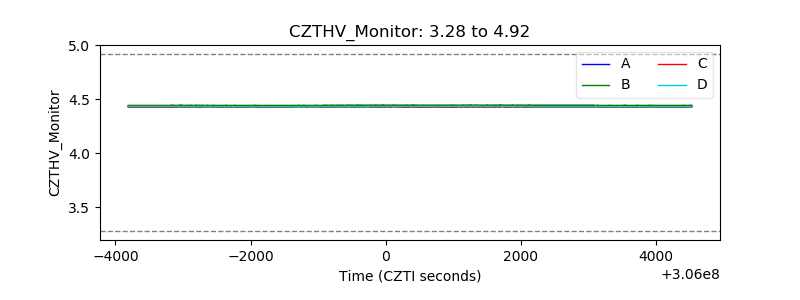 |
| D_VDD | 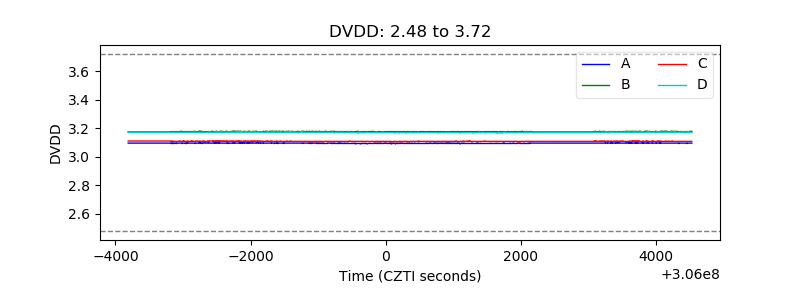 |
| Temperature 1 | 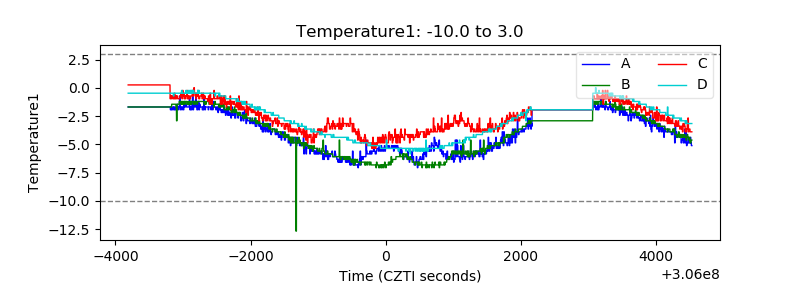 |
| Veto HV Monitor | 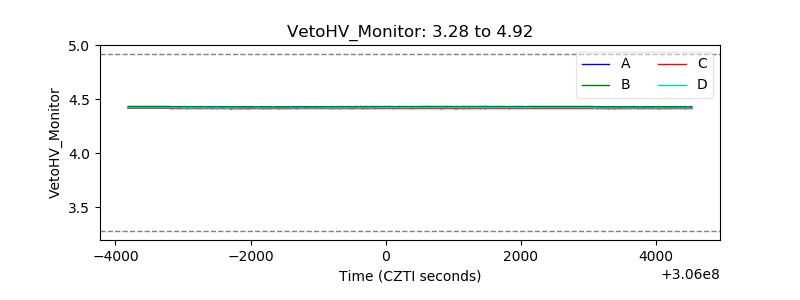 |
| Veto LLD | 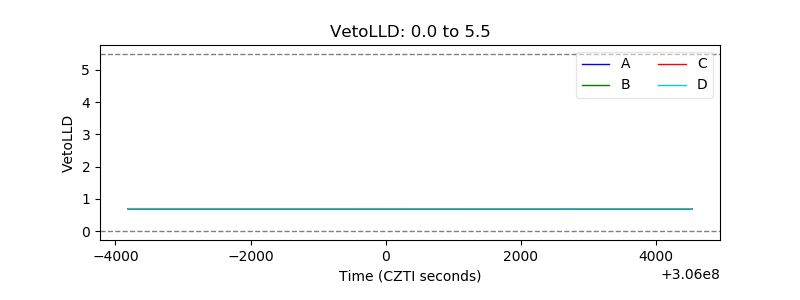 |
| Alpha Counter | 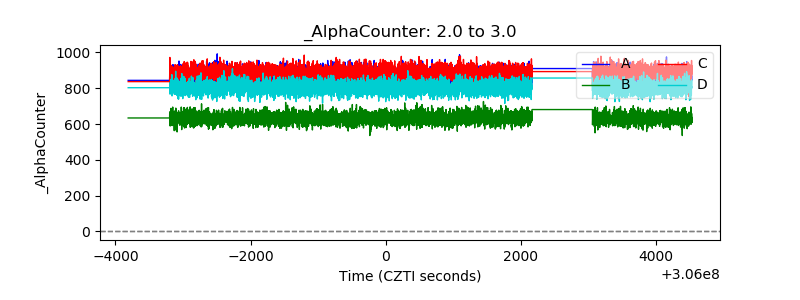 |
| _CPM_Rate | 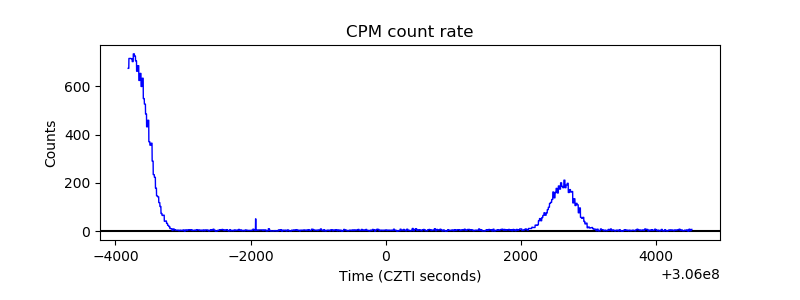 |
| CZT Counter | 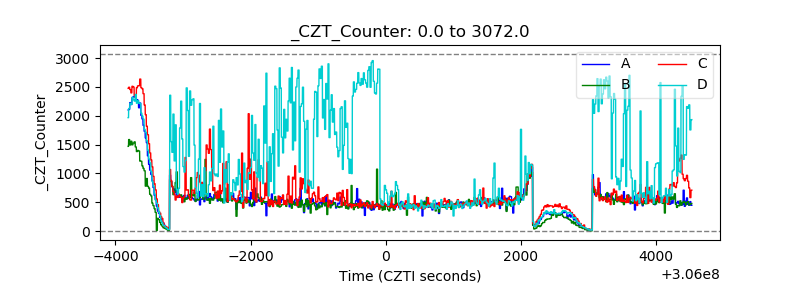 |
| +2.5 Volts monitor |  |
| +5 Volts monitor |  |
| _ROLL_ROT | 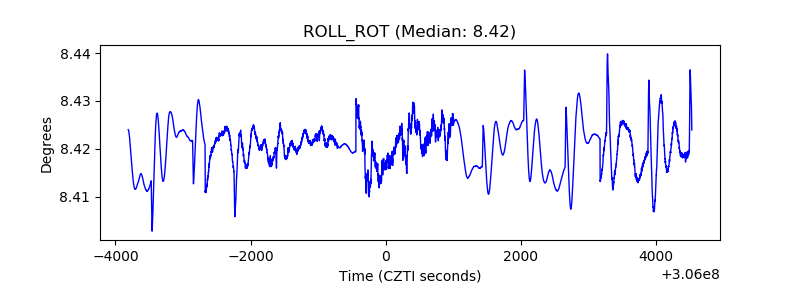 |
| _Roll_DEC | 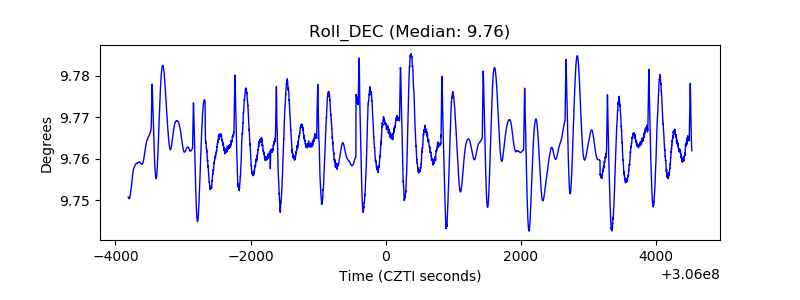 |
| _Roll_RA | 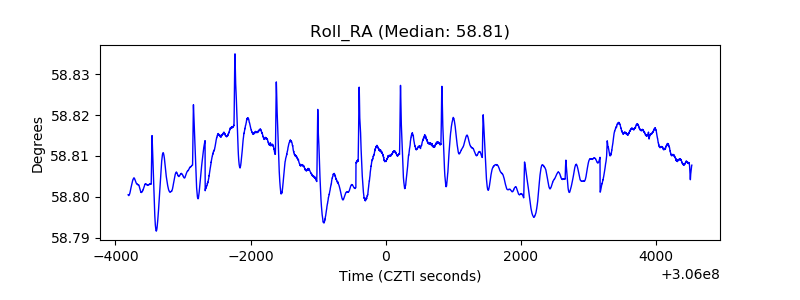 |
| Veto Counter | 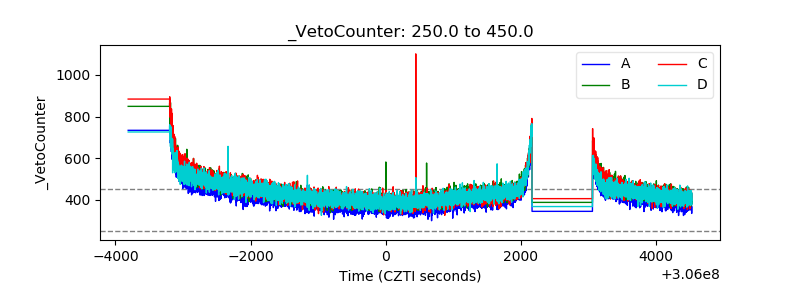 |