| Param | Original file | Final file |
|---|---|---|
| Filename | modeM0/AS1C04_010T01_9000003158_21397cztM0_level2.evt | modeM0/AS1C04_010T01_9000003158_21397cztM0_level2_quad_clean.evt |
| Size (bytes) | 170,743,680 | 19,347,840 |
| Size | 162.8 MB | 18.5 MB |
| Events in quadrant A | 872,400 | 119,285 |
| Events in quadrant B | 846,083 | 120,481 |
| Events in quadrant C | 1,219,692 | 113,266 |
| Events in quadrant D | 2,111,975 | 104,056 |
| Mode SS | |||
|---|---|---|---|
| Quadrant | BADHDUFLAG | Total packets | Discarded packets |
| A | 0 | 34 | 0 |
| B | 0 | 34 | 0 |
| C | 0 | 34 | 0 |
| D | 0 | 34 | 0 |
| Mode M0 | |||
|---|---|---|---|
| Quadrant | BADHDUFLAG | Total packets | Discarded packets |
| A | 0 | 3578 | 0 |
| B | 0 | 3570 | 0 |
| C | 0 | 4746 | 0 |
| D | 0 | 7466 | 0 |
| Quadrant | Total seconds | Saturated seconds | Saturation percentage |
|---|---|---|---|
| A | 1750 | 2 | 0.114286% |
| B | 1751 | 1 | 0.057110% |
| C | 1751 | 28 | 1.599086% |
| D | 1751 | 280 | 15.990862% |
Noise dominated data is calculated using 1-second bins in cleaned event files. If a bin has >2000 counts, and if more than 50% of those come from <1% of pixels, then it is considered to be noise-dominated and hence unusable.
| Quadrant | # 1 sec bins | Bins with >0 counts | Bins with >2000 counts | High rate bins dominated by noise | Noise dominated (total time) | Noise dominated (detector-on time) | Marked lightcurve |
|---|---|---|---|---|---|---|---|
| A | 1750 | 1750 | 0 | 0 | 0.00% | 0.00% | 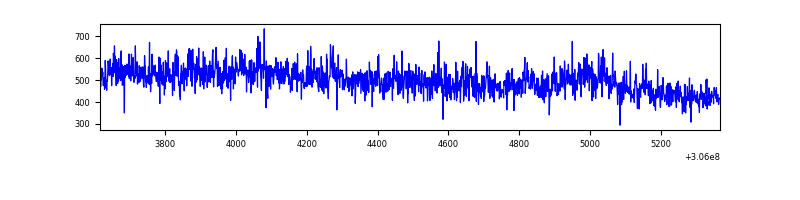 |
| B | 1751 | 1751 | 0 | 0 | 0.00% | 0.00% | 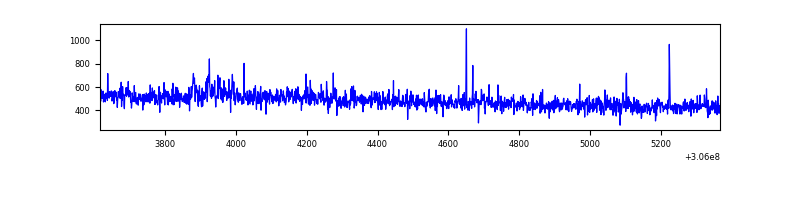 |
| C | 1751 | 1751 | 1 | 1 | 0.06% | 0.06% | 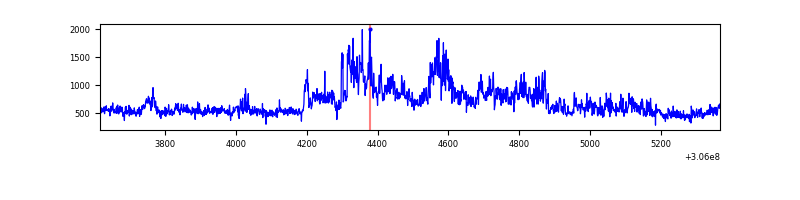 |
| D | 1751 | 1751 | 248 | 248 | 14.16% | 14.16% | 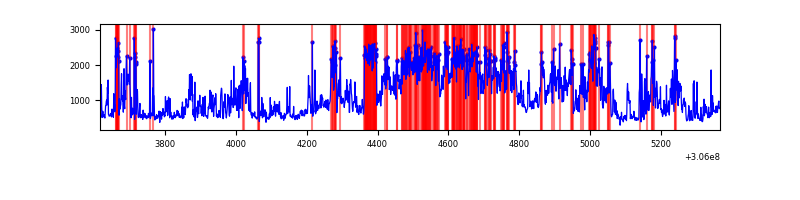 |
Top three noisy pixels from each quadrant. If the there are fewer than three noisy pixels in the level2.evt file, extra rows are filled as -1
| Pixel properties | Quadrant properties | ||||||
|---|---|---|---|---|---|---|---|
| Quadrant | DetID | PixID | Counts | Sigma | Mean | Median | Sigma |
| A | 5 | 168 | 32407 | 738.13 | 211 | 206 | 43.6 |
| A | 11 | 47 | 23844 | 541.85 | 211 | 206 | 43.6 |
| A | 13 | 254 | 3377 | 72.69 | 211 | 206 | 43.6 |
| B | 0 | 245 | 8294 | 187.2 | 211 | 206 | 43.2 |
| B | 0 | 190 | 5931 | 132.5 | 211 | 206 | 43.2 |
| B | 12 | 111 | 4676 | 103.46 | 211 | 206 | 43.2 |
| C | 3 | 233 | 367882 | 7395.47 | 204 | 205 | 49.7 |
| C | 14 | 238 | 32470 | 648.98 | 204 | 205 | 49.7 |
| C | 10 | 91 | 23982 | 478.25 | 204 | 205 | 49.7 |
| D | 13 | 174 | 581220 | 11574.31 | 196 | 190 | 50.2 |
| D | 1 | 20 | 342781 | 6824.53 | 196 | 190 | 50.2 |
| D | 12 | 235 | 298903 | 5950.46 | 196 | 190 | 50.2 |
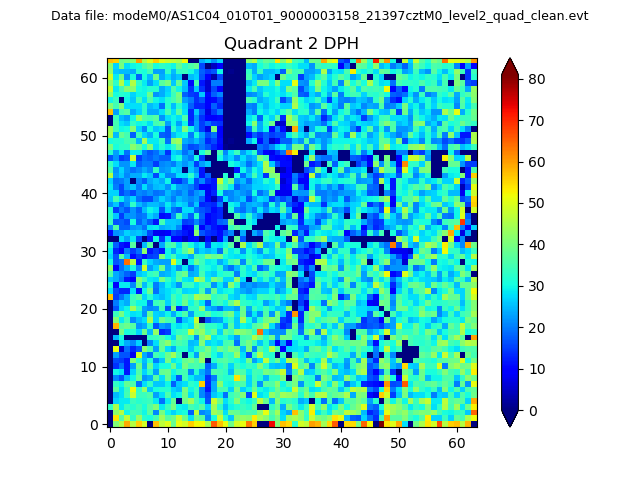
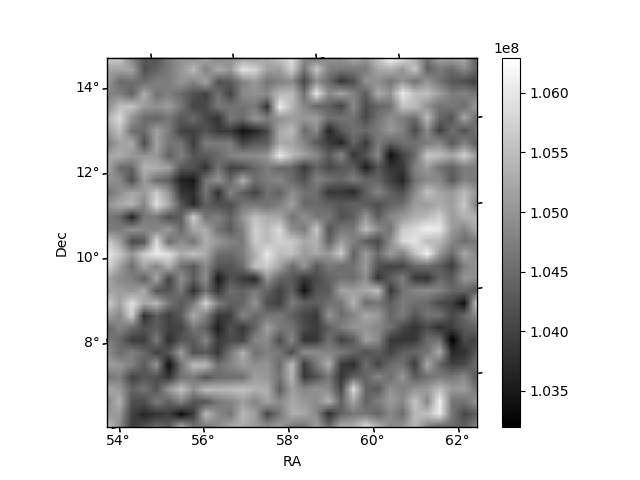
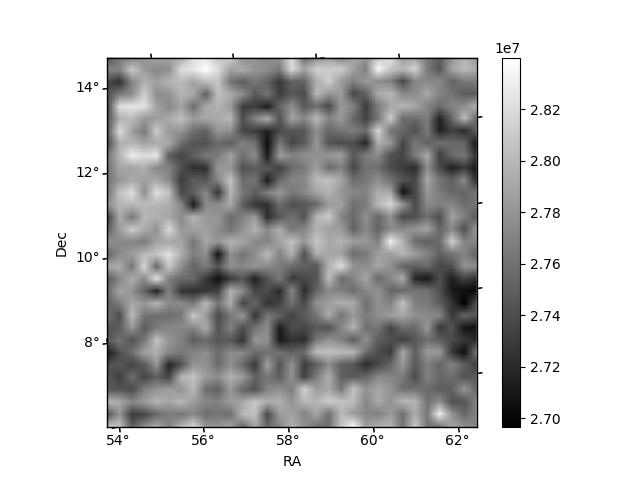
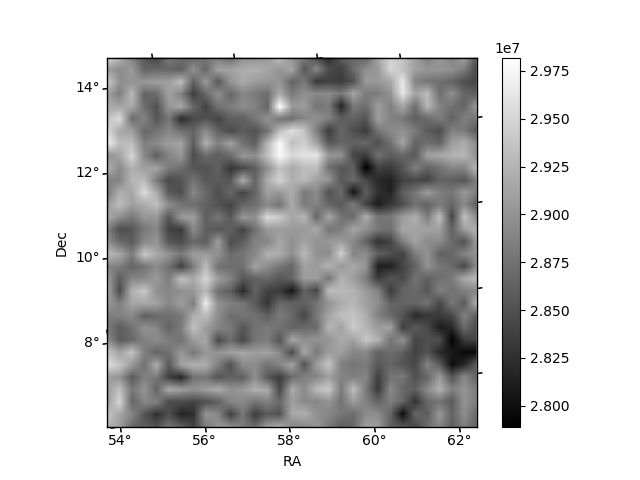
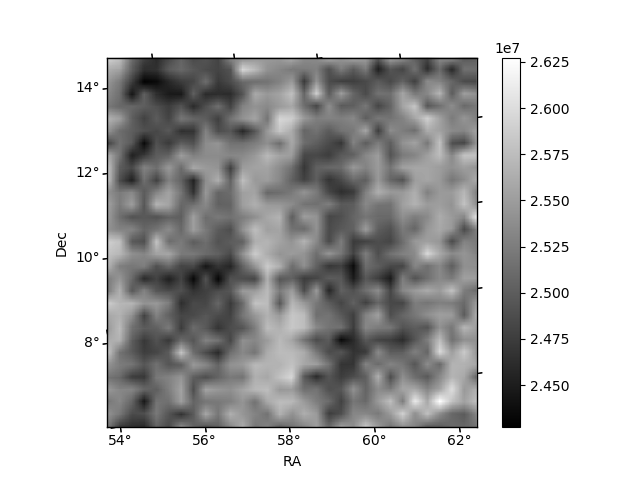
Histogram calculated using DETX and DETY for each event in the final _common_clean file
| Quadrant A | 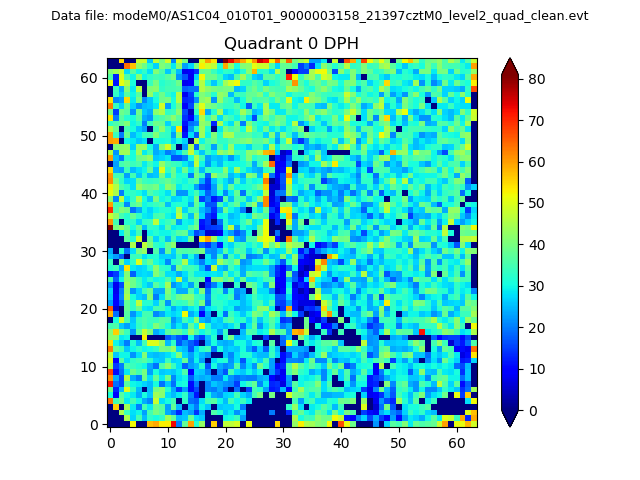 |
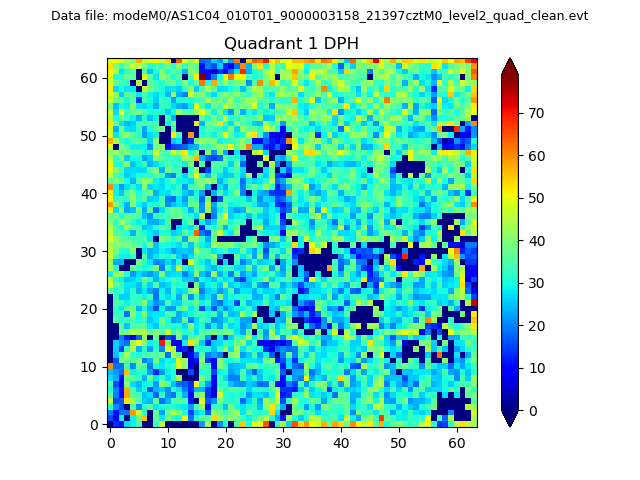 |
Quadrant B |
|---|---|---|---|
| Quadrant D | 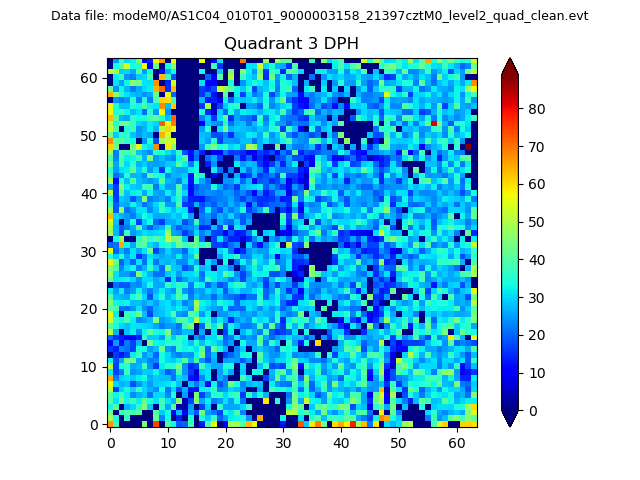 |
 |
Quadrant C |
| Plot type | Count rate plots | Images |
|---|---|---|
| Comparison with Poisson distribution Blue bars denote a histogram of data divided into 1 sec bins. Red curve is a Poisson curve with rate = median count rate of data. |
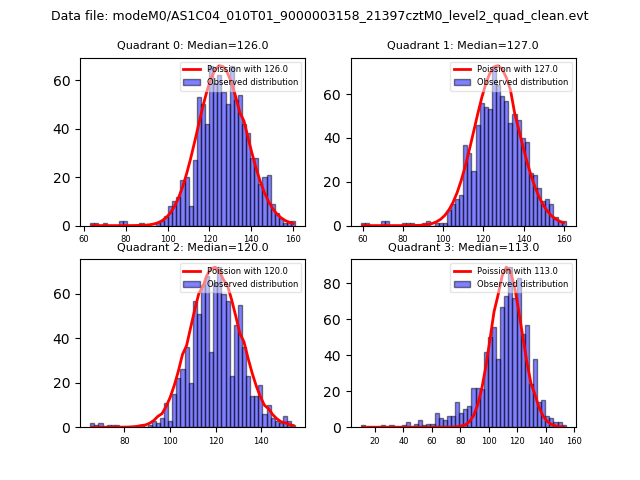 |
 |
| Quadrant-wise count rates Data is divided into 100 sec bins |
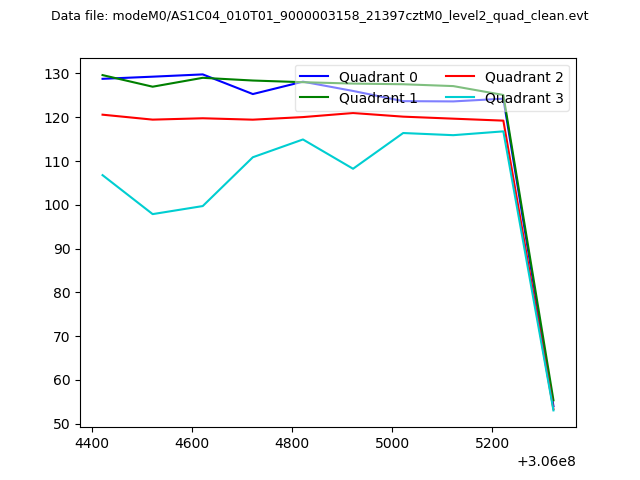 |
|
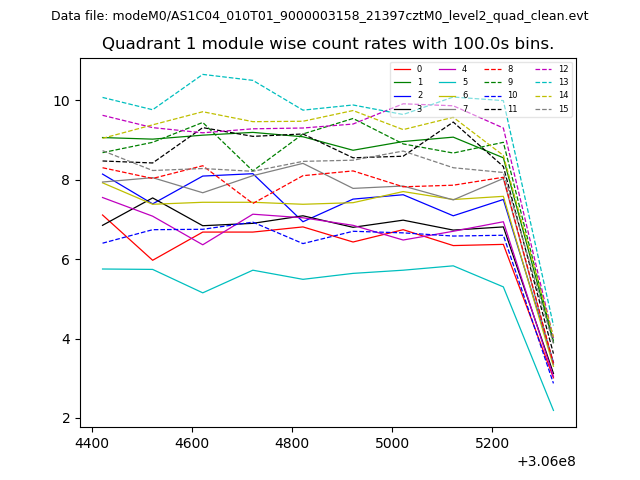
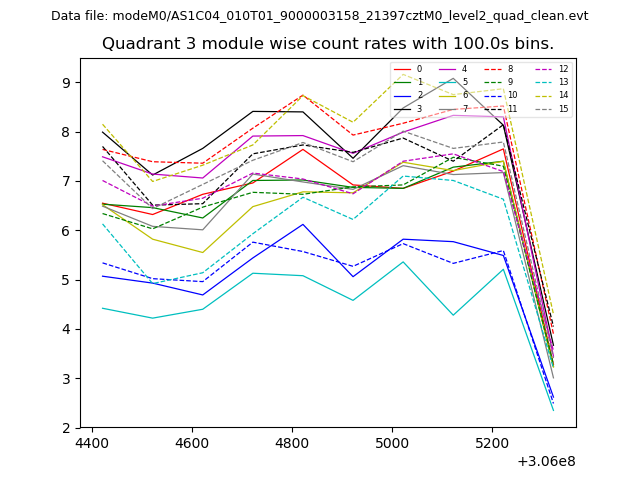
| Module-wise count rates for Quadrant A Data is divided into 100 sec bins |
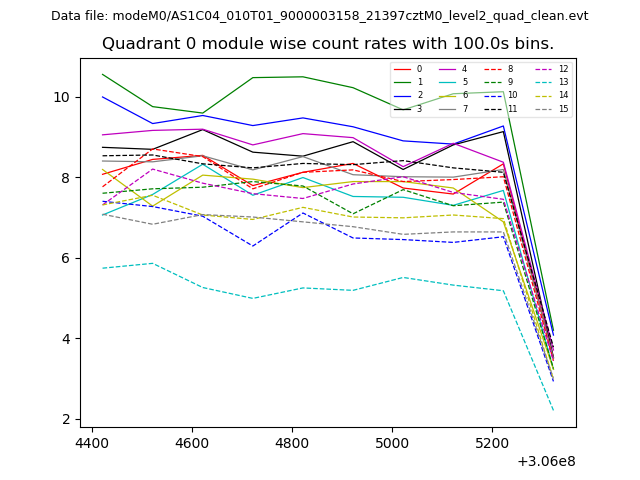 |
 |
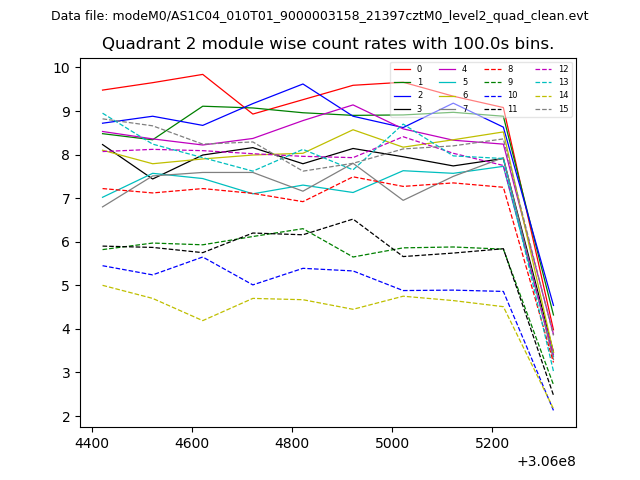
| Module-wise count rates for Quadrant B Data is divided into 100 sec bins |
 |
 |
| Module-wise count rates for Quadrant C Data is divided into 100 sec bins |
 |
 |
| Module-wise count rates for Quadrant D Data is divided into 100 sec bins |
 |
 |
| Parameter | Plot |
|---|---|
| CZT HV Monitor | 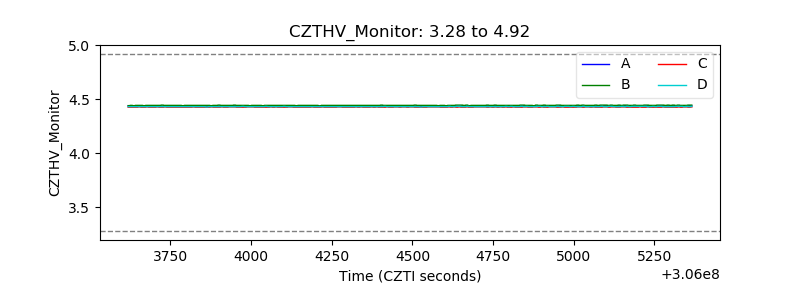 |
| D_VDD | 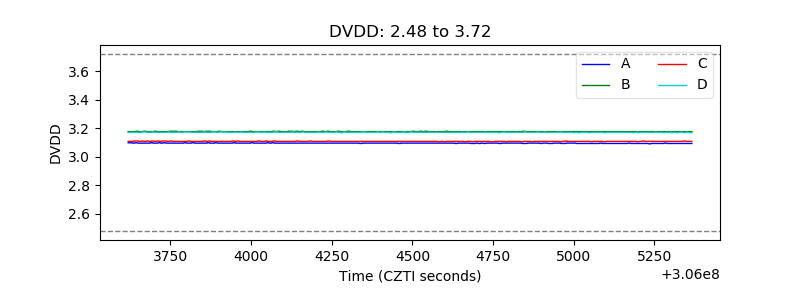 |
| Temperature 1 | 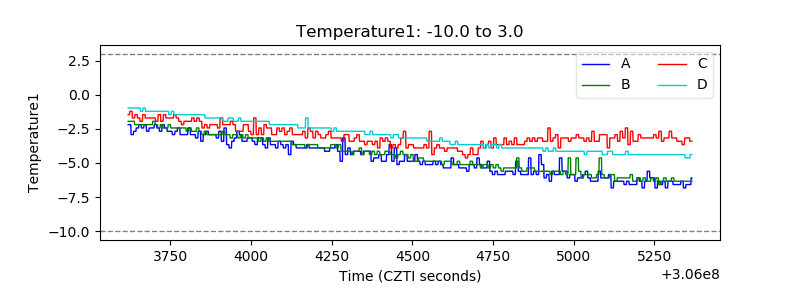 |
| Veto HV Monitor | 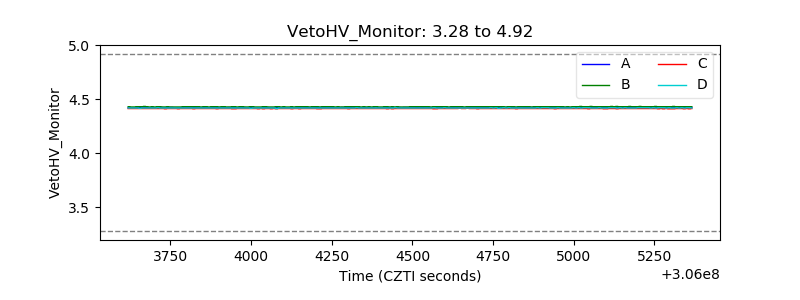 |
| Veto LLD | 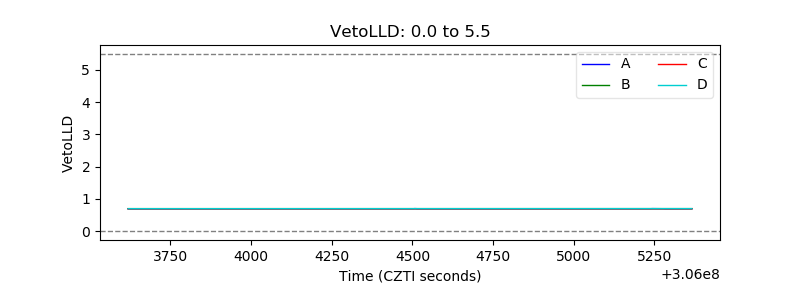 |
| Alpha Counter | 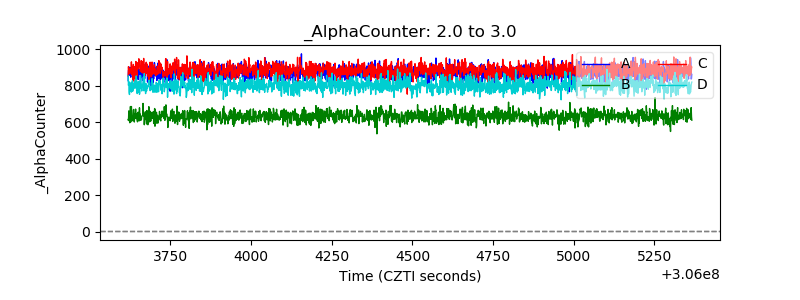 |
| _CPM_Rate | 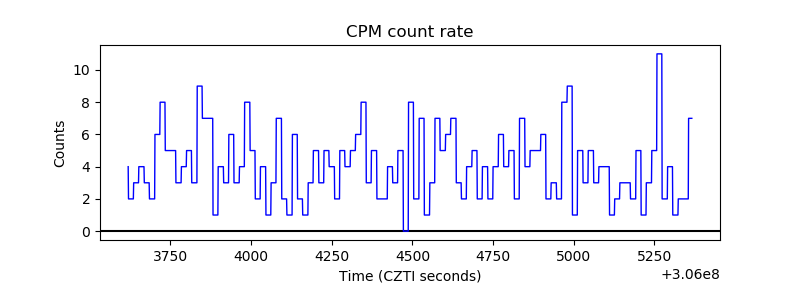 |
| CZT Counter | 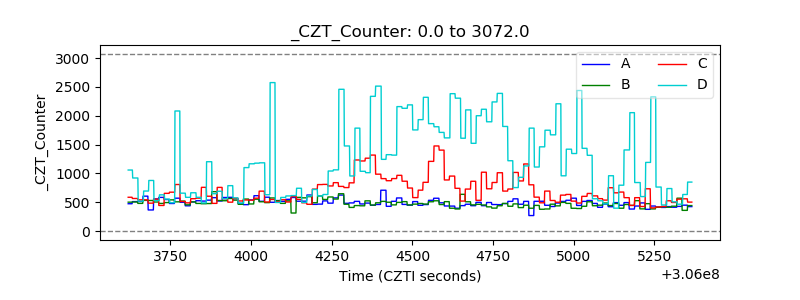 |
| +2.5 Volts monitor |  |
| +5 Volts monitor |  |
| _ROLL_ROT | 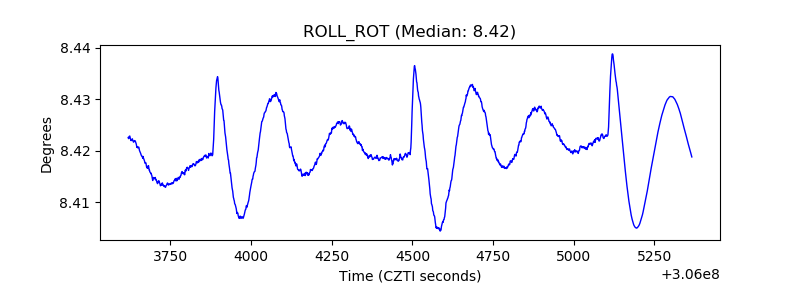 |
| _Roll_DEC | 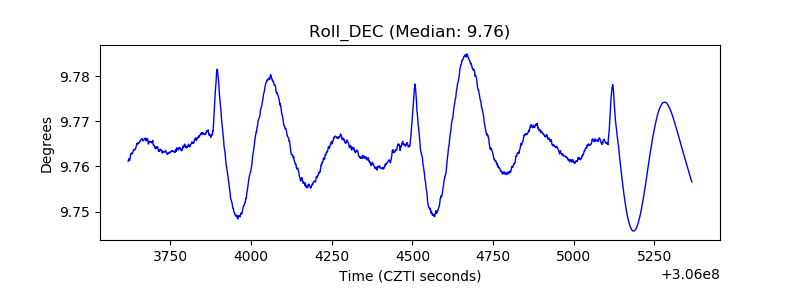 |
| _Roll_RA | 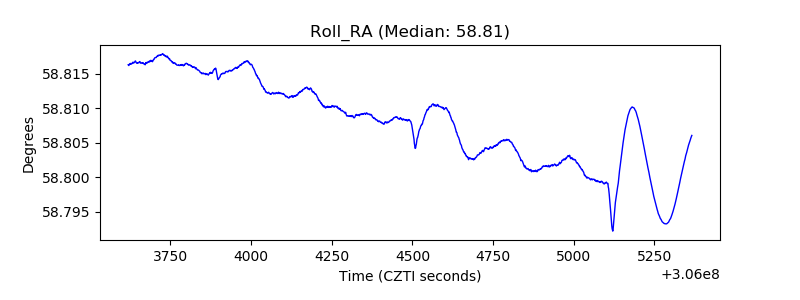 |
| Veto Counter | 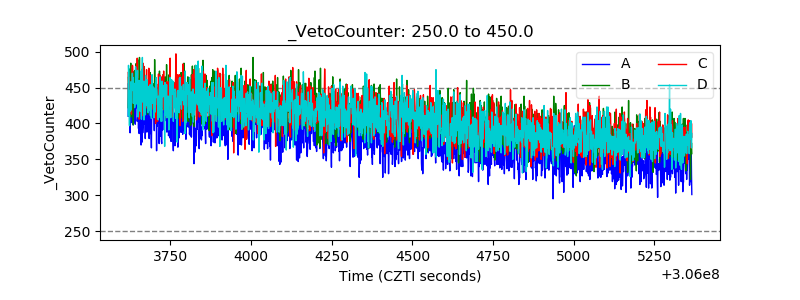 |