| Param | Original file | Final file |
|---|---|---|
| Filename | modeM0/AS1T03_140T01_9000003160_21398cztM0_level2.evt | modeM0/AS1T03_140T01_9000003160_21398cztM0_level2_quad_clean.evt |
| Size (bytes) | 834,027,840 | 101,056,320 |
| Size | 795.4 MB | 96.4 MB |
| Events in quadrant A | 3,637,705 | 688,642 |
| Events in quadrant B | 3,703,781 | 695,673 |
| Events in quadrant C | 4,813,102 | 661,686 |
| Events in quadrant D | 12,599,287 | 493,288 |
| Mode SS | |||
|---|---|---|---|
| Quadrant | BADHDUFLAG | Total packets | Discarded packets |
| A | 0 | 152 | 0 |
| B | 0 | 152 | 0 |
| C | 0 | 152 | 0 |
| D | 0 | 152 | 0 |
| Mode M0 | |||
|---|---|---|---|
| Quadrant | BADHDUFLAG | Total packets | Discarded packets |
| A | 0 | 15595 | 3 |
| B | 0 | 15884 | 2 |
| C | 0 | 19272 | 2 |
| D | 0 | 42643 | 2 |
| Mode M9 | |||
|---|---|---|---|
| Quadrant | BADHDUFLAG | Total packets | Discarded packets |
| A | 0 | 3 | 0 |
| B | 0 | 3 | 0 |
| C | 0 | 3 | 0 |
| D | 0 | 3 | 0 |
| Quadrant | Total seconds | Saturated seconds | Saturation percentage |
|---|---|---|---|
| A | 7468 | 38 | 0.508838% |
| B | 7469 | 61 | 0.816709% |
| C | 7469 | 272 | 3.641719% |
| D | 7469 | 3301 | 44.196010% |
Noise dominated data is calculated using 1-second bins in cleaned event files. If a bin has >2000 counts, and if more than 50% of those come from <1% of pixels, then it is considered to be noise-dominated and hence unusable.
| Quadrant | # 1 sec bins | Bins with >0 counts | Bins with >2000 counts | High rate bins dominated by noise | Noise dominated (total time) | Noise dominated (detector-on time) | Marked lightcurve |
|---|---|---|---|---|---|---|---|
| A | 7753 | 7469 | 0 | 0 | 0.00% | 0.00% | 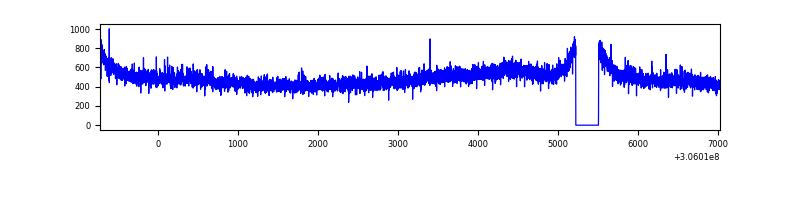 |
| B | 7754 | 7470 | 8 | 8 | 0.10% | 0.11% | 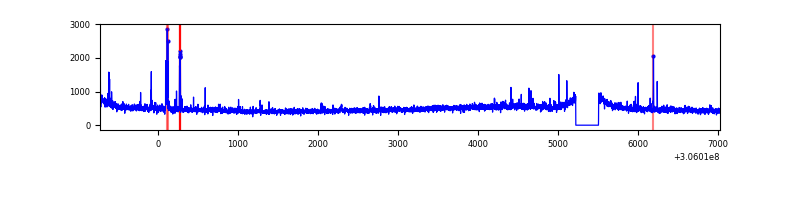 |
| C | 7754 | 7470 | 60 | 60 | 0.77% | 0.80% | 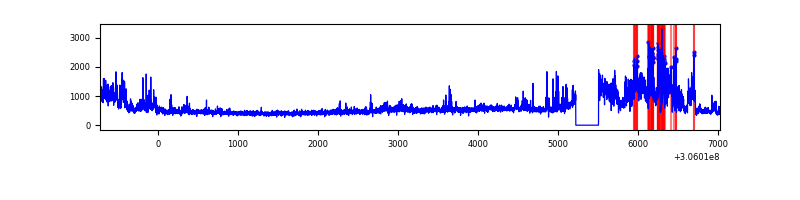 |
| D | 7753 | 7468 | 3155 | 3155 | 40.69% | 42.25% | 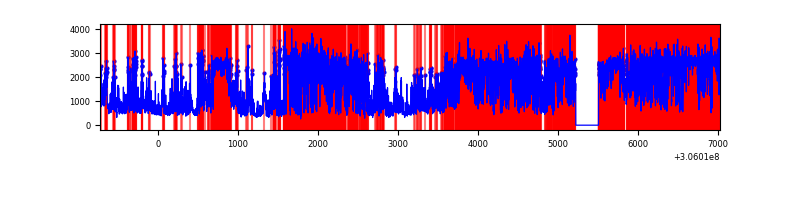 |
Top three noisy pixels from each quadrant. If the there are fewer than three noisy pixels in the level2.evt file, extra rows are filled as -1
| Pixel properties | Quadrant properties | ||||||
|---|---|---|---|---|---|---|---|
| Quadrant | DetID | PixID | Counts | Sigma | Mean | Median | Sigma |
| A | 5 | 168 | 140870 | 767.46 | 905 | 888 | 182.4 |
| A | 13 | 254 | 13084 | 66.87 | 905 | 888 | 182.4 |
| A | 0 | 226 | 8003 | 39.01 | 905 | 888 | 182.4 |
| B | 0 | 228 | 46353 | 262.96 | 903 | 882 | 172.9 |
| B | 0 | 190 | 23962 | 133.47 | 903 | 882 | 172.9 |
| B | 5 | 172 | 20892 | 115.72 | 903 | 882 | 172.9 |
| C | 3 | 233 | 1324016 | 6579.97 | 858 | 864 | 201.1 |
| C | 14 | 238 | 133907 | 661.62 | 858 | 864 | 201.1 |
| C | 13 | 61 | 6062 | 25.85 | 858 | 864 | 201.1 |
| D | 12 | 235 | 7824567 | 44479.4 | 716 | 694 | 175.9 |
| D | 1 | 52 | 866183 | 4920.38 | 716 | 694 | 175.9 |
| D | 7 | 38 | 547681 | 3109.67 | 716 | 694 | 175.9 |
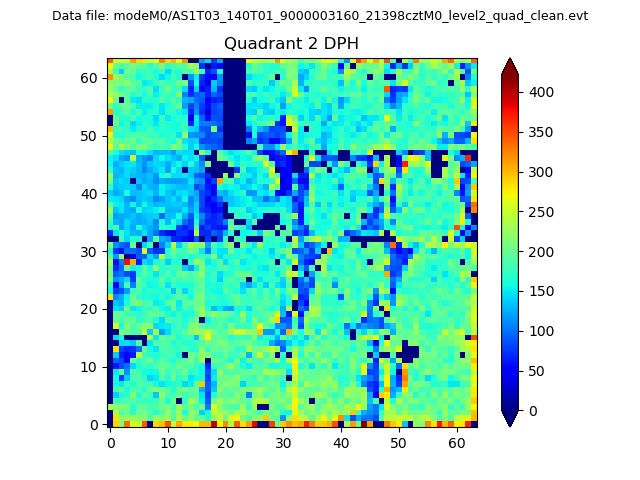
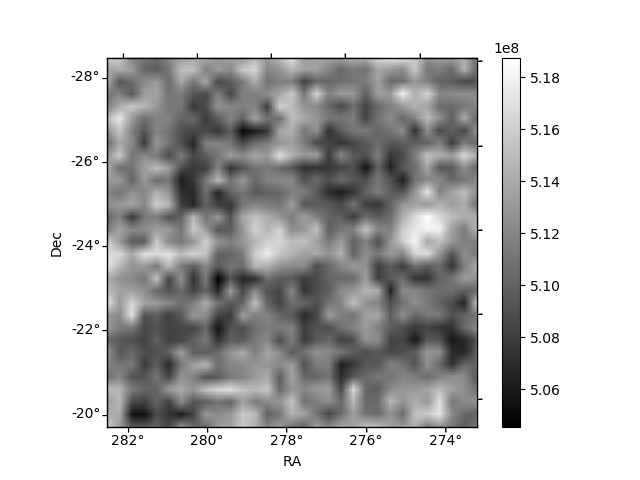
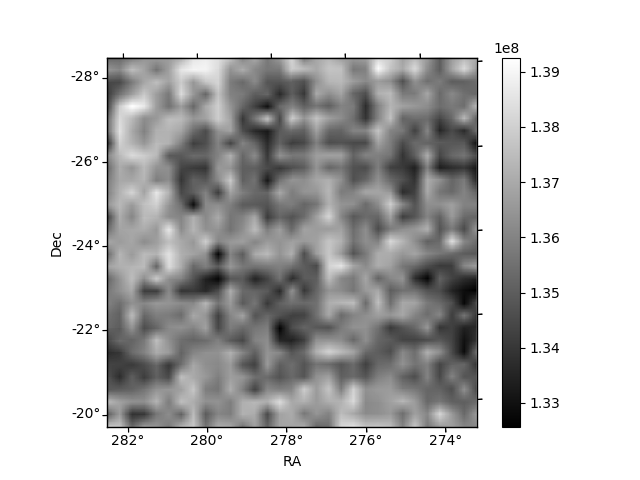
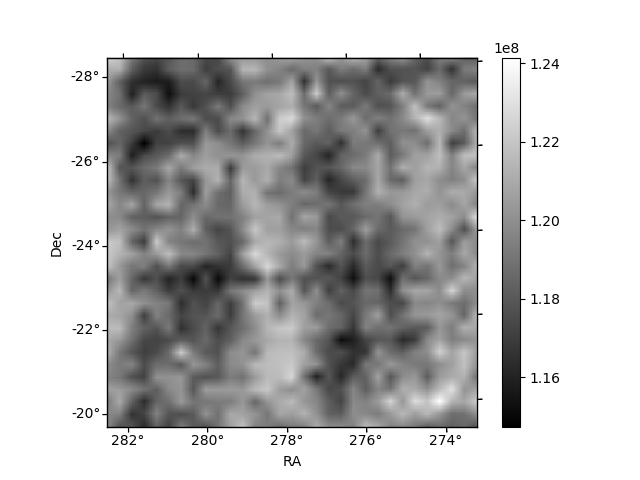
Histogram calculated using DETX and DETY for each event in the final _common_clean file
| Quadrant A | 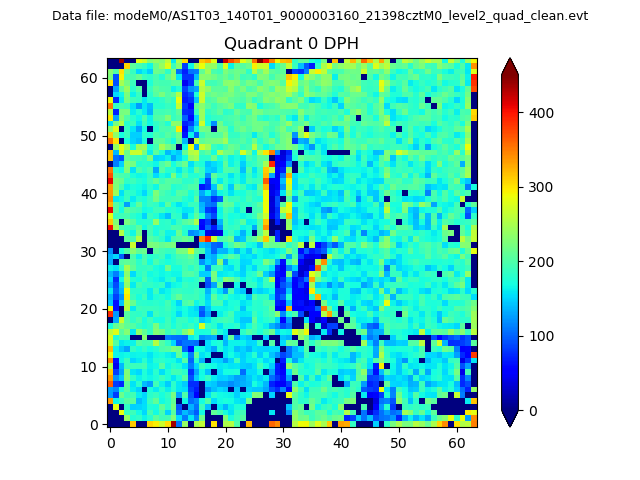 |
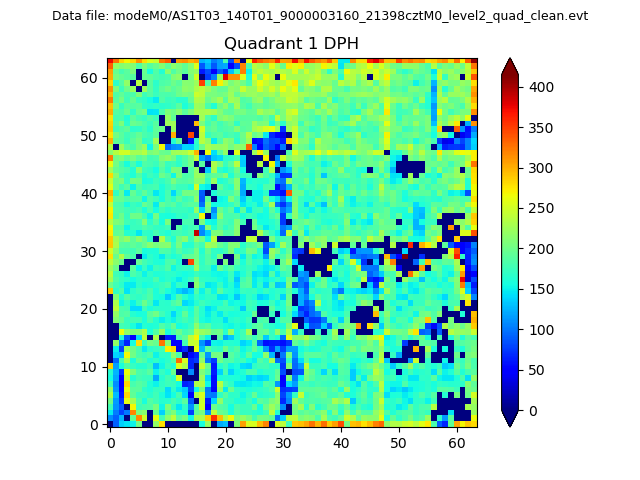 |
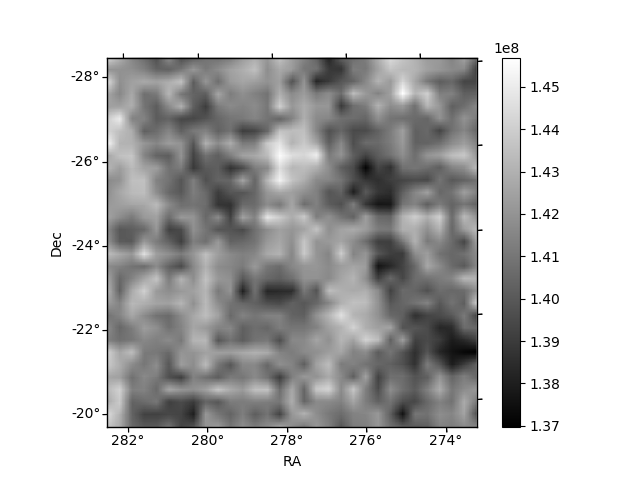
Quadrant B |
|---|---|---|---|
| Quadrant D | 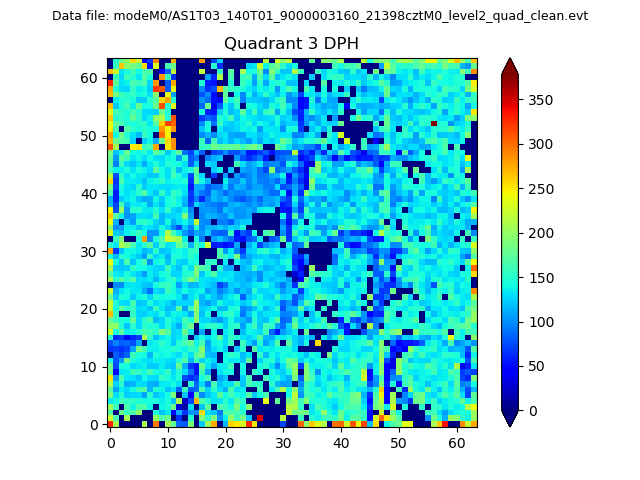 |
 |
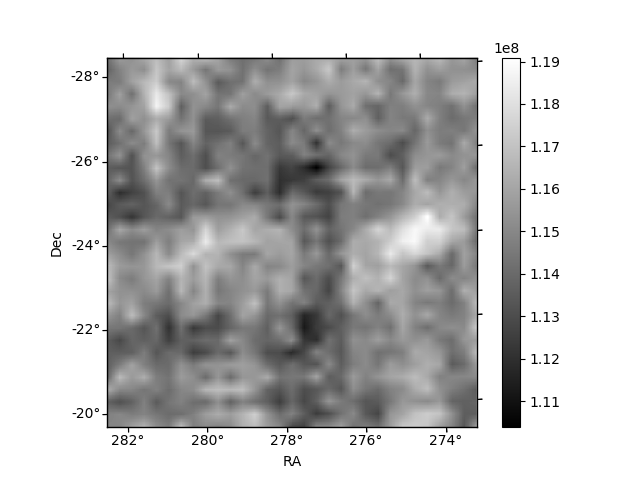
Quadrant C |
| Plot type | Count rate plots | Images |
|---|---|---|
| Comparison with Poisson distribution Blue bars denote a histogram of data divided into 1 sec bins. Red curve is a Poisson curve with rate = median count rate of data. |
 |
 |
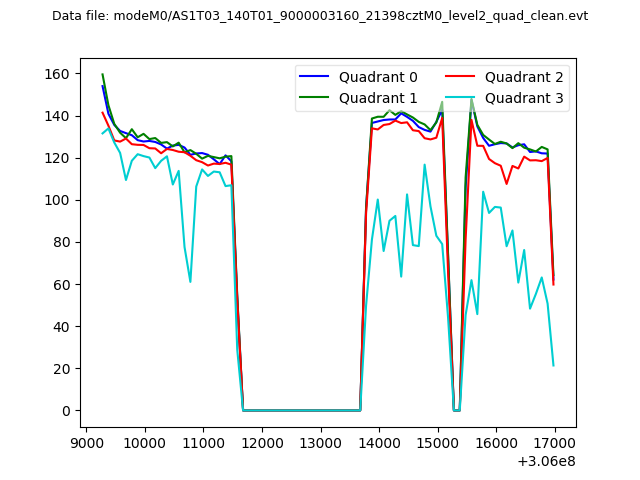
| Quadrant-wise count rates Data is divided into 100 sec bins |
 |
|
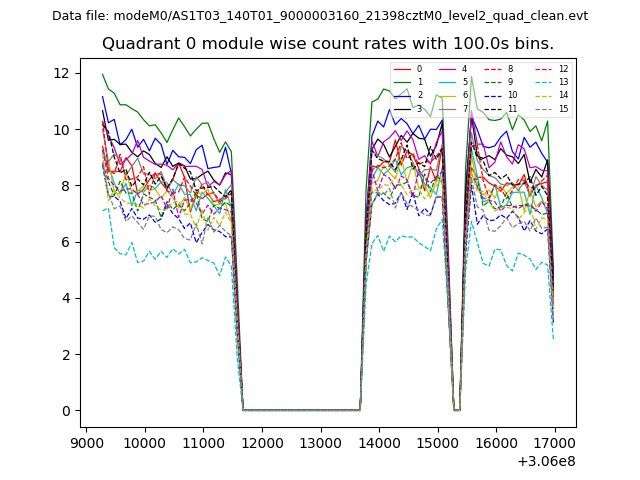
| Module-wise count rates for Quadrant A Data is divided into 100 sec bins |
 |
 |
| Module-wise count rates for Quadrant B Data is divided into 100 sec bins |
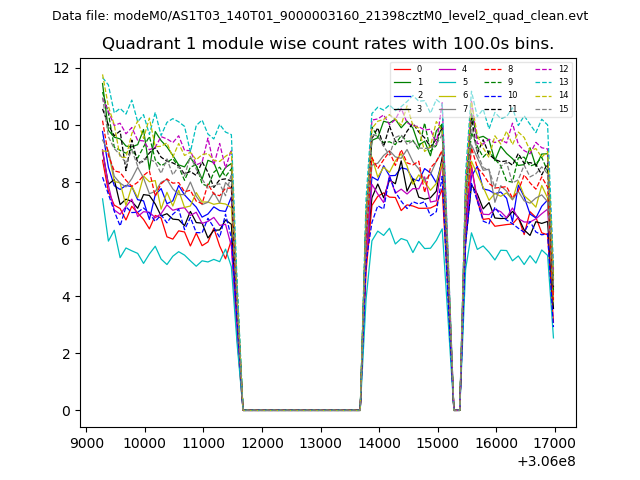 |
 |
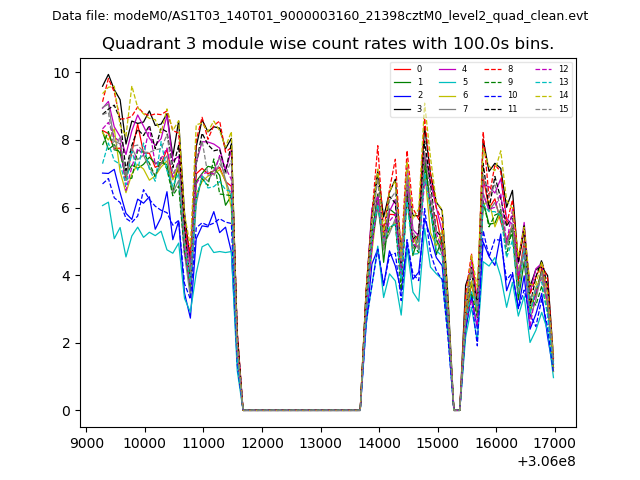
| Module-wise count rates for Quadrant C Data is divided into 100 sec bins |
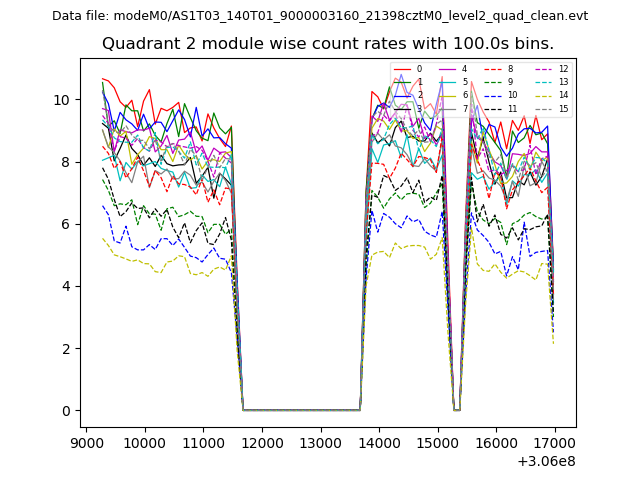 |
 |
| Module-wise count rates for Quadrant D Data is divided into 100 sec bins |
 |
 |
| Parameter | Plot |
|---|---|
| CZT HV Monitor | 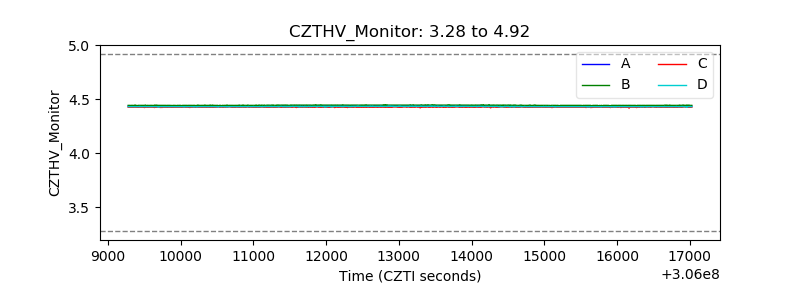 |
| D_VDD | 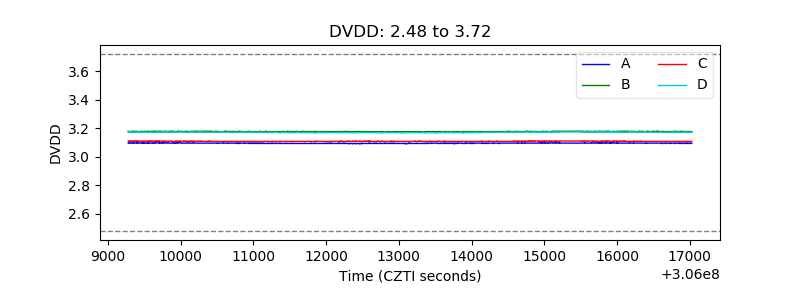 |
| Temperature 1 | 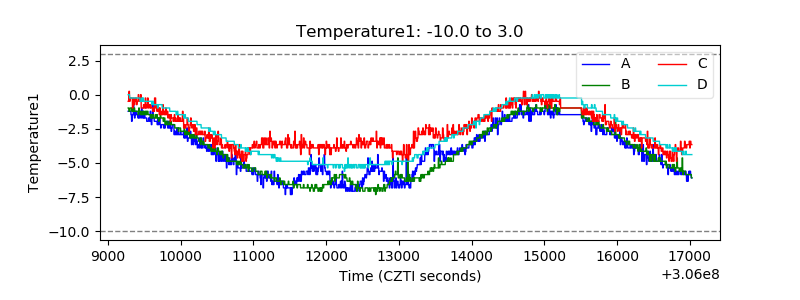 |
| Veto HV Monitor | 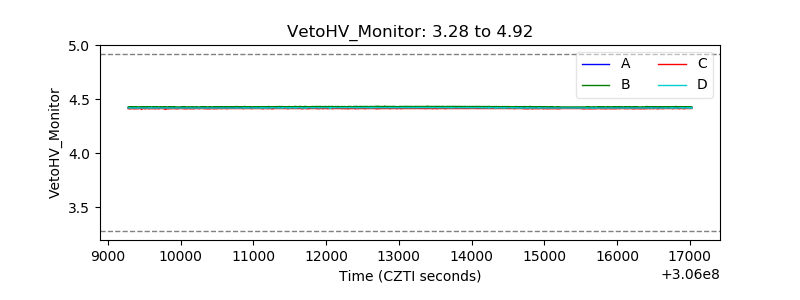 |
| Veto LLD | 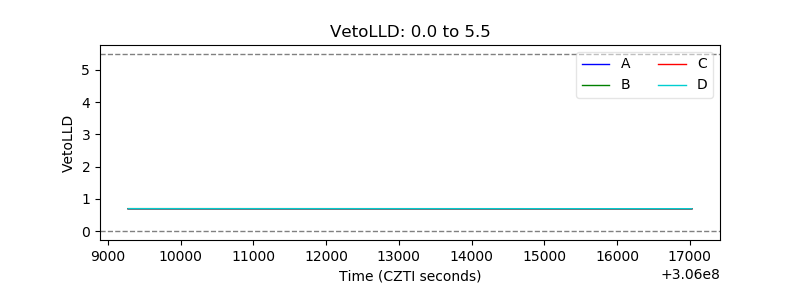 |
| Alpha Counter | 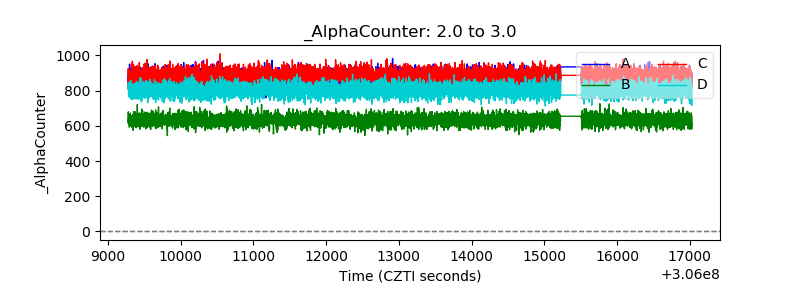 |
| _CPM_Rate | 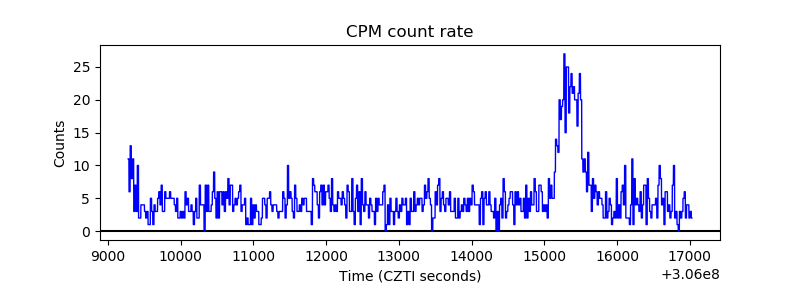 |
| CZT Counter | 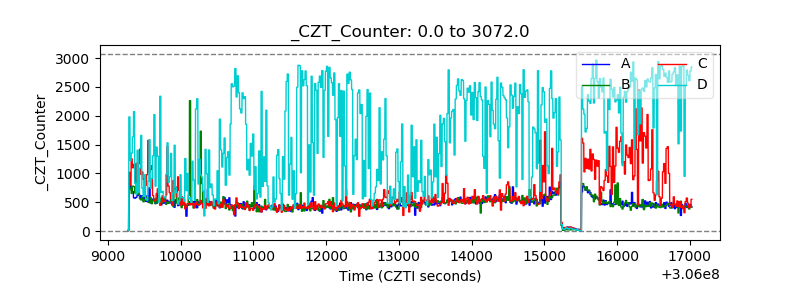 |
| +2.5 Volts monitor |  |
| +5 Volts monitor | 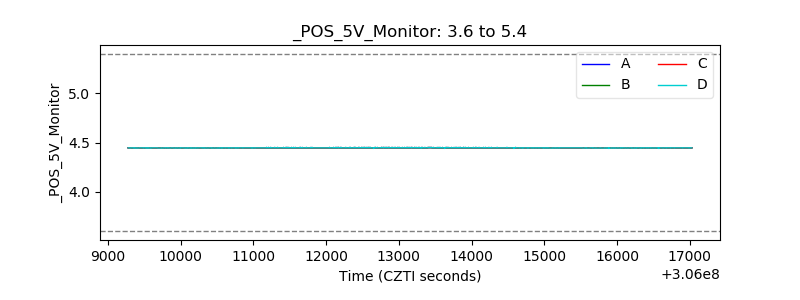 |
| _ROLL_ROT | 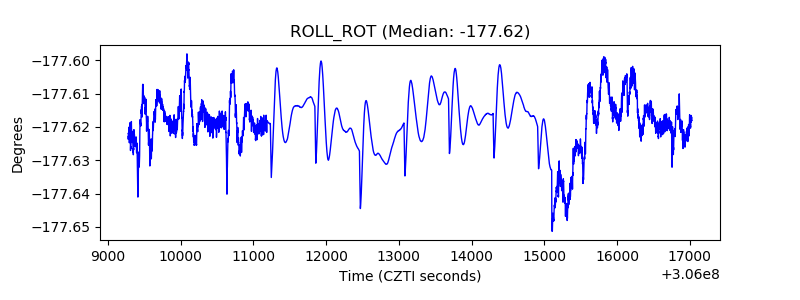 |
| _Roll_DEC | 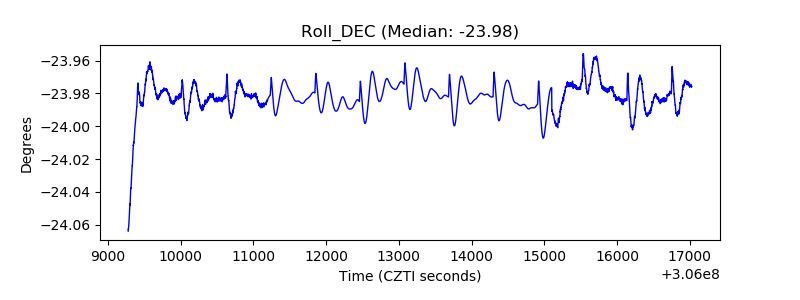 |
| _Roll_RA | 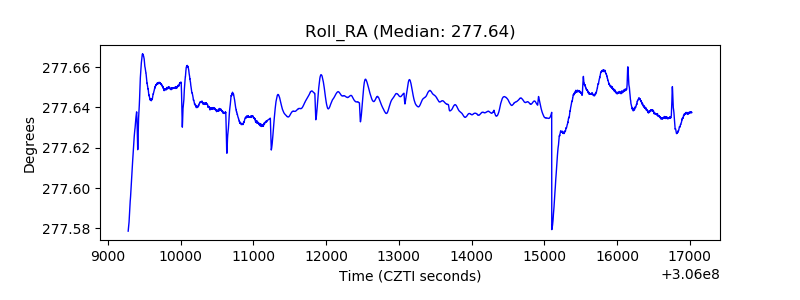 |
| Veto Counter | 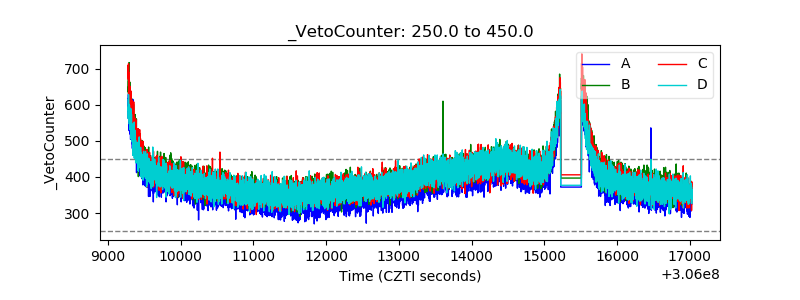 |