| Param | Original file | Final file |
|---|---|---|
| Filename | modeM0/AS1T03_140T01_9000003160_21399cztM0_level2.evt | modeM0/AS1T03_140T01_9000003160_21399cztM0_level2_quad_clean.evt |
| Size (bytes) | 784,031,040 | 98,464,320 |
| Size | 747.7 MB | 93.9 MB |
| Events in quadrant A | 3,559,028 | 662,935 |
| Events in quadrant B | 3,580,108 | 669,957 |
| Events in quadrant C | 5,460,595 | 630,226 |
| Events in quadrant D | 10,640,228 | 498,027 |
| Mode SS | |||
|---|---|---|---|
| Quadrant | BADHDUFLAG | Total packets | Discarded packets |
| A | 0 | 152 | 0 |
| B | 0 | 152 | 0 |
| C | 0 | 152 | 0 |
| D | 0 | 152 | 0 |
| Mode M0 | |||
|---|---|---|---|
| Quadrant | BADHDUFLAG | Total packets | Discarded packets |
| A | 0 | 15453 | 2 |
| B | 0 | 15575 | 2 |
| C | 0 | 21252 | 3 |
| D | 0 | 36808 | 2 |
| Mode M9 | |||
|---|---|---|---|
| Quadrant | BADHDUFLAG | Total packets | Discarded packets |
| A | 0 | 4 | 0 |
| B | 0 | 4 | 0 |
| C | 0 | 4 | 0 |
| D | 0 | 4 | 0 |
| Quadrant | Total seconds | Saturated seconds | Saturation percentage |
|---|---|---|---|
| A | 7465 | 25 | 0.334896% |
| B | 7465 | 34 | 0.455459% |
| C | 7464 | 403 | 5.399250% |
| D | 7465 | 2240 | 30.006698% |
Noise dominated data is calculated using 1-second bins in cleaned event files. If a bin has >2000 counts, and if more than 50% of those come from <1% of pixels, then it is considered to be noise-dominated and hence unusable.
| Quadrant | # 1 sec bins | Bins with >0 counts | Bins with >2000 counts | High rate bins dominated by noise | Noise dominated (total time) | Noise dominated (detector-on time) | Marked lightcurve |
|---|---|---|---|---|---|---|---|
| A | 7890 | 7466 | 0 | 0 | 0.00% | 0.00% | 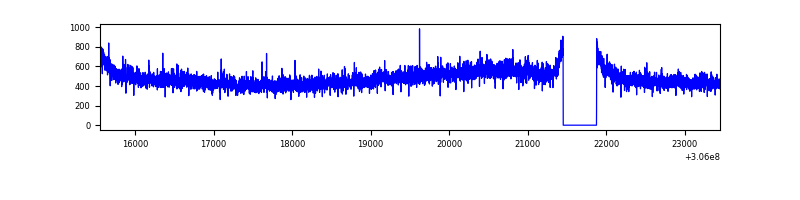 |
| B | 7890 | 7466 | 7 | 7 | 0.09% | 0.09% | 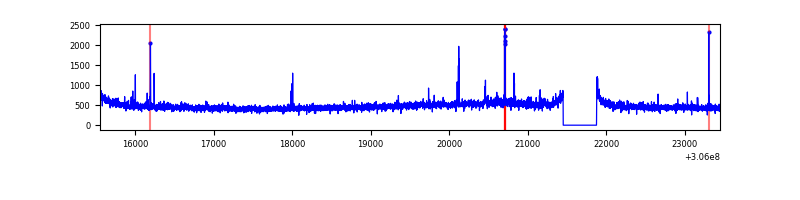 |
| C | 7889 | 7464 | 178 | 178 | 2.26% | 2.38% | 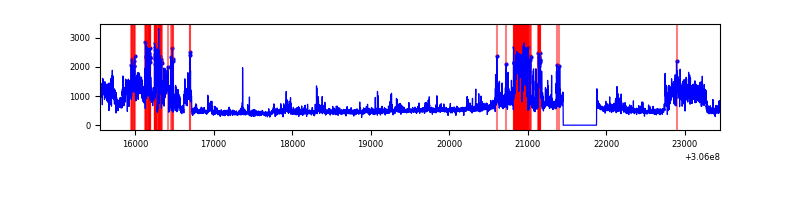 |
| D | 7890 | 7466 | 2261 | 2261 | 28.66% | 30.28% | 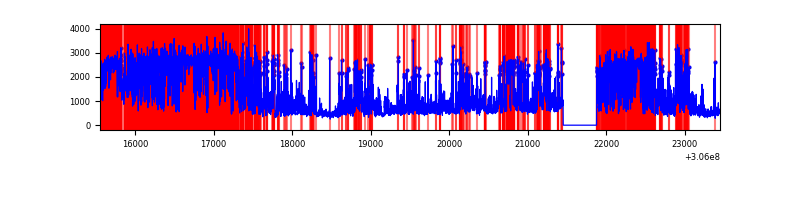 |
Top three noisy pixels from each quadrant. If the there are fewer than three noisy pixels in the level2.evt file, extra rows are filled as -1
| Pixel properties | Quadrant properties | ||||||
|---|---|---|---|---|---|---|---|
| Quadrant | DetID | PixID | Counts | Sigma | Mean | Median | Sigma |
| A | 5 | 168 | 132161 | 726.13 | 887 | 871 | 180.8 |
| A | 13 | 254 | 13501 | 69.85 | 887 | 871 | 180.8 |
| A | 0 | 226 | 7675 | 37.63 | 887 | 871 | 180.8 |
| B | 3 | 64 | 33212 | 190.87 | 885 | 863 | 169.5 |
| B | 0 | 190 | 21881 | 124.02 | 885 | 863 | 169.5 |
| B | 0 | 230 | 20881 | 118.12 | 885 | 863 | 169.5 |
| C | 3 | 233 | 2057542 | 10476.92 | 838 | 842 | 196.3 |
| C | 14 | 238 | 129717 | 656.49 | 838 | 842 | 196.3 |
| C | 13 | 61 | 5960 | 26.07 | 838 | 842 | 196.3 |
| D | 12 | 235 | 5393470 | 29166.61 | 754 | 730 | 184.9 |
| D | 1 | 52 | 1661513 | 8982.34 | 754 | 730 | 184.9 |
| D | 1 | 20 | 379537 | 2048.78 | 754 | 730 | 184.9 |
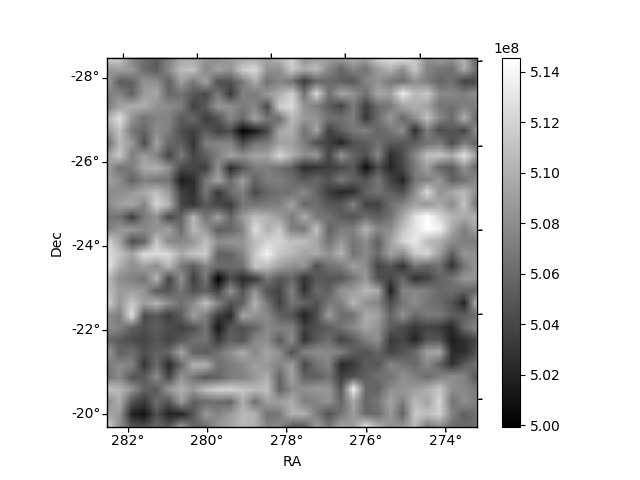
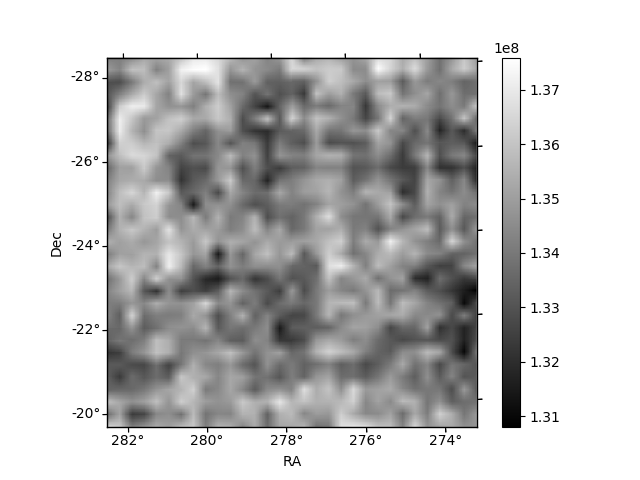
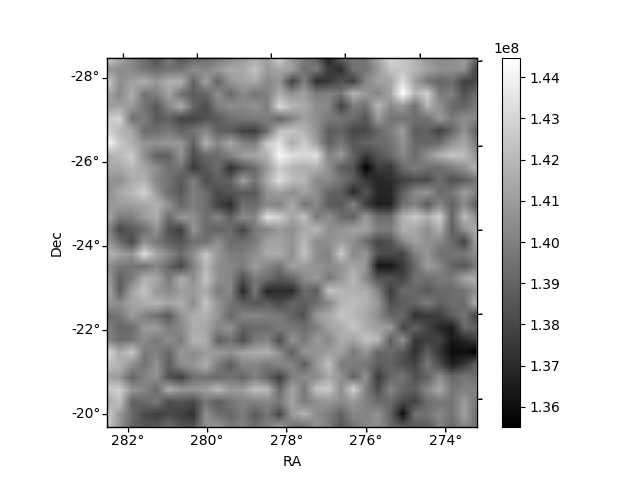
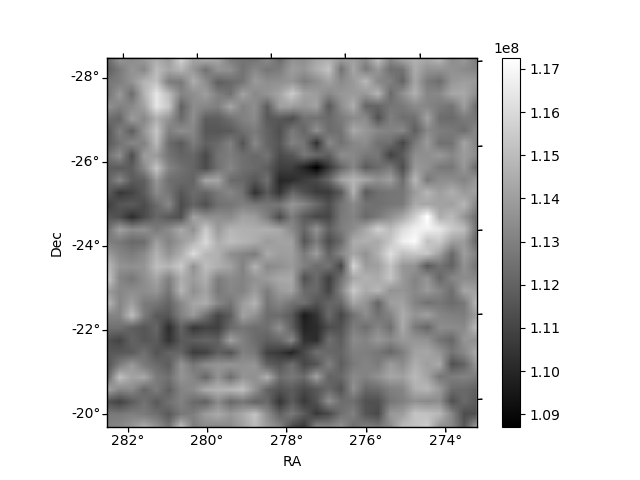
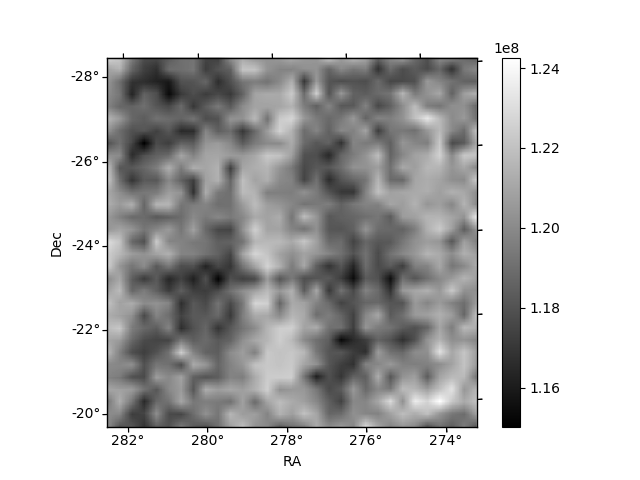
Histogram calculated using DETX and DETY for each event in the final _common_clean file
| Quadrant A | 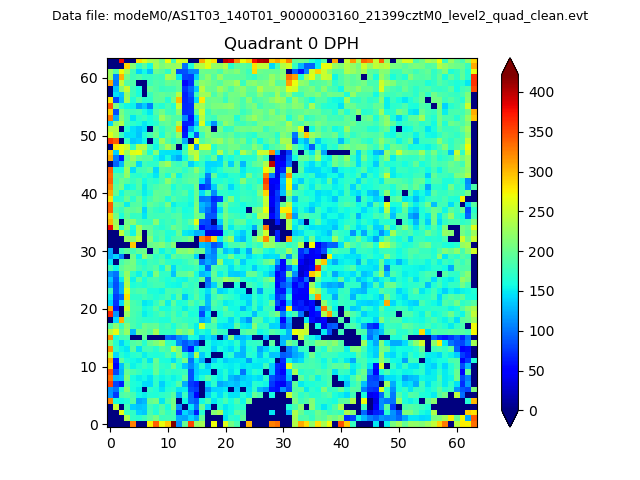 |
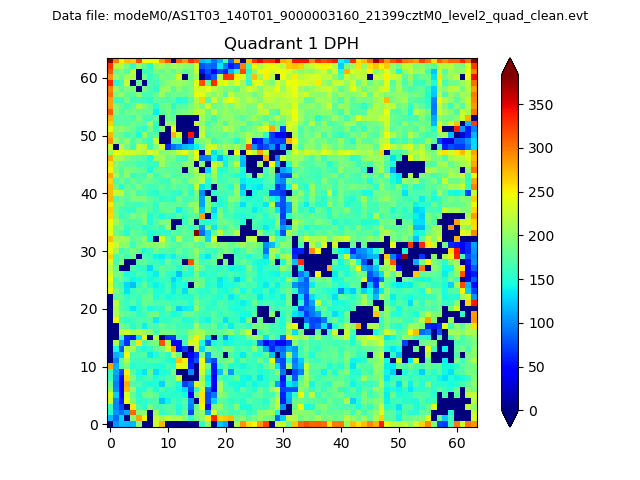 |
Quadrant B |
|---|---|---|---|
| Quadrant D |  |
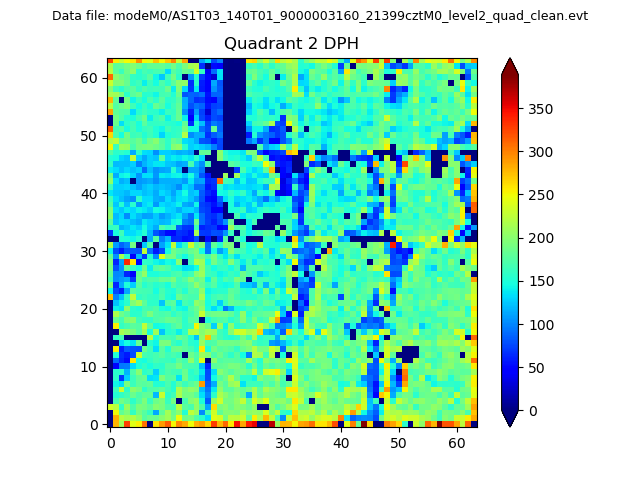 |
Quadrant C |
| Plot type | Count rate plots | Images |
|---|---|---|
| Comparison with Poisson distribution Blue bars denote a histogram of data divided into 1 sec bins. Red curve is a Poisson curve with rate = median count rate of data. |
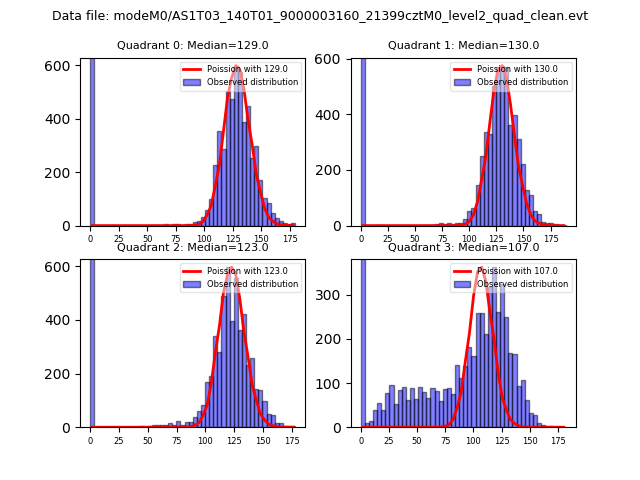 |
 |
| Quadrant-wise count rates Data is divided into 100 sec bins |
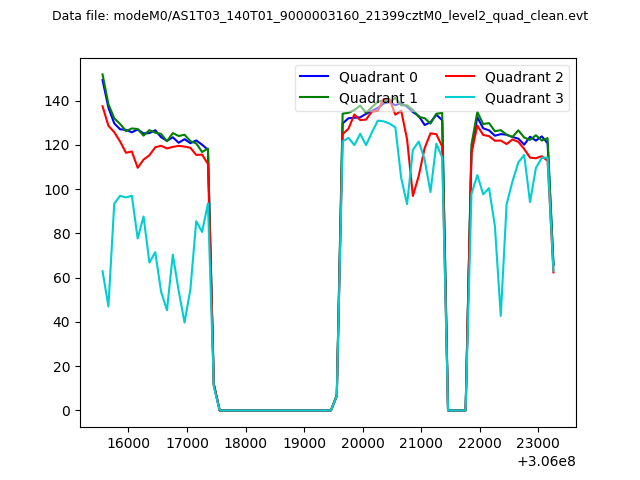 |
|
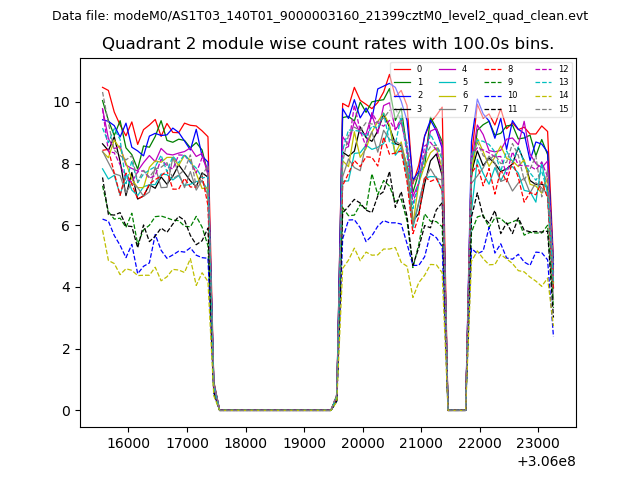
| Module-wise count rates for Quadrant A Data is divided into 100 sec bins |
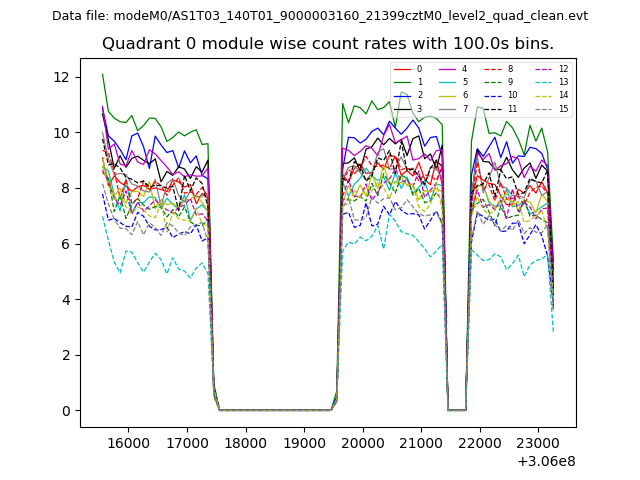 |
 |
| Module-wise count rates for Quadrant B Data is divided into 100 sec bins |
 |
 |
| Module-wise count rates for Quadrant C Data is divided into 100 sec bins |
 |
 |
| Module-wise count rates for Quadrant D Data is divided into 100 sec bins |
 |
 |
| Parameter | Plot |
|---|---|
| CZT HV Monitor |  |
| D_VDD | 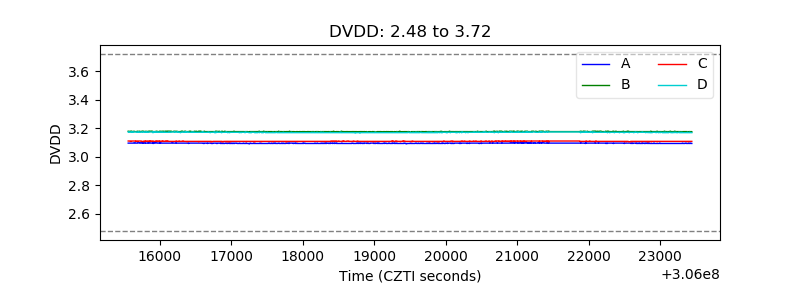 |
| Temperature 1 | 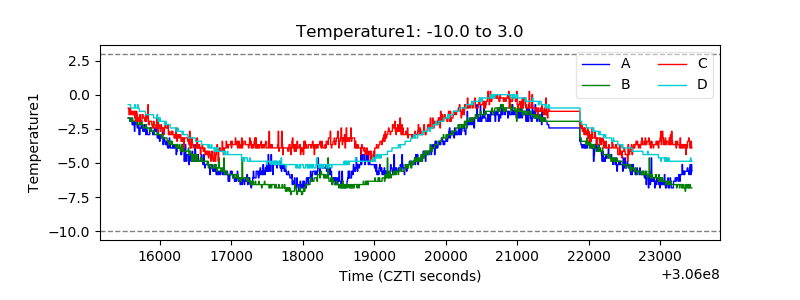 |
| Veto HV Monitor | 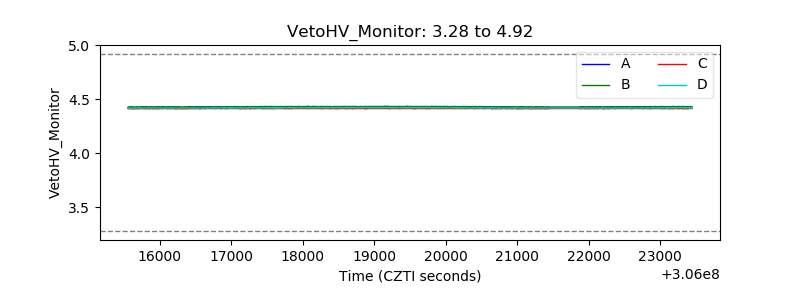 |
| Veto LLD | 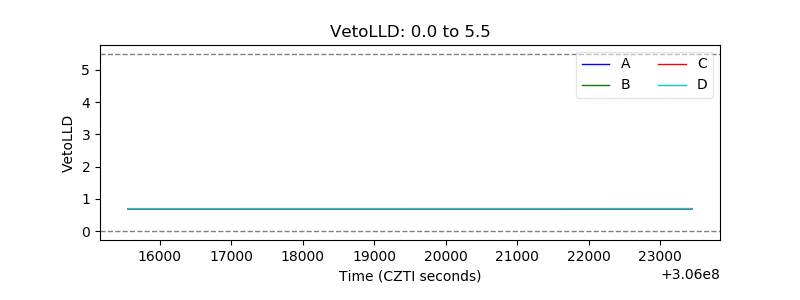 |
| Alpha Counter | 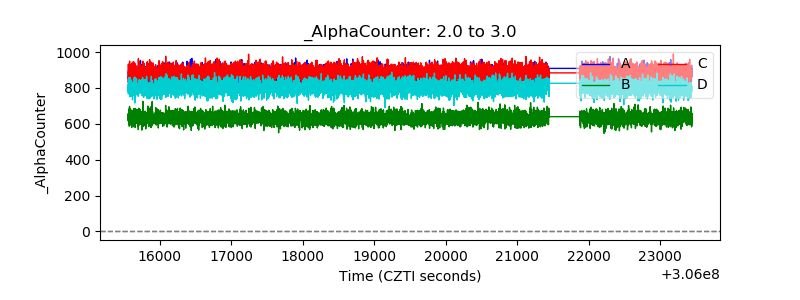 |
| _CPM_Rate | 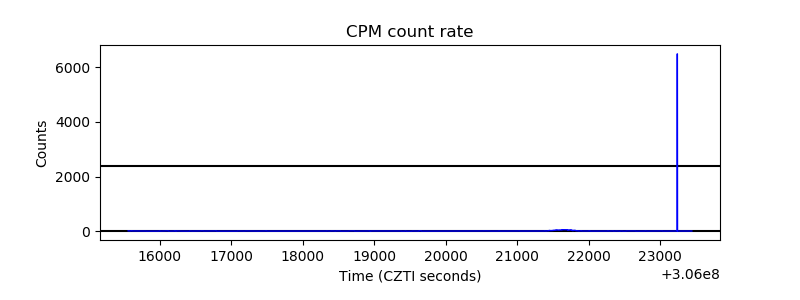 |
| CZT Counter | 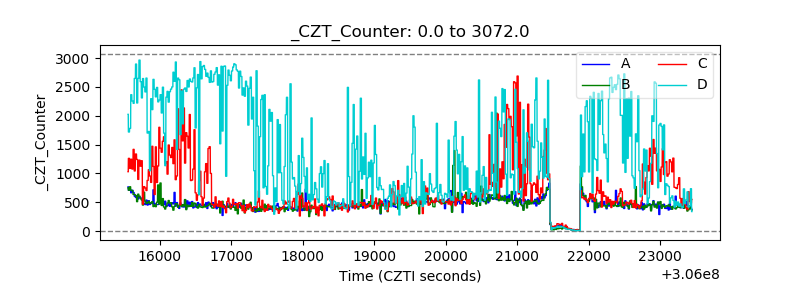 |
| +2.5 Volts monitor |  |
| +5 Volts monitor |  |
| _ROLL_ROT | 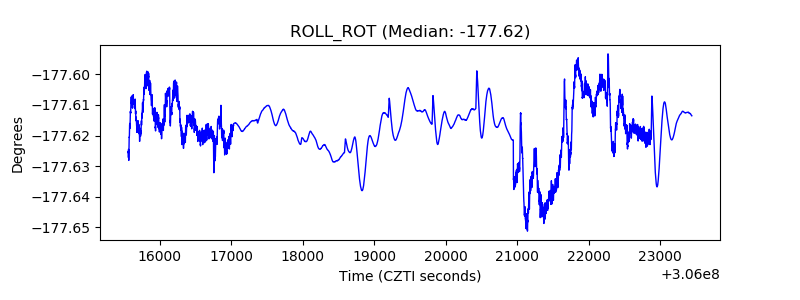 |
| _Roll_DEC | 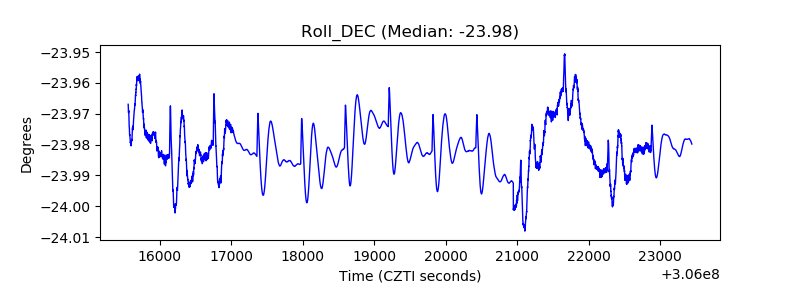 |
| _Roll_RA | 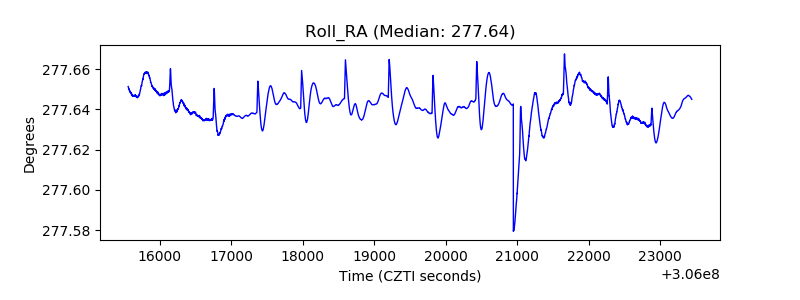 |
| Veto Counter | 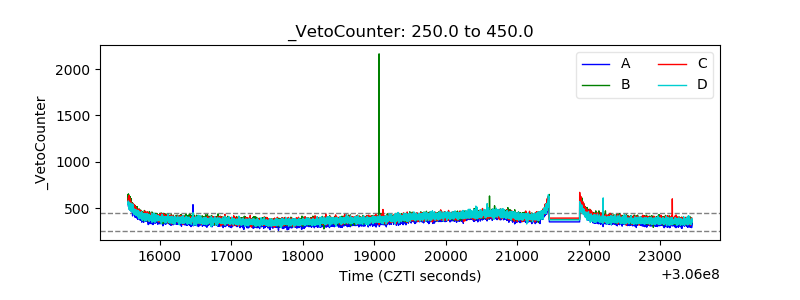 |