| Param | Original file | Final file |
|---|---|---|
| Filename | modeM0/AS1T03_140T01_9000003160_21401cztM0_level2.evt | modeM0/AS1T03_140T01_9000003160_21401cztM0_level2_quad_clean.evt |
| Size (bytes) | 962,766,720 | 137,436,480 |
| Size | 918.2 MB | 131.1 MB |
| Events in quadrant A | 5,183,176 | 877,758 |
| Events in quadrant B | 5,318,893 | 889,127 |
| Events in quadrant C | 7,380,282 | 853,674 |
| Events in quadrant D | 10,519,496 | 766,663 |
| Mode SS | |||
|---|---|---|---|
| Quadrant | BADHDUFLAG | Total packets | Discarded packets |
| A | 0 | 230 | 0 |
| B | 0 | 230 | 0 |
| C | 0 | 230 | 0 |
| D | 0 | 230 | 0 |
| Mode M0 | |||
|---|---|---|---|
| Quadrant | BADHDUFLAG | Total packets | Discarded packets |
| A | 0 | 22692 | 1 |
| B | 0 | 22988 | 1 |
| C | 0 | 29147 | 1 |
| D | 0 | 39059 | 1 |
| Mode M9 | |||
|---|---|---|---|
| Quadrant | BADHDUFLAG | Total packets | Discarded packets |
| A | 0 | 11 | 0 |
| B | 0 | 11 | 0 |
| C | 0 | 11 | 0 |
| D | 0 | 11 | 0 |
| Quadrant | Total seconds | Saturated seconds | Saturation percentage |
|---|---|---|---|
| A | 11185 | 37 | 0.330800% |
| B | 11186 | 53 | 0.473807% |
| C | 11186 | 212 | 1.895226% |
| D | 11186 | 1227 | 10.969068% |
Noise dominated data is calculated using 1-second bins in cleaned event files. If a bin has >2000 counts, and if more than 50% of those come from <1% of pixels, then it is considered to be noise-dominated and hence unusable.
| Quadrant | # 1 sec bins | Bins with >0 counts | Bins with >2000 counts | High rate bins dominated by noise | Noise dominated (total time) | Noise dominated (detector-on time) | Marked lightcurve |
|---|---|---|---|---|---|---|---|
| A | 11769 | 11185 | 0 | 0 | 0.00% | 0.00% |  |
| B | 11770 | 11186 | 8 | 8 | 0.07% | 0.07% |  |
| C | 11770 | 11185 | 36 | 36 | 0.31% | 0.32% |  |
| D | 11770 | 11186 | 1161 | 1161 | 9.86% | 10.38% | 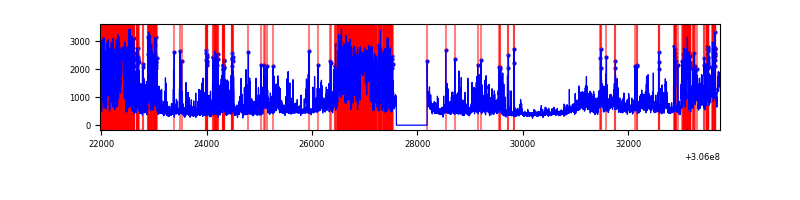 |
Top three noisy pixels from each quadrant. If the there are fewer than three noisy pixels in the level2.evt file, extra rows are filled as -1
| Pixel properties | Quadrant properties | ||||||
|---|---|---|---|---|---|---|---|
| Quadrant | DetID | PixID | Counts | Sigma | Mean | Median | Sigma |
| A | 5 | 168 | 66883 | 246.97 | 1323 | 1297 | 265.6 |
| A | 13 | 254 | 18847 | 66.09 | 1323 | 1297 | 265.6 |
| A | 0 | 226 | 11446 | 38.22 | 1323 | 1297 | 265.6 |
| B | 0 | 230 | 48644 | 186.94 | 1319 | 1286 | 253.3 |
| B | 12 | 111 | 30421 | 115.0 | 1319 | 1286 | 253.3 |
| B | 3 | 64 | 27548 | 103.66 | 1319 | 1286 | 253.3 |
| C | 3 | 233 | 2208199 | 7470.18 | 1259 | 1268 | 295.4 |
| C | 14 | 238 | 196174 | 659.73 | 1259 | 1268 | 295.4 |
| C | 7 | 220 | 53233 | 175.89 | 1259 | 1268 | 295.4 |
| D | 12 | 235 | 3235433 | 10867.48 | 1226 | 1192 | 297.6 |
| D | 1 | 20 | 884360 | 2967.56 | 1226 | 1192 | 297.6 |
| D | 1 | 52 | 827563 | 2776.72 | 1226 | 1192 | 297.6 |
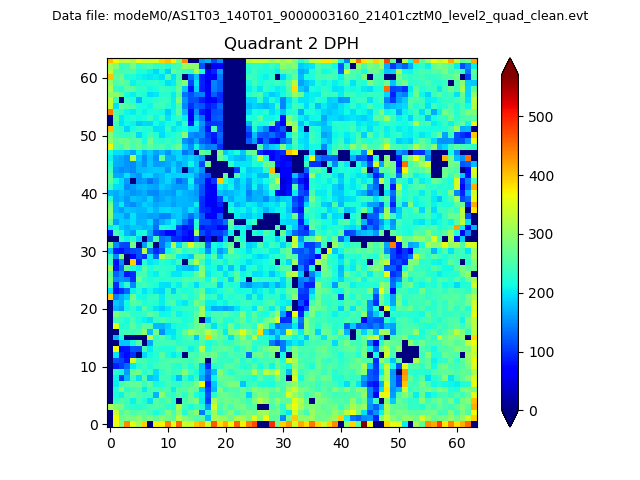
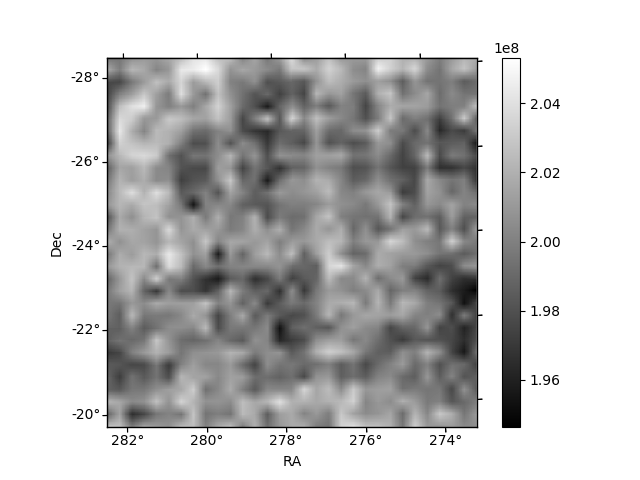
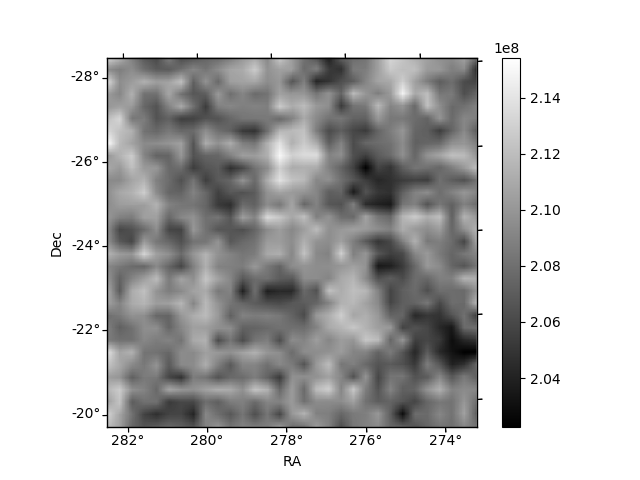
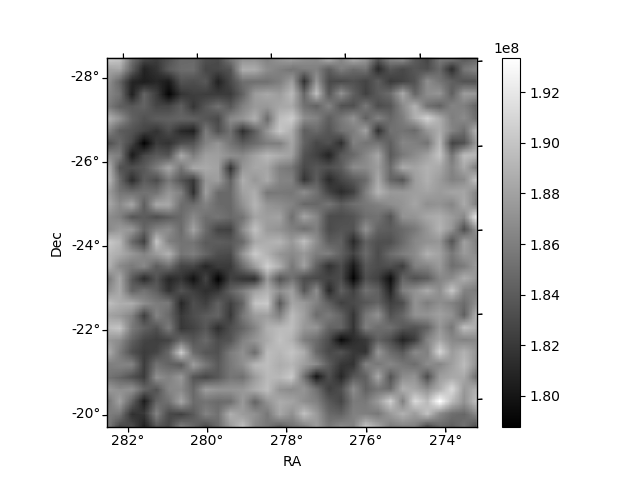
Histogram calculated using DETX and DETY for each event in the final _common_clean file
| Quadrant A | 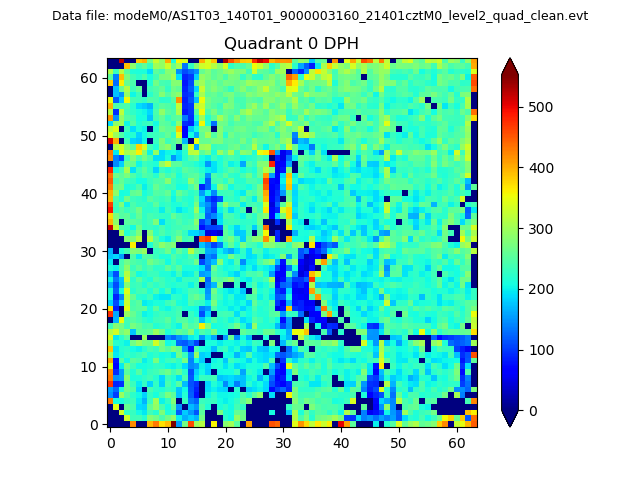 |
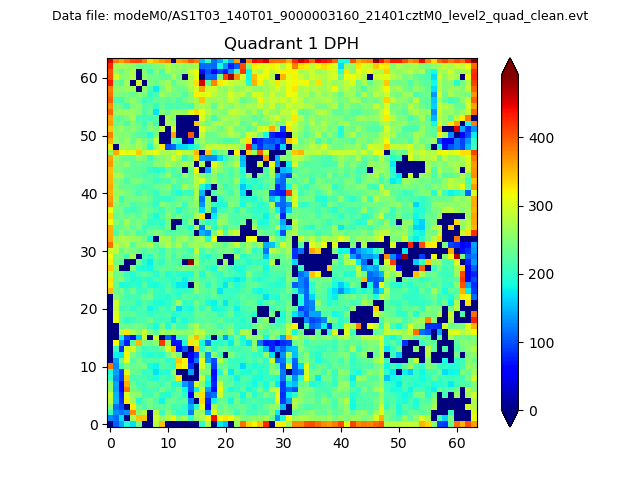 |
Quadrant B |
|---|---|---|---|
| Quadrant D | 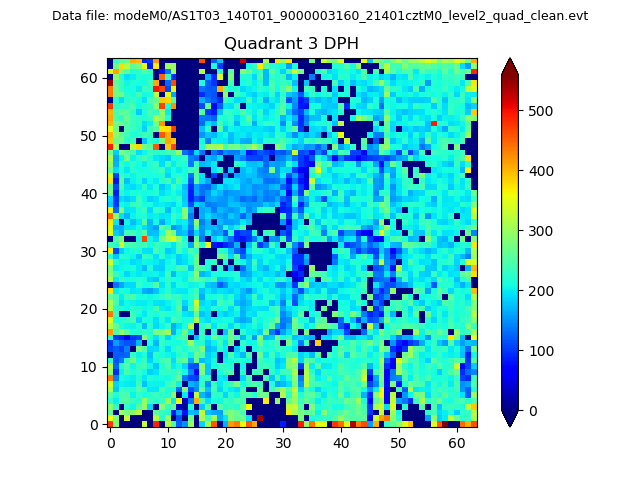 |
 |
Quadrant C |
| Plot type | Count rate plots | Images |
|---|---|---|
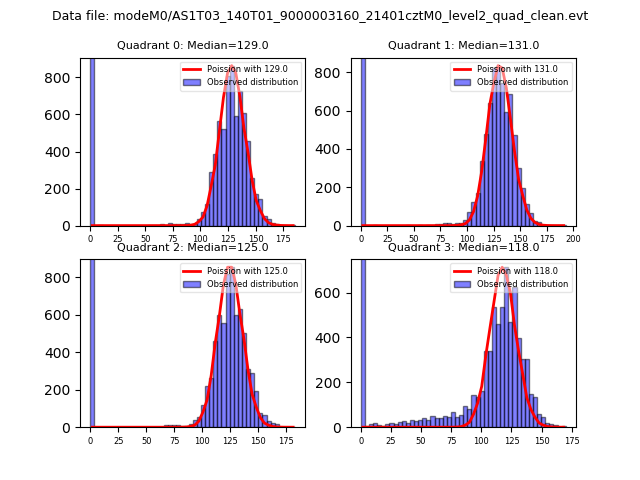
| Comparison with Poisson distribution Blue bars denote a histogram of data divided into 1 sec bins. Red curve is a Poisson curve with rate = median count rate of data. |
 |
 |
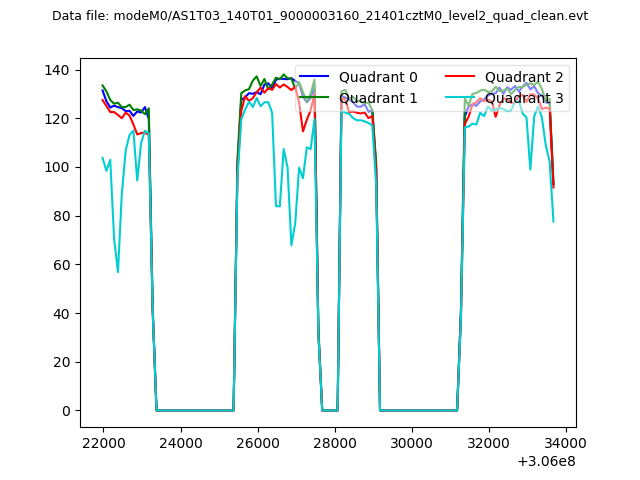
| Quadrant-wise count rates Data is divided into 100 sec bins |
 |
|
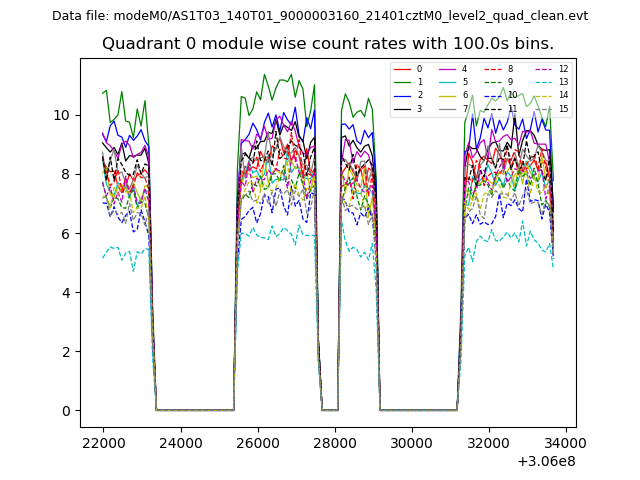
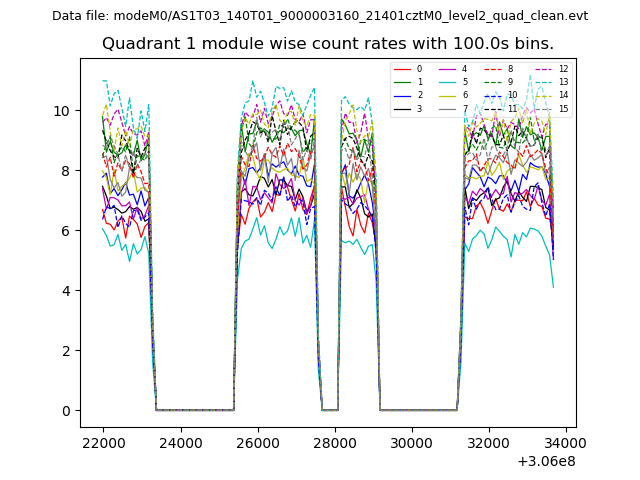
| Module-wise count rates for Quadrant A Data is divided into 100 sec bins |
 |
 |
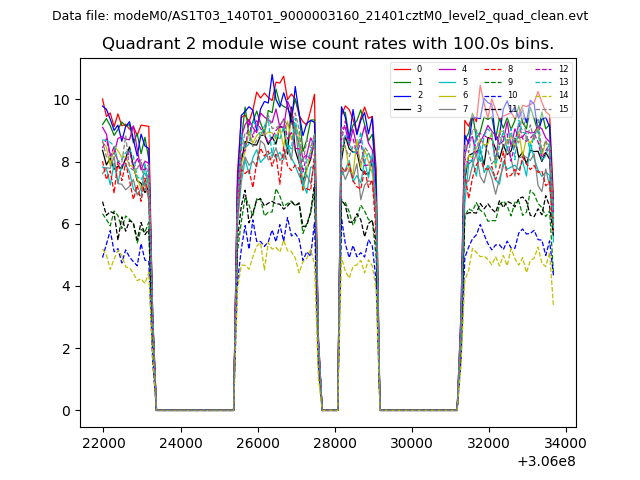
| Module-wise count rates for Quadrant B Data is divided into 100 sec bins |
 |
 |
| Module-wise count rates for Quadrant C Data is divided into 100 sec bins |
 |
 |
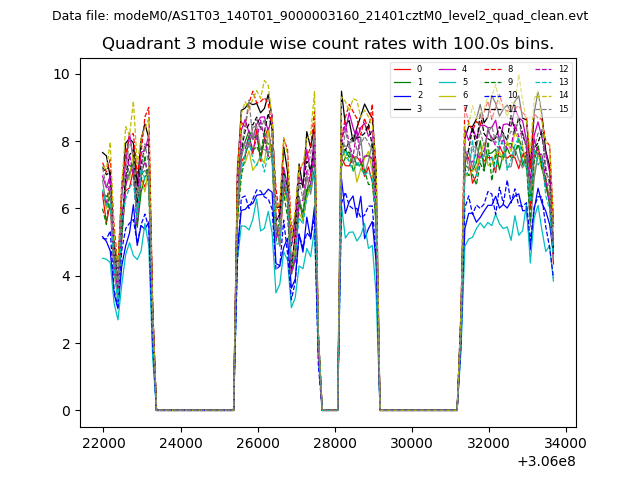
| Module-wise count rates for Quadrant D Data is divided into 100 sec bins |
 |
 |
| Parameter | Plot |
|---|---|
| CZT HV Monitor | 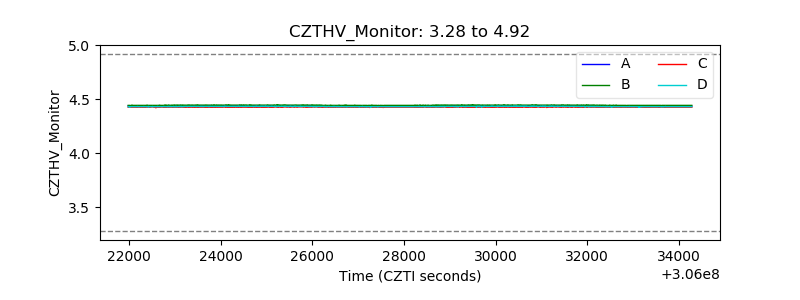 |
| D_VDD | 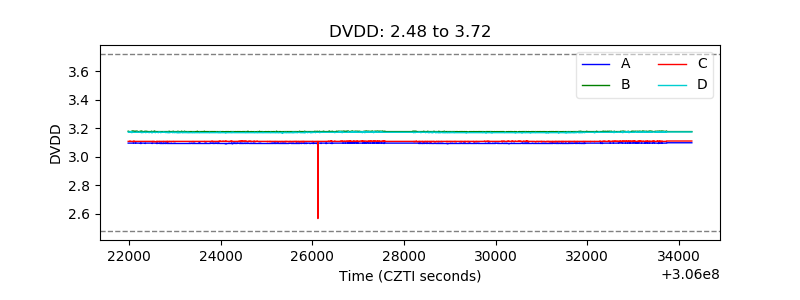 |
| Temperature 1 |  |
| Veto HV Monitor | 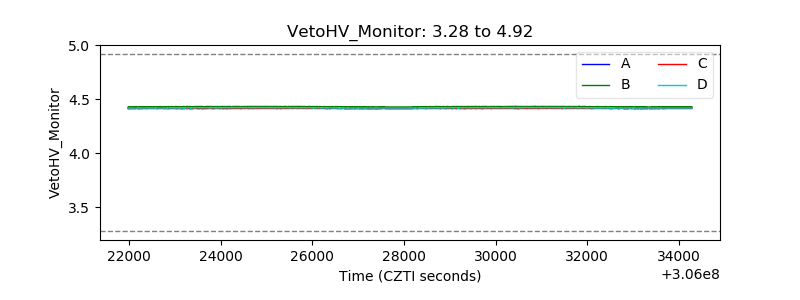 |
| Veto LLD | 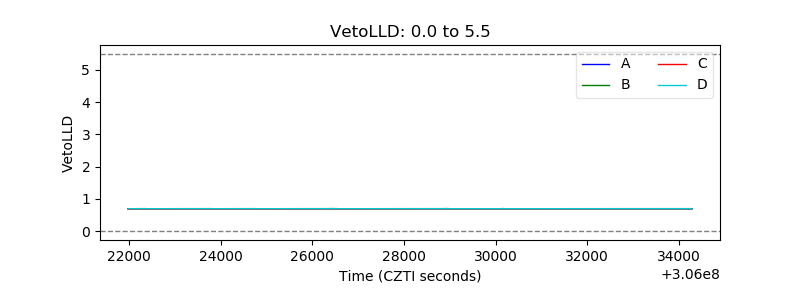 |
| Alpha Counter | 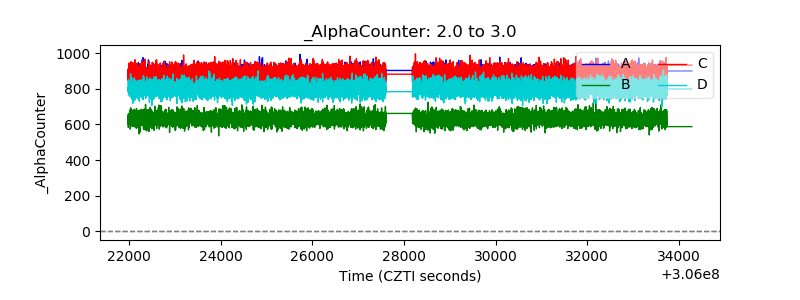 |
| _CPM_Rate | 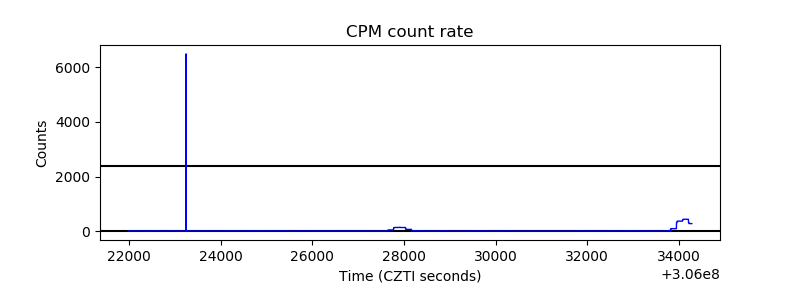 |
| CZT Counter | 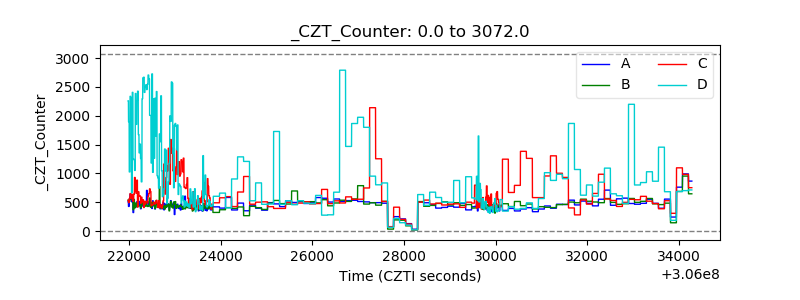 |
| +2.5 Volts monitor |  |
| +5 Volts monitor |  |
| _ROLL_ROT |  |
| _Roll_DEC | 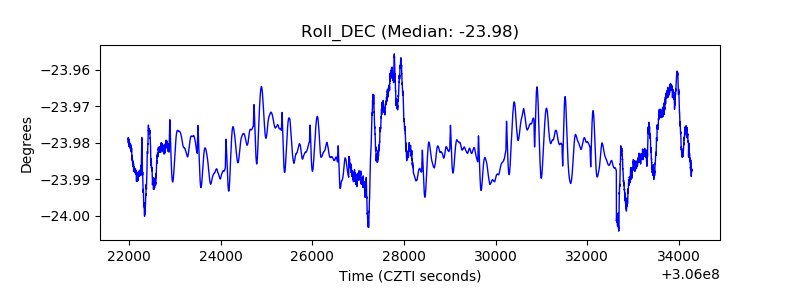 |
| _Roll_RA | 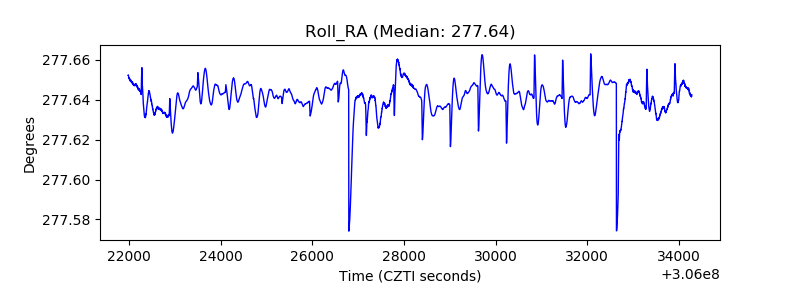 |
| Veto Counter | 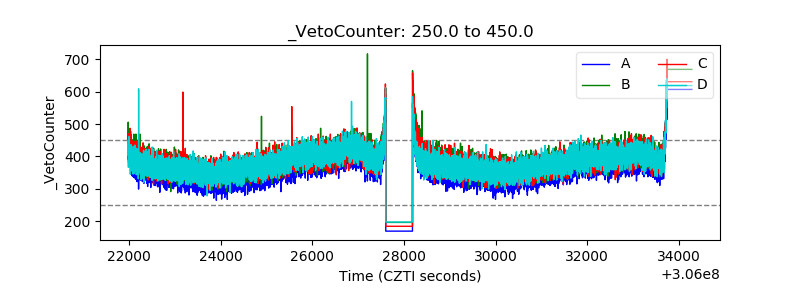 |