| Param | Original file | Final file |
|---|---|---|
| Filename | modeM0/AS1T03_140T01_9000003160_21402cztM0_level2.evt | modeM0/AS1T03_140T01_9000003160_21402cztM0_level2_quad_clean.evt |
| Size (bytes) | 550,857,600 | 90,167,040 |
| Size | 525.3 MB | 86.0 MB |
| Events in quadrant A | 3,682,669 | 556,074 |
| Events in quadrant B | 3,867,337 | 562,273 |
| Events in quadrant C | 3,863,843 | 544,816 |
| Events in quadrant D | 4,737,667 | 522,823 |
| Mode SS | |||
|---|---|---|---|
| Quadrant | BADHDUFLAG | Total packets | Discarded packets |
| A | 0 | 162 | 0 |
| B | 0 | 162 | 0 |
| C | 0 | 162 | 0 |
| D | 0 | 162 | 0 |
| Mode M0 | |||
|---|---|---|---|
| Quadrant | BADHDUFLAG | Total packets | Discarded packets |
| A | 0 | 15951 | 3 |
| B | 0 | 16258 | 2 |
| C | 0 | 16330 | 2 |
| D | 0 | 19215 | 2 |
| Mode M9 | |||
|---|---|---|---|
| Quadrant | BADHDUFLAG | Total packets | Discarded packets |
| A | 0 | 16 | 0 |
| B | 0 | 16 | 0 |
| C | 0 | 16 | 0 |
| D | 0 | 16 | 0 |
| Quadrant | Total seconds | Saturated seconds | Saturation percentage |
|---|---|---|---|
| A | 7825 | 44 | 0.562300% |
| B | 7826 | 61 | 0.779453% |
| C | 7826 | 82 | 1.047789% |
| D | 7826 | 196 | 2.504472% |
Noise dominated data is calculated using 1-second bins in cleaned event files. If a bin has >2000 counts, and if more than 50% of those come from <1% of pixels, then it is considered to be noise-dominated and hence unusable.
| Quadrant | # 1 sec bins | Bins with >0 counts | Bins with >2000 counts | High rate bins dominated by noise | Noise dominated (total time) | Noise dominated (detector-on time) | Marked lightcurve |
|---|---|---|---|---|---|---|---|
| A | 9450 | 7825 | 0 | 0 | 0.00% | 0.00% | 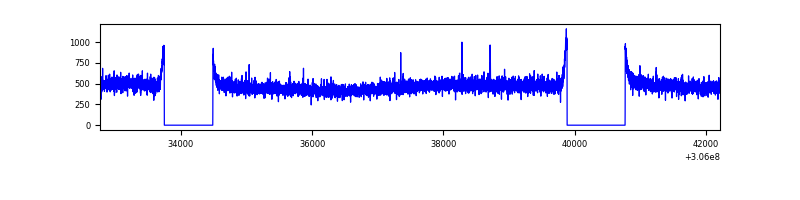 |
| B | 9451 | 7826 | 1 | 1 | 0.01% | 0.01% | 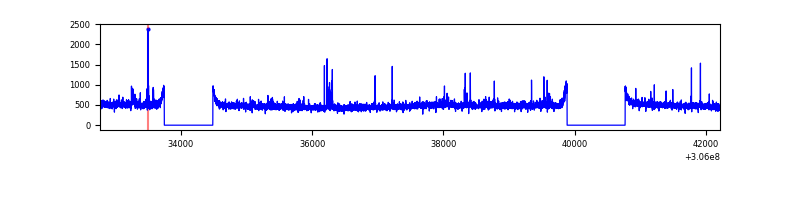 |
| C | 9451 | 7826 | 0 | 0 | 0.00% | 0.00% | 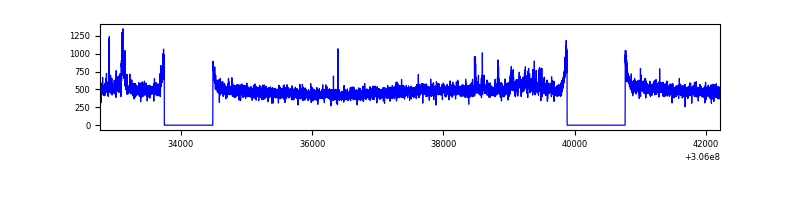 |
| D | 9451 | 7826 | 133 | 133 | 1.41% | 1.70% | 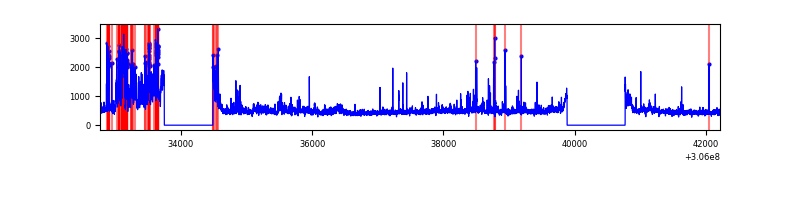 |
Top three noisy pixels from each quadrant. If the there are fewer than three noisy pixels in the level2.evt file, extra rows are filled as -1
| Pixel properties | Quadrant properties | ||||||
|---|---|---|---|---|---|---|---|
| Quadrant | DetID | PixID | Counts | Sigma | Mean | Median | Sigma |
| A | 13 | 254 | 13118 | 63.48 | 953 | 932 | 192.0 |
| A | 0 | 226 | 8446 | 39.14 | 953 | 932 | 192.0 |
| A | 3 | 137 | 8062 | 37.14 | 953 | 932 | 192.0 |
| B | 0 | 245 | 33569 | 177.33 | 954 | 931 | 184.0 |
| B | 0 | 230 | 28234 | 148.35 | 954 | 931 | 184.0 |
| B | 6 | 36 | 21906 | 113.96 | 954 | 931 | 184.0 |
| C | 3 | 233 | 159389 | 741.51 | 912 | 917 | 213.7 |
| C | 14 | 238 | 144006 | 669.53 | 912 | 917 | 213.7 |
| C | 13 | 61 | 6650 | 26.83 | 912 | 917 | 213.7 |
| D | 7 | 38 | 479419 | 2159.58 | 913 | 885 | 221.6 |
| D | 1 | 20 | 364960 | 1643.04 | 913 | 885 | 221.6 |
| D | 1 | 52 | 205751 | 924.54 | 913 | 885 | 221.6 |
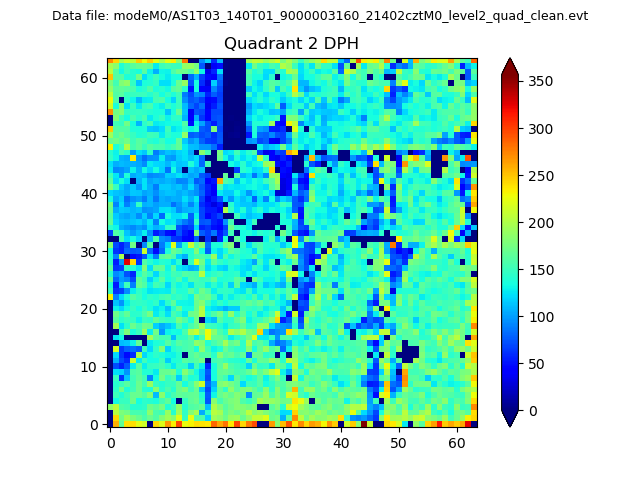
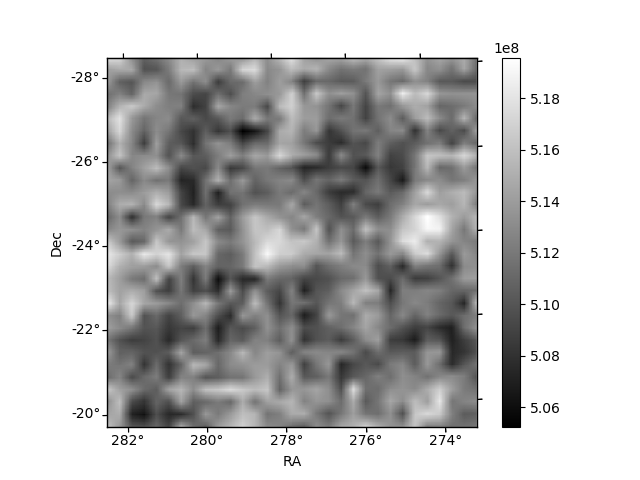
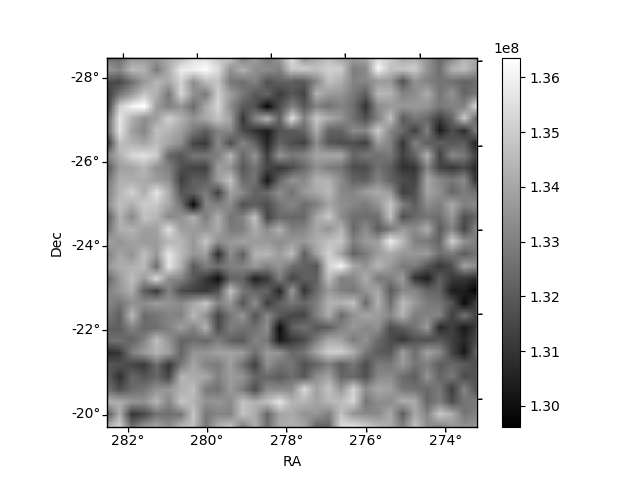
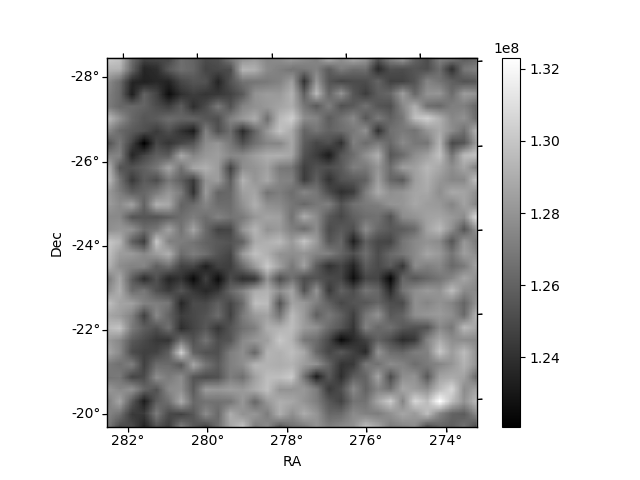
Histogram calculated using DETX and DETY for each event in the final _common_clean file
| Quadrant A | 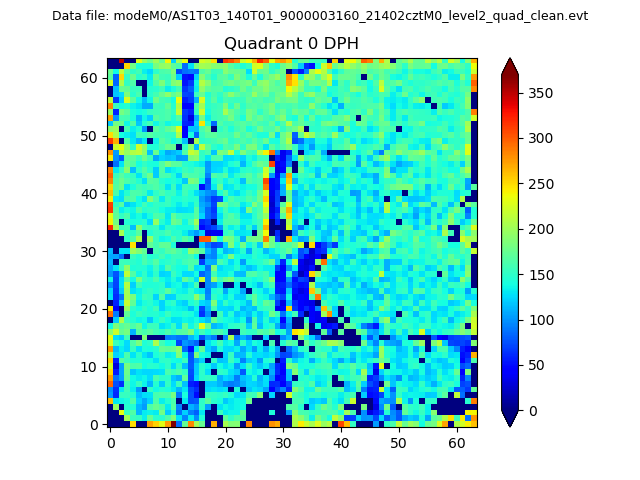 |
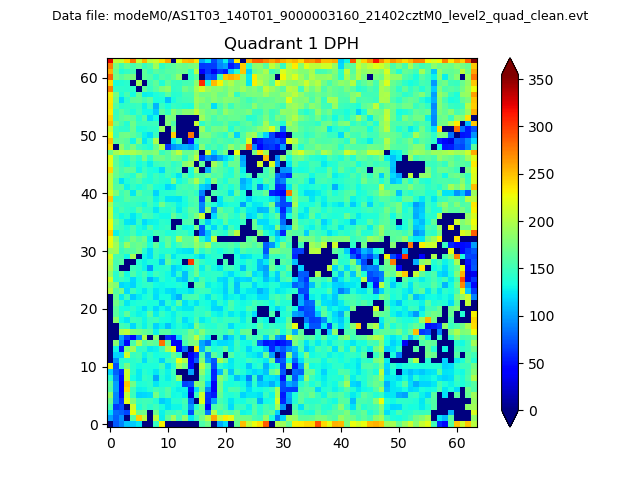 |
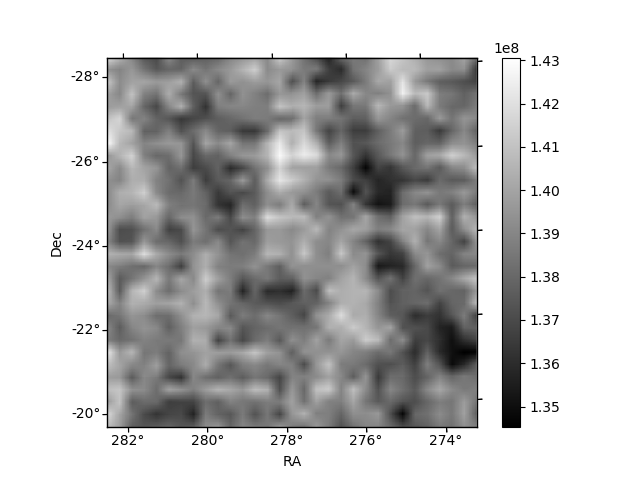
Quadrant B |
|---|---|---|---|
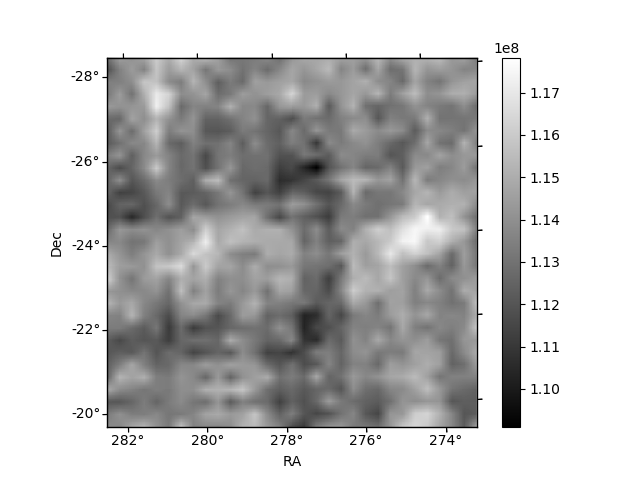
| Quadrant D | 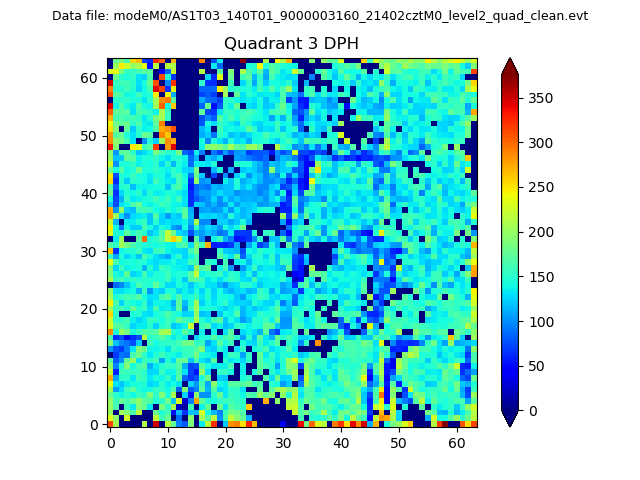 |
 |
Quadrant C |
| Plot type | Count rate plots | Images |
|---|---|---|
| Comparison with Poisson distribution Blue bars denote a histogram of data divided into 1 sec bins. Red curve is a Poisson curve with rate = median count rate of data. |
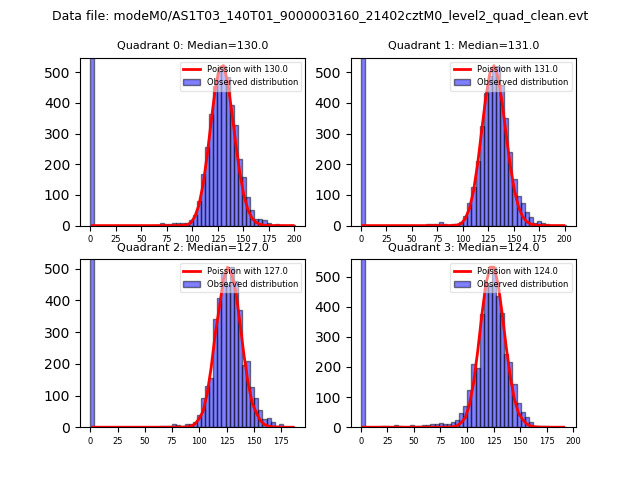 |
 |
| Quadrant-wise count rates Data is divided into 100 sec bins |
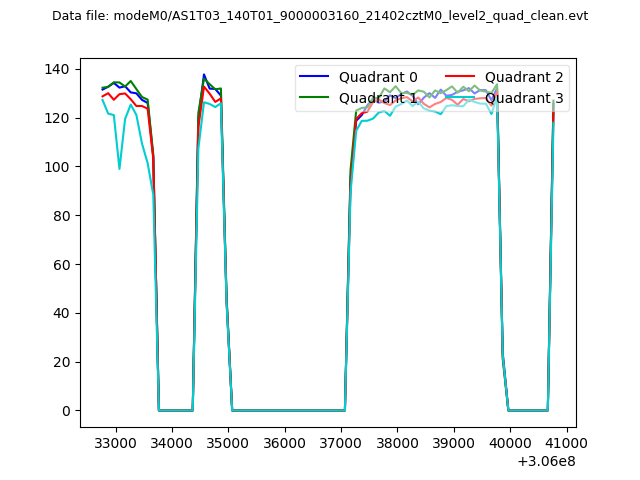 |
|
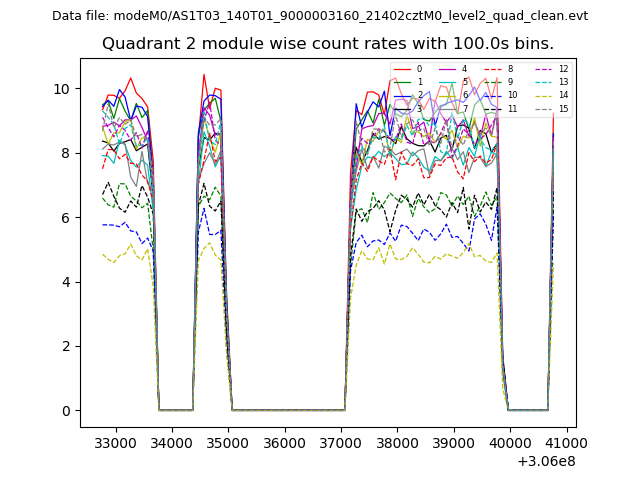
| Module-wise count rates for Quadrant A Data is divided into 100 sec bins |
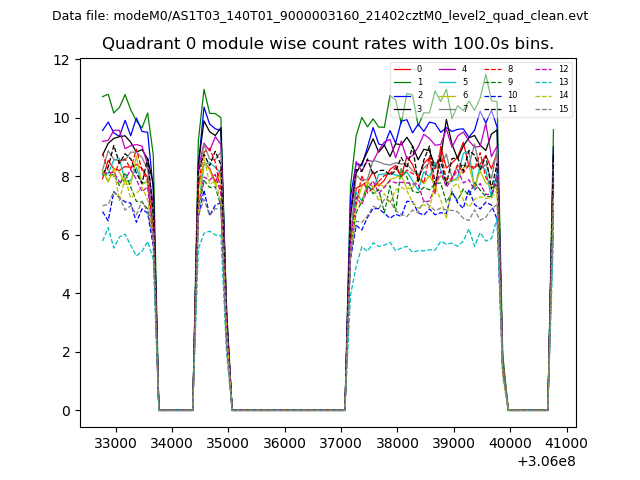 |
 |
| Module-wise count rates for Quadrant B Data is divided into 100 sec bins |
 |
 |
| Module-wise count rates for Quadrant C Data is divided into 100 sec bins |
 |
 |
| Module-wise count rates for Quadrant D Data is divided into 100 sec bins |
 |
 |
| Parameter | Plot |
|---|---|
| CZT HV Monitor | 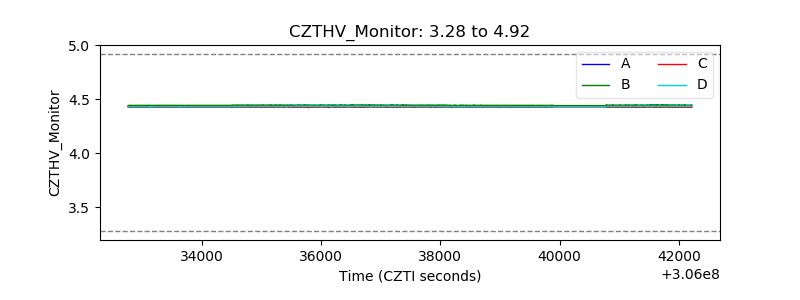 |
| D_VDD | 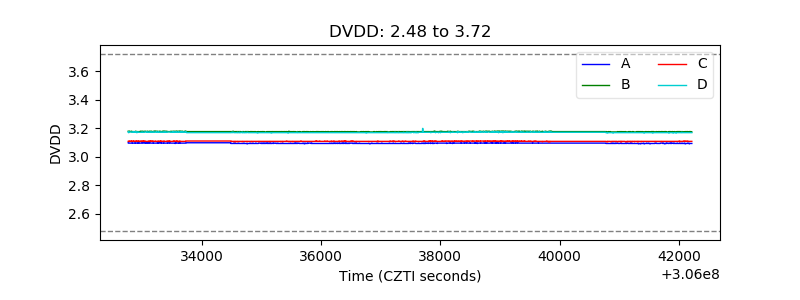 |
| Temperature 1 | 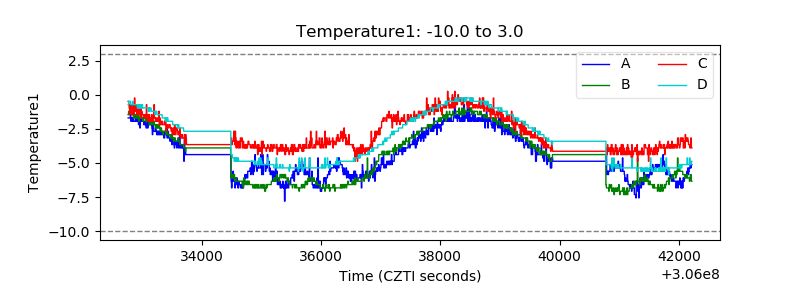 |
| Veto HV Monitor | 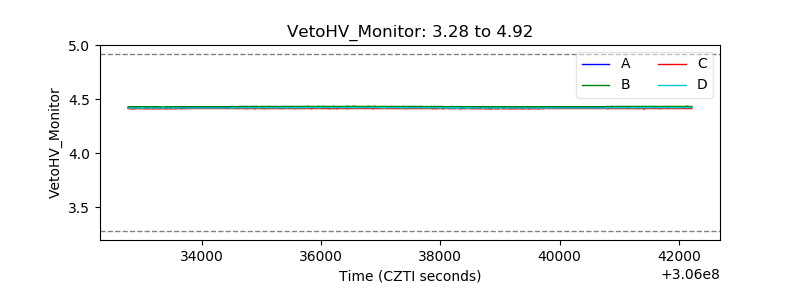 |
| Veto LLD | 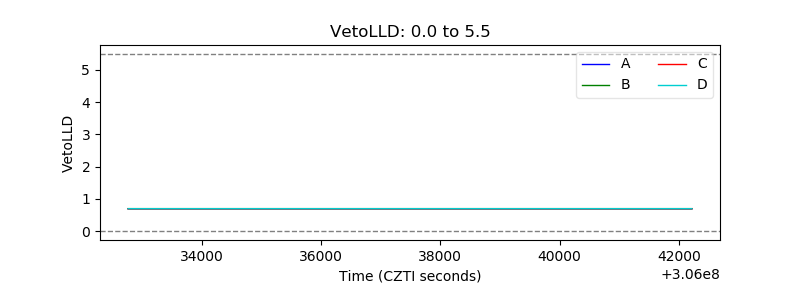 |
| Alpha Counter | 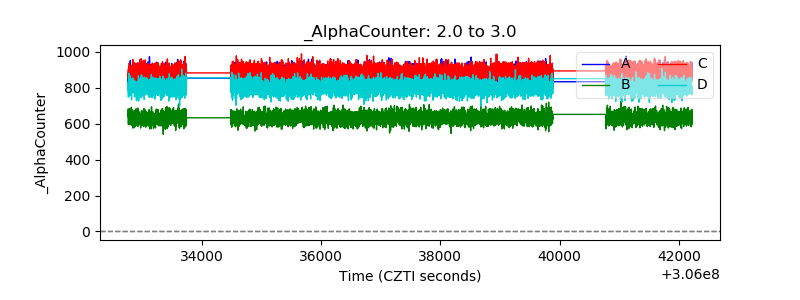 |
| _CPM_Rate | 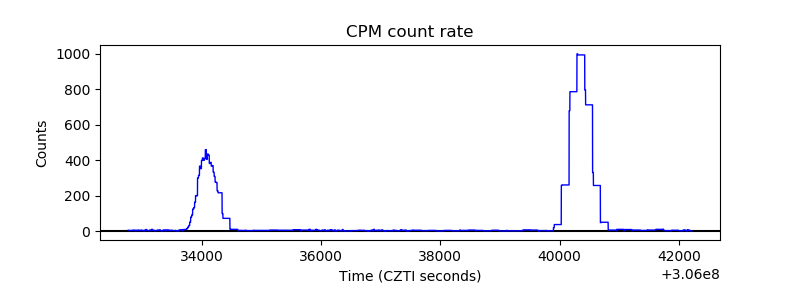 |
| CZT Counter | 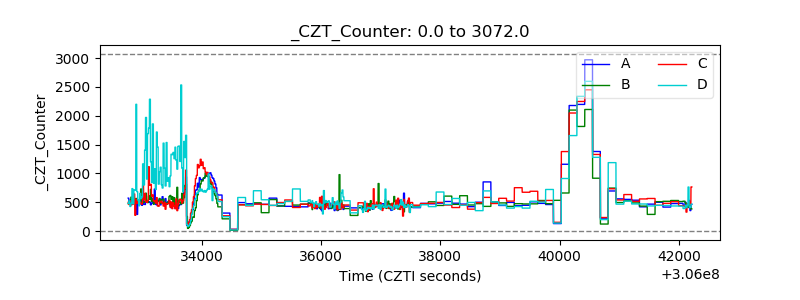 |
| +2.5 Volts monitor |  |
| +5 Volts monitor |  |
| _ROLL_ROT | 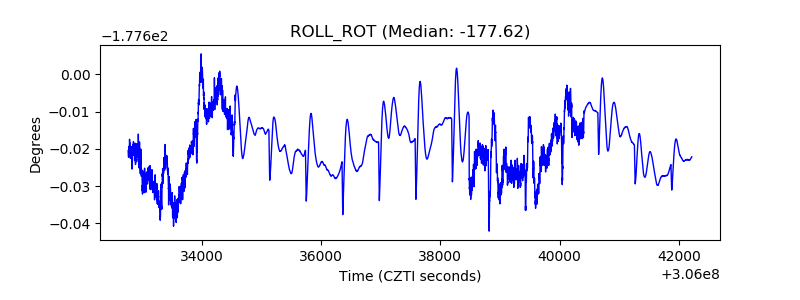 |
| _Roll_DEC |  |
| _Roll_RA | 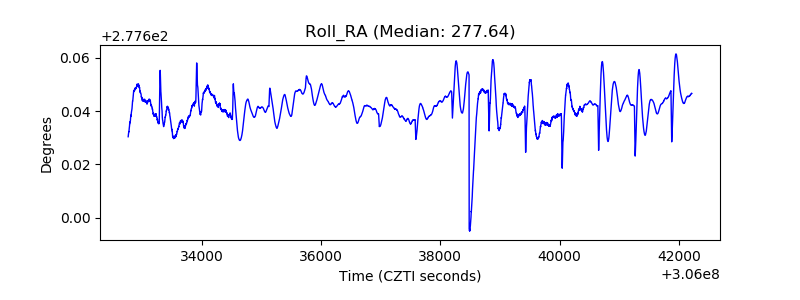 |
| Veto Counter | 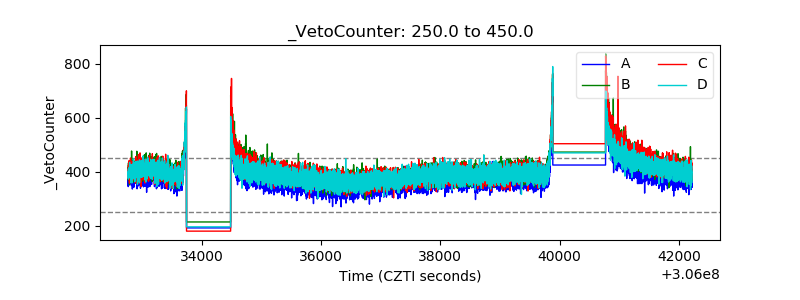 |