| Param | Original file | Final file |
|---|---|---|
| Filename | modeM0/AS1T03_140T01_9000003160_21403cztM0_level2.evt | modeM0/AS1T03_140T01_9000003160_21403cztM0_level2_quad_clean.evt |
| Size (bytes) | 557,127,360 | 65,664,000 |
| Size | 531.3 MB | 62.6 MB |
| Events in quadrant A | 3,208,102 | 399,243 |
| Events in quadrant B | 3,377,383 | 402,185 |
| Events in quadrant C | 3,411,637 | 390,677 |
| Events in quadrant D | 6,423,129 | 330,447 |
| Mode SS | |||
|---|---|---|---|
| Quadrant | BADHDUFLAG | Total packets | Discarded packets |
| A | 0 | 136 | 0 |
| B | 0 | 136 | 0 |
| C | 0 | 136 | 0 |
| D | 0 | 136 | 0 |
| Mode M0 | |||
|---|---|---|---|
| Quadrant | BADHDUFLAG | Total packets | Discarded packets |
| A | 0 | 13667 | 2 |
| B | 0 | 14061 | 2 |
| C | 0 | 14345 | 2 |
| D | 0 | 23598 | 2 |
| Mode M9 | |||
|---|---|---|---|
| Quadrant | BADHDUFLAG | Total packets | Discarded packets |
| A | 0 | 13 | 0 |
| B | 0 | 14 | 0 |
| C | 0 | 14 | 0 |
| D | 0 | 14 | 0 |
| Quadrant | Total seconds | Saturated seconds | Saturation percentage |
|---|---|---|---|
| A | 6668 | 31 | 0.464907% |
| B | 6668 | 69 | 1.034793% |
| C | 6668 | 90 | 1.349730% |
| D | 6668 | 982 | 14.727055% |
Noise dominated data is calculated using 1-second bins in cleaned event files. If a bin has >2000 counts, and if more than 50% of those come from <1% of pixels, then it is considered to be noise-dominated and hence unusable.
| Quadrant | # 1 sec bins | Bins with >0 counts | Bins with >2000 counts | High rate bins dominated by noise | Noise dominated (total time) | Noise dominated (detector-on time) | Marked lightcurve |
|---|---|---|---|---|---|---|---|
| A | 7703 | 6668 | 0 | 0 | 0.00% | 0.00% | 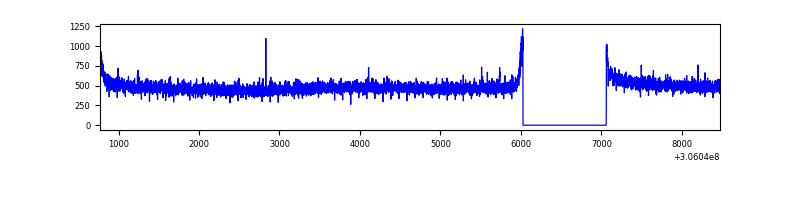 |
| B | 7703 | 6668 | 14 | 14 | 0.18% | 0.21% | 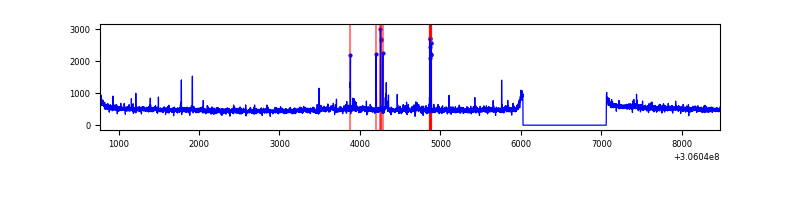 |
| C | 7703 | 6668 | 3 | 3 | 0.04% | 0.04% | 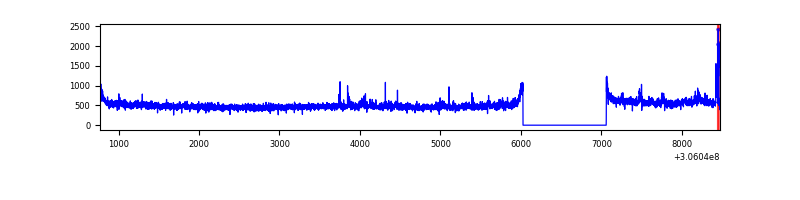 |
| D | 7703 | 6668 | 1028 | 1028 | 13.35% | 15.42% | 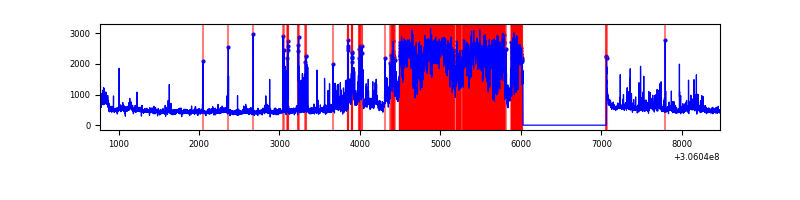 |
Top three noisy pixels from each quadrant. If the there are fewer than three noisy pixels in the level2.evt file, extra rows are filled as -1
| Pixel properties | Quadrant properties | ||||||
|---|---|---|---|---|---|---|---|
| Quadrant | DetID | PixID | Counts | Sigma | Mean | Median | Sigma |
| A | 13 | 254 | 10570 | 58.56 | 831 | 816 | 166.6 |
| A | 0 | 226 | 7254 | 38.65 | 831 | 816 | 166.6 |
| A | 3 | 137 | 6705 | 35.36 | 831 | 816 | 166.6 |
| B | 0 | 228 | 25952 | 158.79 | 830 | 810 | 158.3 |
| B | 0 | 230 | 21480 | 130.55 | 830 | 810 | 158.3 |
| B | 3 | 64 | 20622 | 125.13 | 830 | 810 | 158.3 |
| C | 3 | 233 | 180876 | 968.08 | 796 | 801 | 186.0 |
| C | 14 | 238 | 126785 | 677.29 | 796 | 801 | 186.0 |
| C | 13 | 61 | 5554 | 25.55 | 796 | 801 | 186.0 |
| D | 12 | 235 | 2897600 | 15531.27 | 767 | 744 | 186.5 |
| D | 1 | 52 | 249266 | 1332.43 | 767 | 744 | 186.5 |
| D | 13 | 153 | 184820 | 986.91 | 767 | 744 | 186.5 |
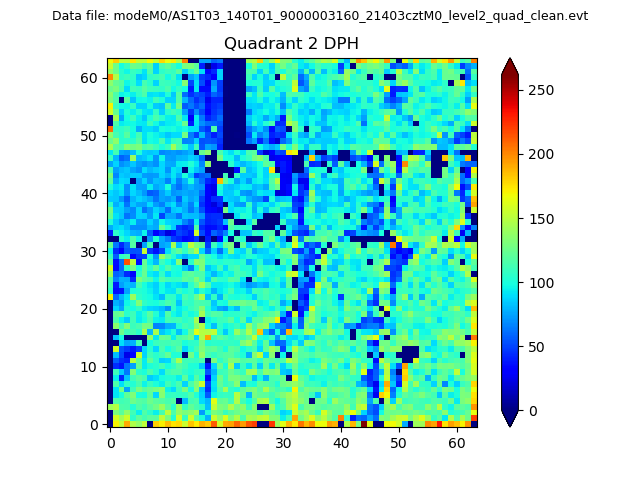
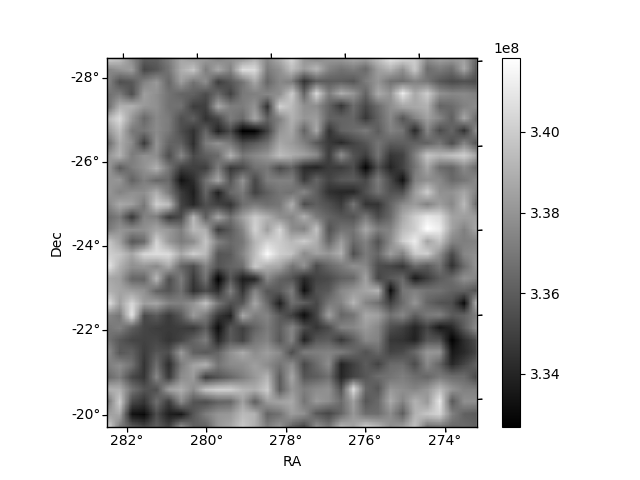
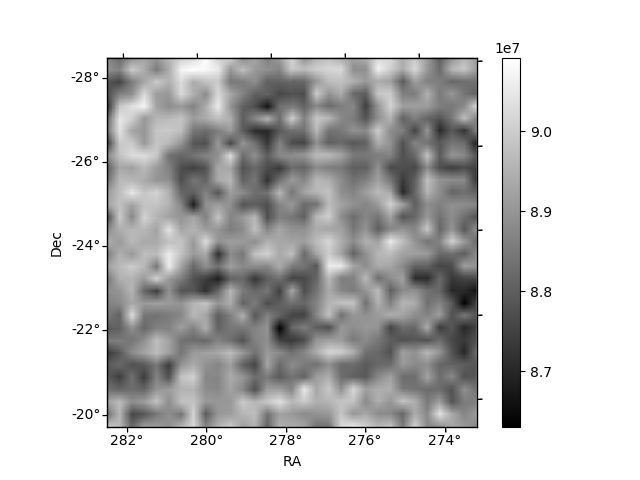
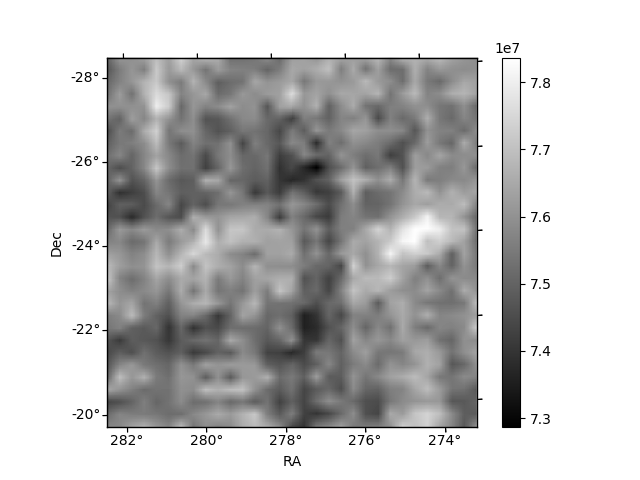
Histogram calculated using DETX and DETY for each event in the final _common_clean file
| Quadrant A | 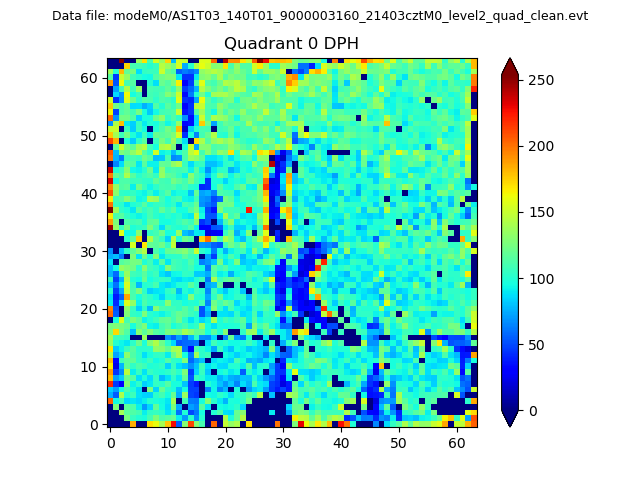 |
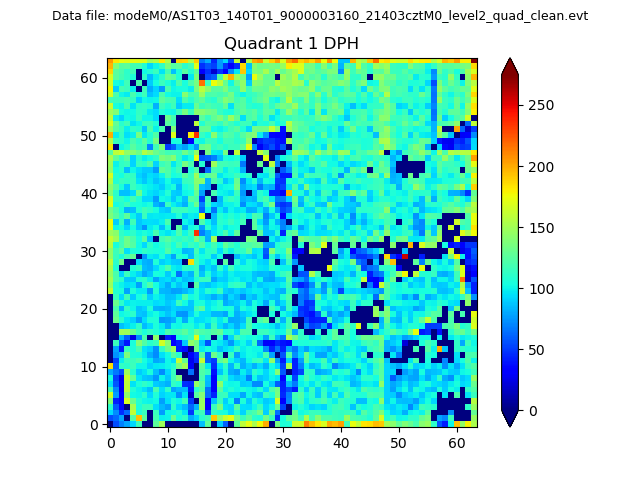 |
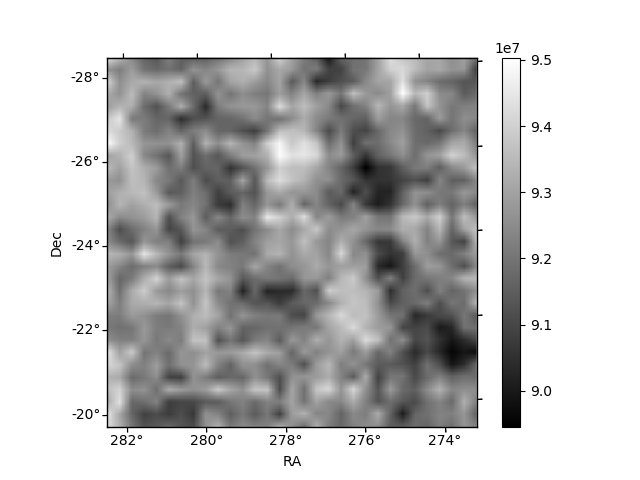
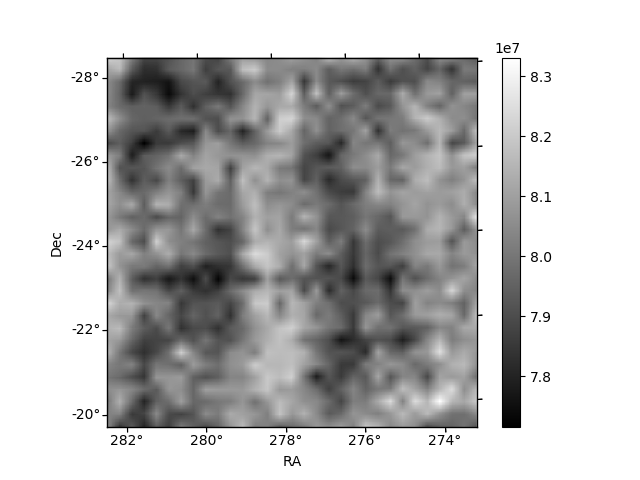
Quadrant B |
|---|---|---|---|
| Quadrant D | 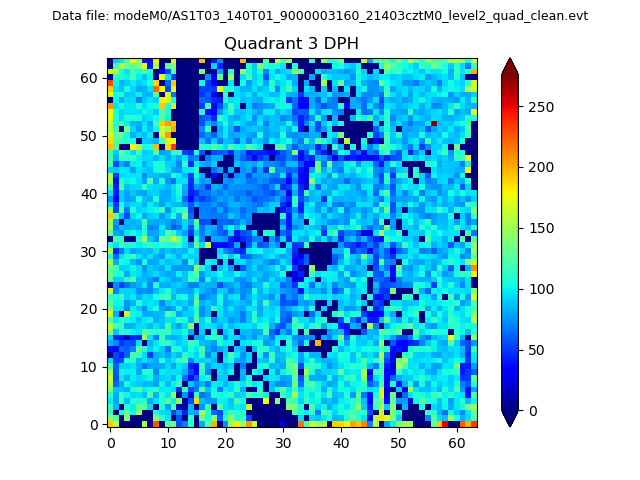 |
 |
Quadrant C |
| Plot type | Count rate plots | Images |
|---|---|---|
| Comparison with Poisson distribution Blue bars denote a histogram of data divided into 1 sec bins. Red curve is a Poisson curve with rate = median count rate of data. |
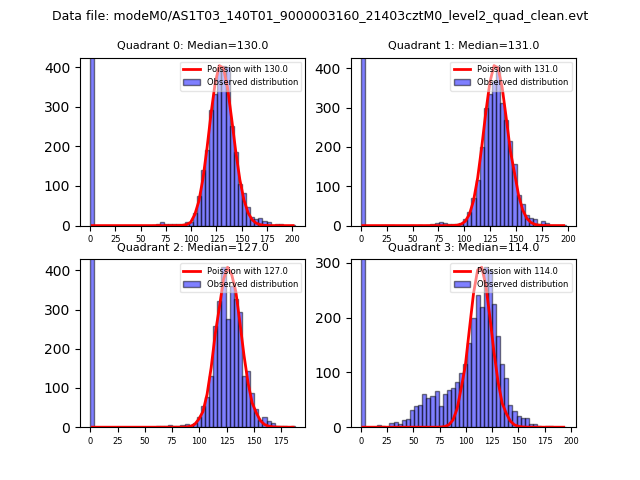 |
 |
| Quadrant-wise count rates Data is divided into 100 sec bins |
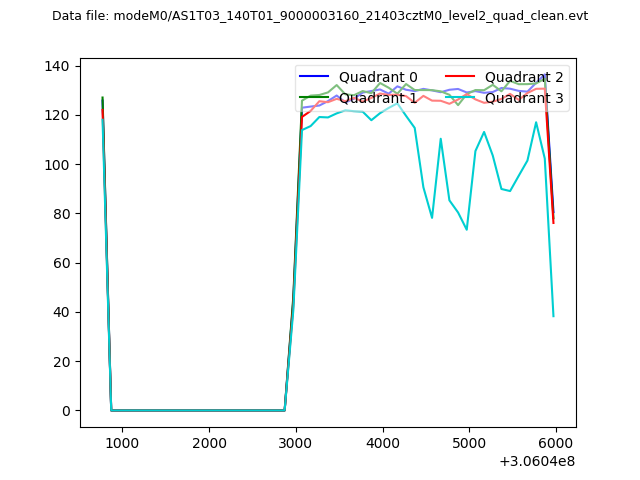 |
|
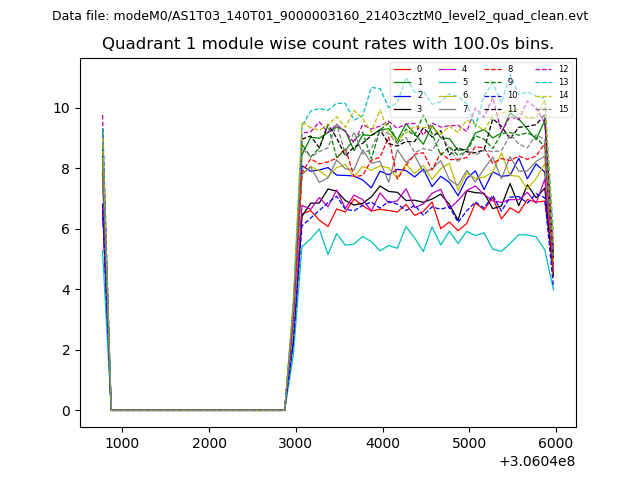
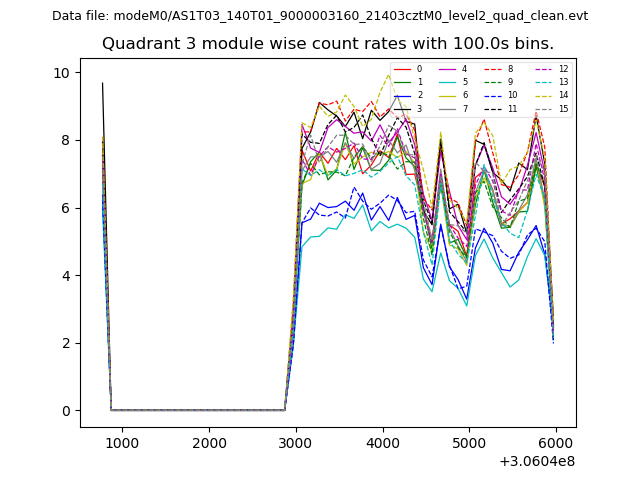
| Module-wise count rates for Quadrant A Data is divided into 100 sec bins |
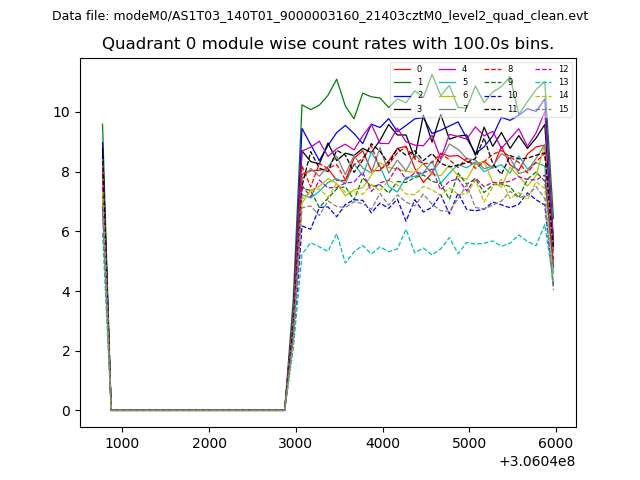 |
 |
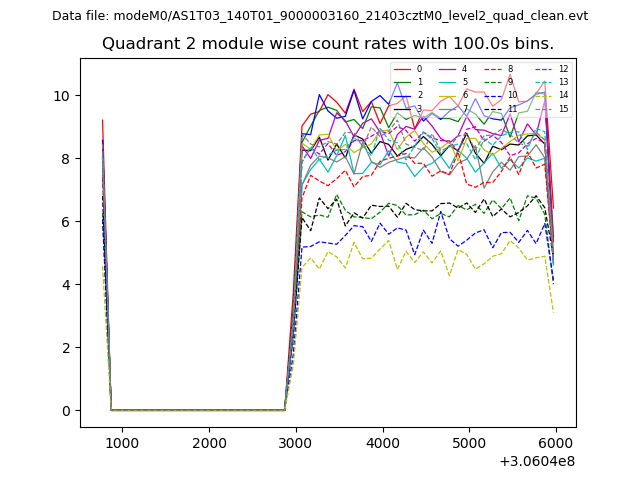
| Module-wise count rates for Quadrant B Data is divided into 100 sec bins |
 |
 |
| Module-wise count rates for Quadrant C Data is divided into 100 sec bins |
 |
 |
| Module-wise count rates for Quadrant D Data is divided into 100 sec bins |
 |
 |
| Parameter | Plot |
|---|---|
| CZT HV Monitor | 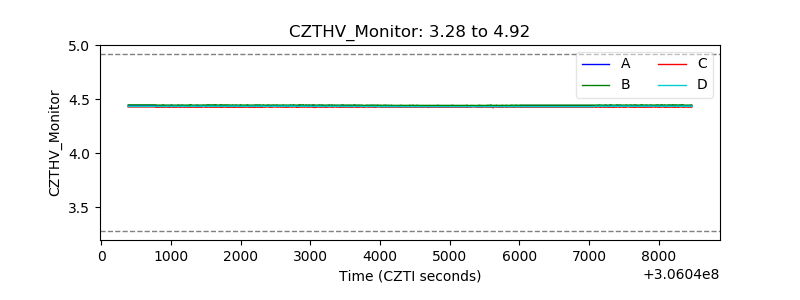 |
| D_VDD | 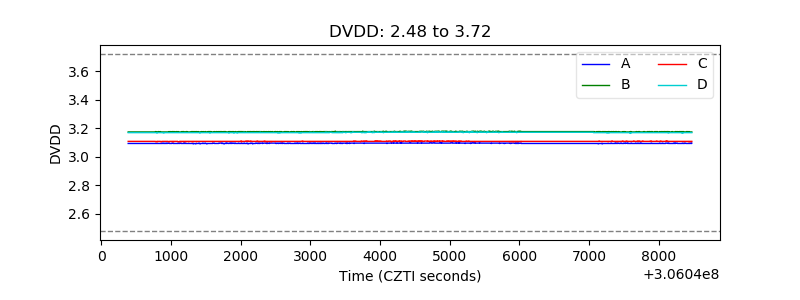 |
| Temperature 1 | 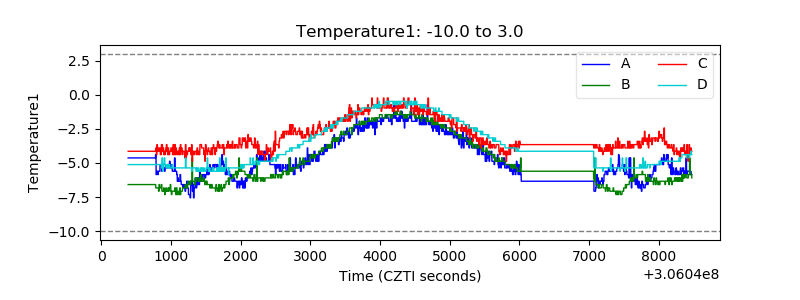 |
| Veto HV Monitor | 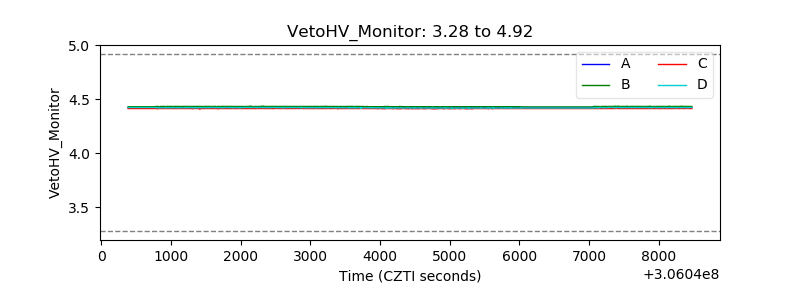 |
| Veto LLD | 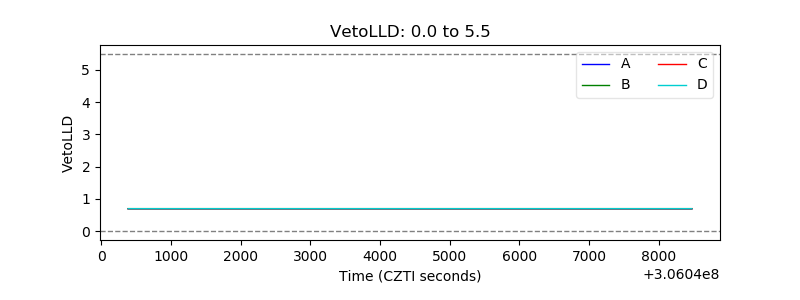 |
| Alpha Counter | 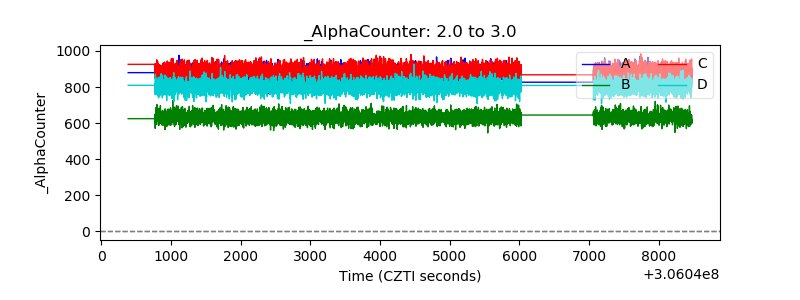 |
| _CPM_Rate | 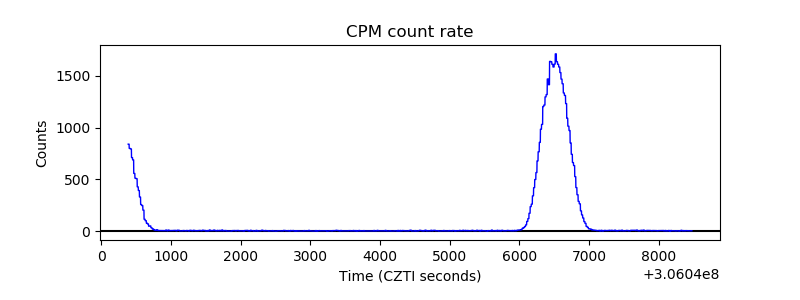 |
| CZT Counter | 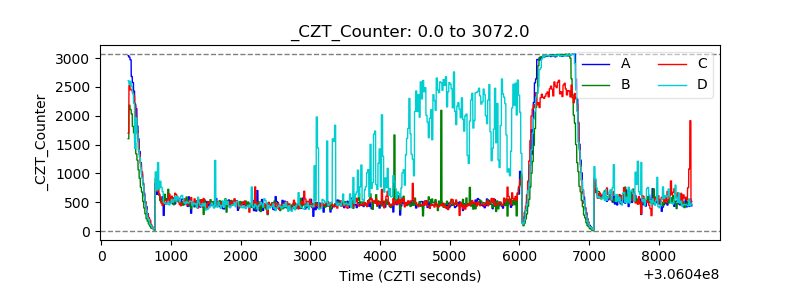 |
| +2.5 Volts monitor |  |
| +5 Volts monitor |  |
| _ROLL_ROT | 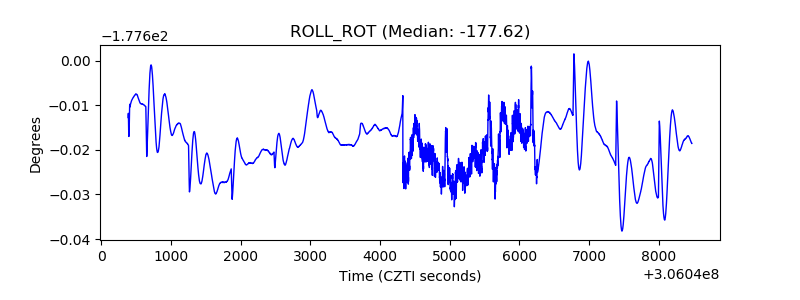 |
| _Roll_DEC | 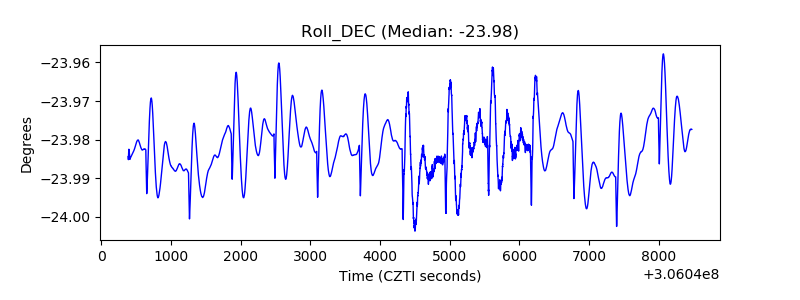 |
| _Roll_RA | 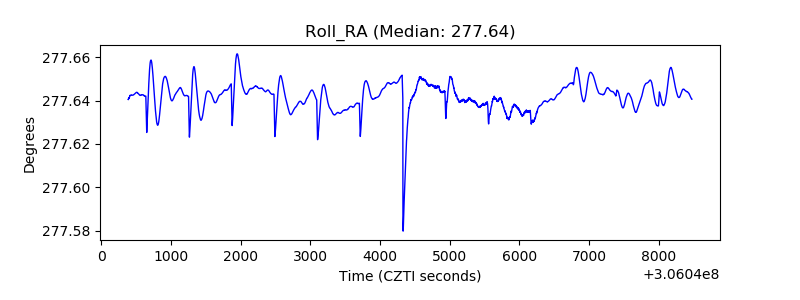 |
| Veto Counter | 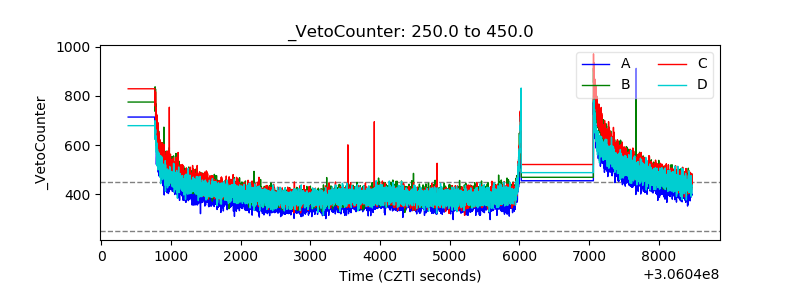 |