| Param | Original file | Final file |
|---|---|---|
| Filename | modeM0/AS1T03_140T01_9000003160_21406cztM0_level2.evt | modeM0/AS1T03_140T01_9000003160_21406cztM0_level2_quad_clean.evt |
| Size (bytes) | 654,238,080 | 83,865,600 |
| Size | 623.9 MB | 80.0 MB |
| Events in quadrant A | 3,786,418 | 559,282 |
| Events in quadrant B | 3,531,174 | 569,195 |
| Events in quadrant C | 3,568,543 | 547,843 |
| Events in quadrant D | 8,498,989 | 420,413 |
| Mode SS | |||
|---|---|---|---|
| Quadrant | BADHDUFLAG | Total packets | Discarded packets |
| A | 0 | 130 | 0 |
| B | 0 | 130 | 0 |
| C | 0 | 130 | 0 |
| D | 0 | 130 | 0 |
| Mode M0 | |||
|---|---|---|---|
| Quadrant | BADHDUFLAG | Total packets | Discarded packets |
| A | 0 | 15495 | 4 |
| B | 0 | 14433 | 2 |
| C | 0 | 14578 | 2 |
| D | 0 | 29819 | 2 |
| Mode M9 | |||
|---|---|---|---|
| Quadrant | BADHDUFLAG | Total packets | Discarded packets |
| A | 0 | 13 | 0 |
| B | 0 | 14 | 0 |
| C | 0 | 14 | 0 |
| D | 0 | 14 | 0 |
| Quadrant | Total seconds | Saturated seconds | Saturation percentage |
|---|---|---|---|
| A | 6329 | 77 | 1.216622% |
| B | 6329 | 121 | 1.911834% |
| C | 6329 | 154 | 2.433244% |
| D | 6329 | 1730 | 27.334492% |
Noise dominated data is calculated using 1-second bins in cleaned event files. If a bin has >2000 counts, and if more than 50% of those come from <1% of pixels, then it is considered to be noise-dominated and hence unusable.
| Quadrant | # 1 sec bins | Bins with >0 counts | Bins with >2000 counts | High rate bins dominated by noise | Noise dominated (total time) | Noise dominated (detector-on time) | Marked lightcurve |
|---|---|---|---|---|---|---|---|
| A | 7559 | 6329 | 0 | 0 | 0.00% | 0.00% | 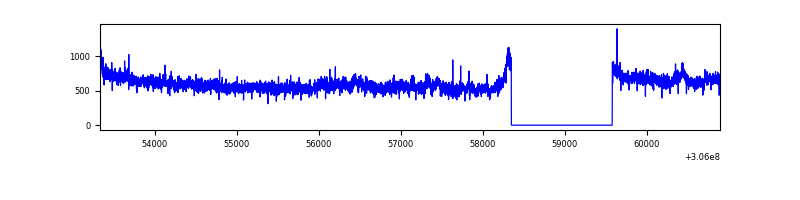 |
| B | 7559 | 6329 | 14 | 14 | 0.19% | 0.22% | 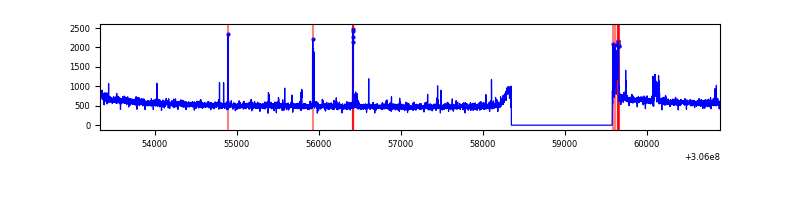 |
| C | 7559 | 6329 | 0 | 0 | 0.00% | 0.00% | 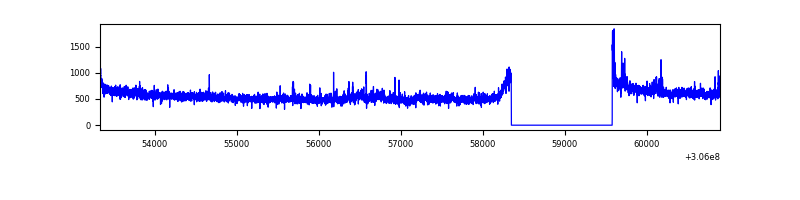 |
| D | 7559 | 6329 | 1710 | 1710 | 22.62% | 27.02% | 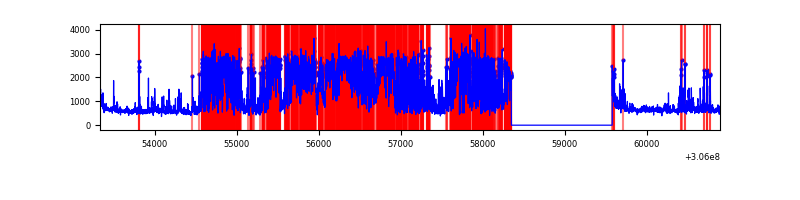 |
Top three noisy pixels from each quadrant. If the there are fewer than three noisy pixels in the level2.evt file, extra rows are filled as -1
| Pixel properties | Quadrant properties | ||||||
|---|---|---|---|---|---|---|---|
| Quadrant | DetID | PixID | Counts | Sigma | Mean | Median | Sigma |
| A | 5 | 168 | 411169 | 2360.39 | 873 | 858 | 173.8 |
| A | 11 | 47 | 13010 | 69.91 | 873 | 858 | 173.8 |
| A | 13 | 254 | 10077 | 53.03 | 873 | 858 | 173.8 |
| B | 6 | 36 | 90730 | 563.47 | 862 | 845 | 159.5 |
| B | 0 | 190 | 29543 | 179.9 | 862 | 845 | 159.5 |
| B | 12 | 111 | 18476 | 110.52 | 862 | 845 | 159.5 |
| C | 3 | 233 | 188140 | 982.37 | 830 | 837 | 190.7 |
| C | 14 | 238 | 134342 | 700.21 | 830 | 837 | 190.7 |
| C | 0 | 236 | 9936 | 47.72 | 830 | 837 | 190.7 |
| D | 1 | 52 | 2098031 | 11599.35 | 757 | 737 | 180.8 |
| D | 12 | 235 | 1871119 | 10344.39 | 757 | 737 | 180.8 |
| D | 14 | 34 | 1442689 | 7974.9 | 757 | 737 | 180.8 |
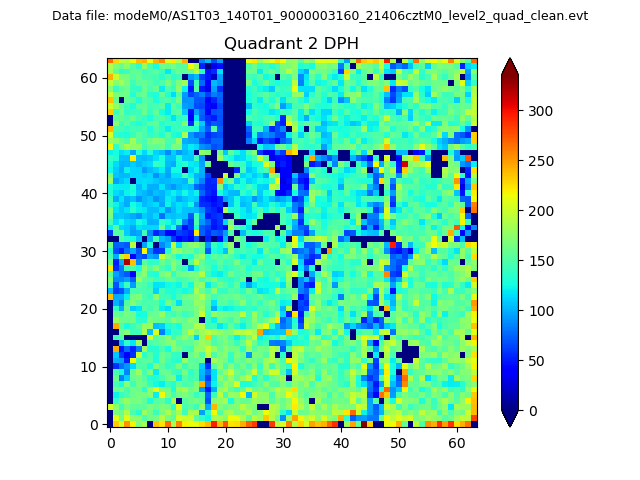
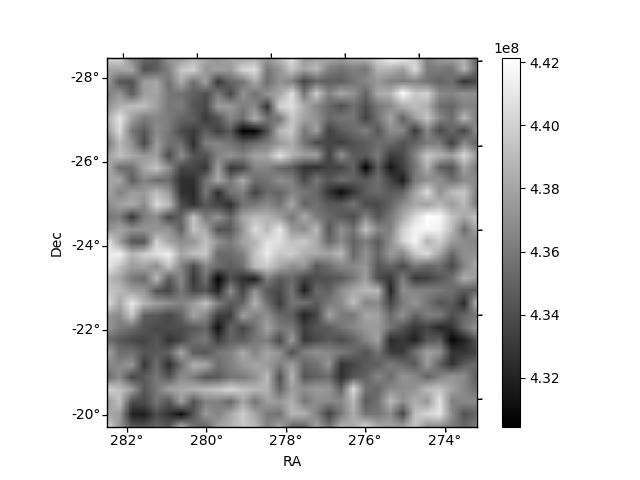
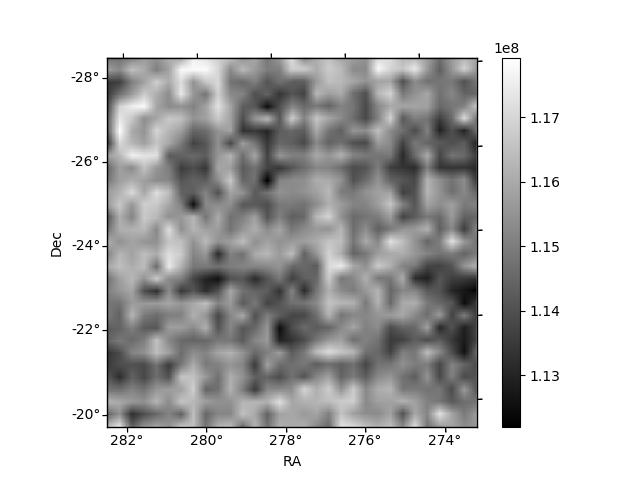
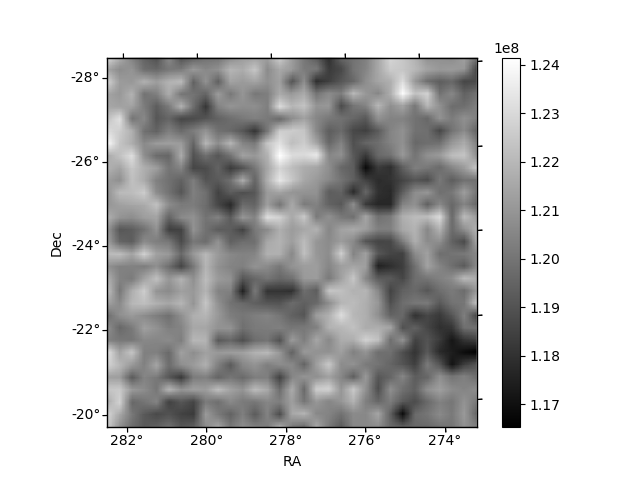
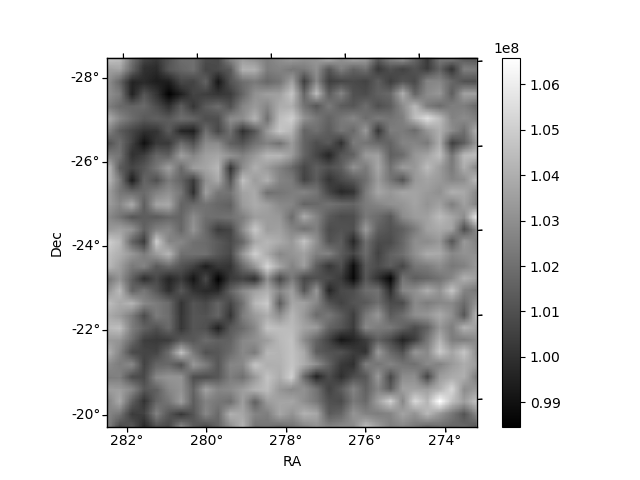
Histogram calculated using DETX and DETY for each event in the final _common_clean file
| Quadrant A | 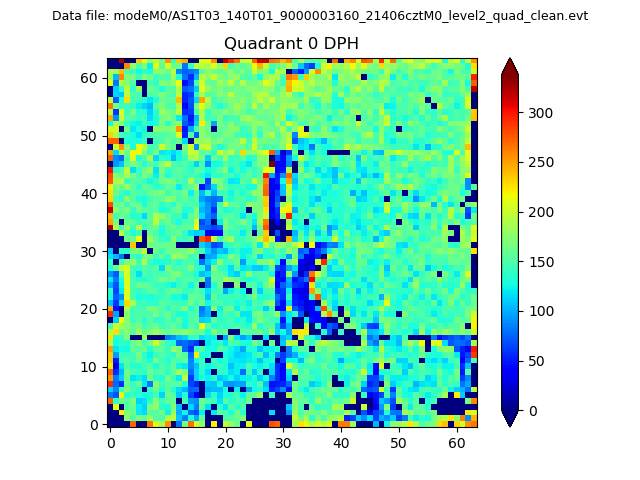 |
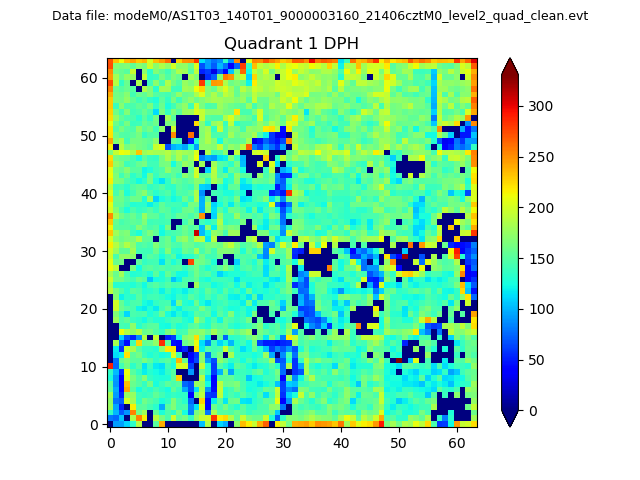 |
Quadrant B |
|---|---|---|---|
| Quadrant D | 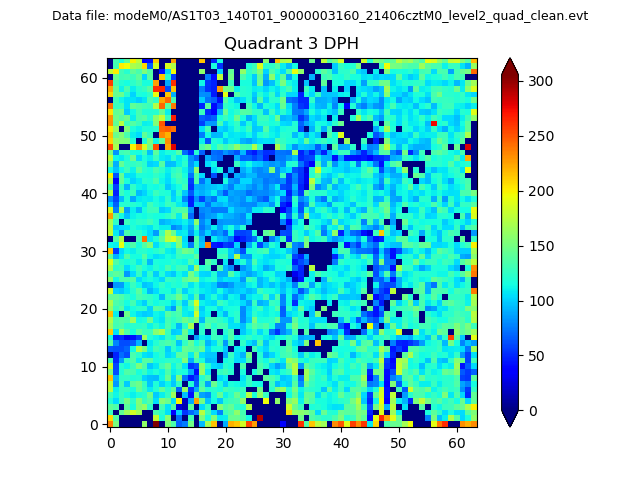 |
 |
Quadrant C |
| Plot type | Count rate plots | Images |
|---|---|---|
| Comparison with Poisson distribution Blue bars denote a histogram of data divided into 1 sec bins. Red curve is a Poisson curve with rate = median count rate of data. |
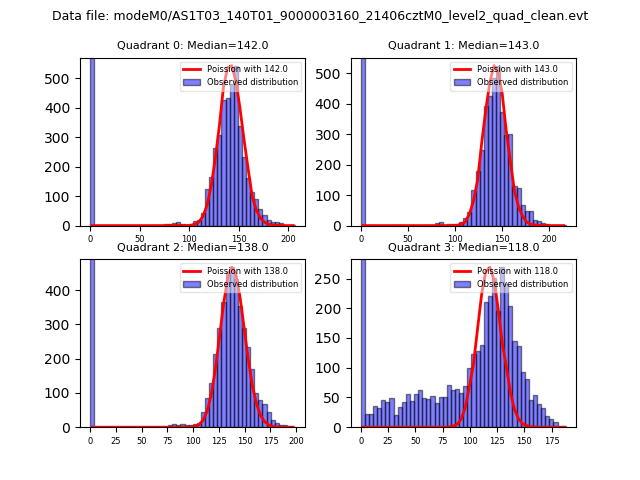 |
 |
| Quadrant-wise count rates Data is divided into 100 sec bins |
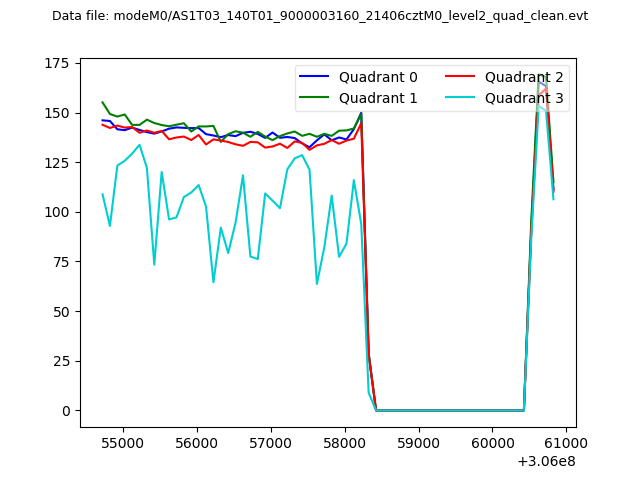 |
|
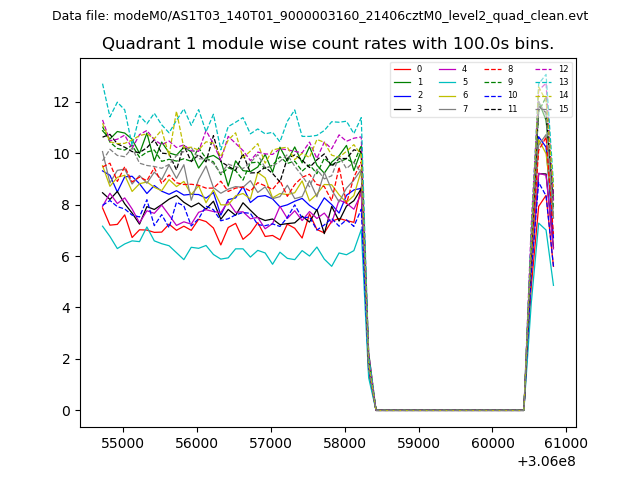
| Module-wise count rates for Quadrant A Data is divided into 100 sec bins |
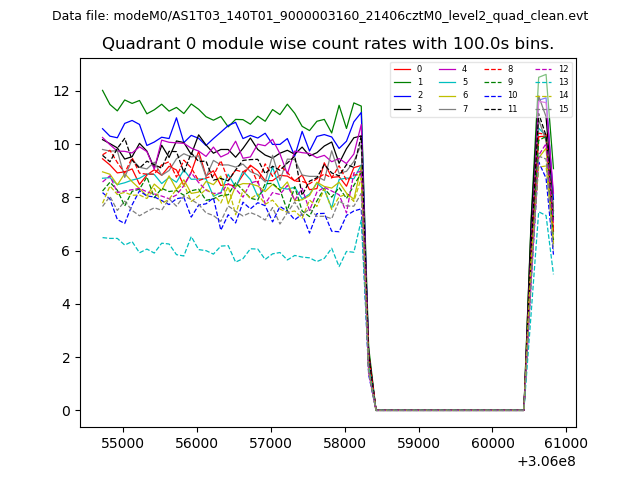 |
 |
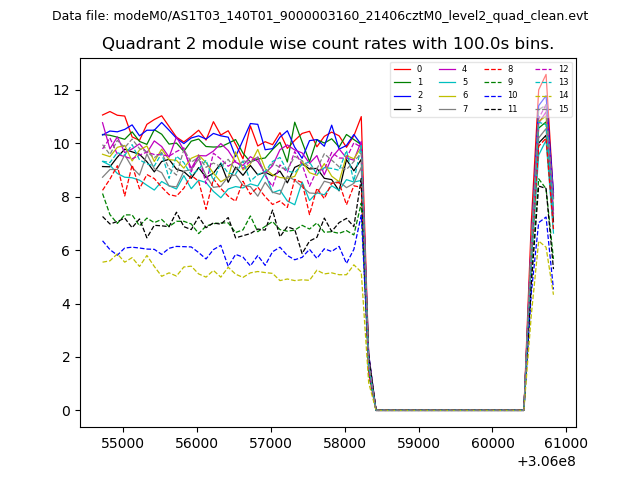
| Module-wise count rates for Quadrant B Data is divided into 100 sec bins |
 |
 |
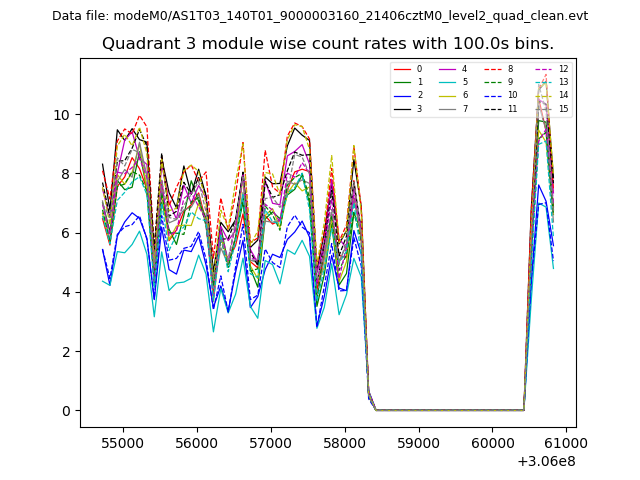
| Module-wise count rates for Quadrant C Data is divided into 100 sec bins |
 |
 |
| Module-wise count rates for Quadrant D Data is divided into 100 sec bins |
 |
 |
| Parameter | Plot |
|---|---|
| CZT HV Monitor | 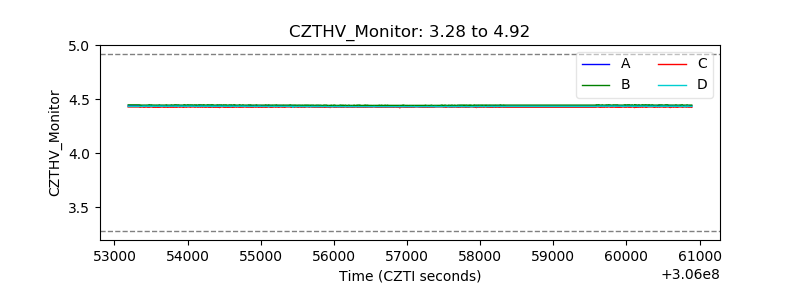 |
| D_VDD | 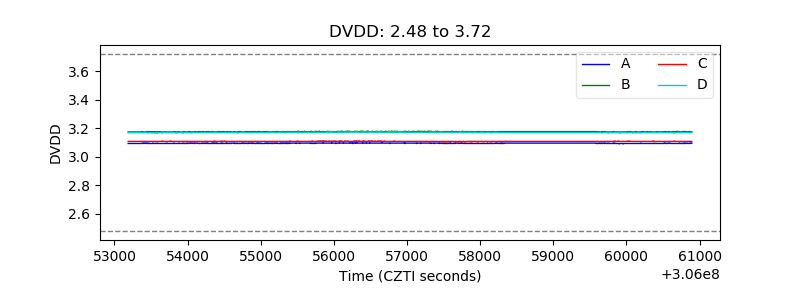 |
| Temperature 1 |  |
| Veto HV Monitor | 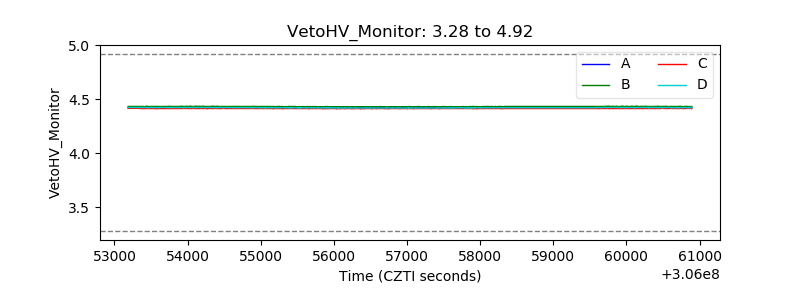 |
| Veto LLD | 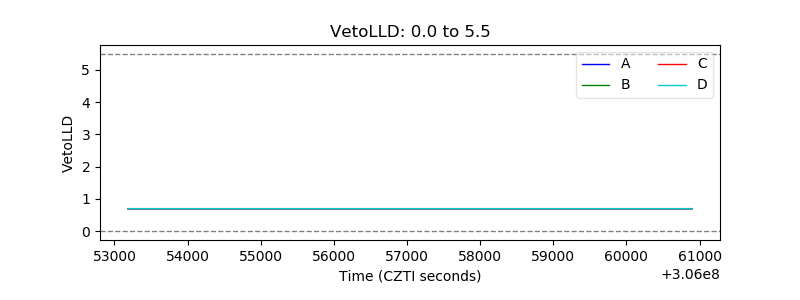 |
| Alpha Counter | 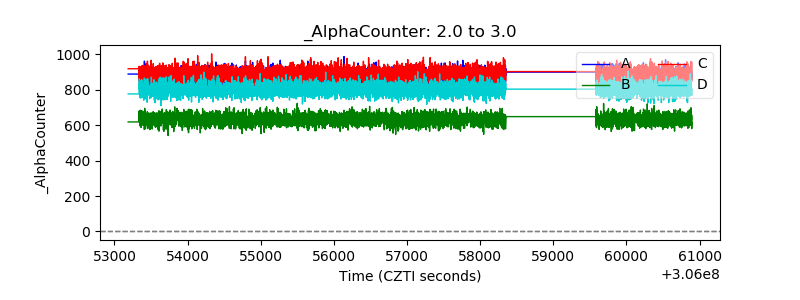 |
| _CPM_Rate | 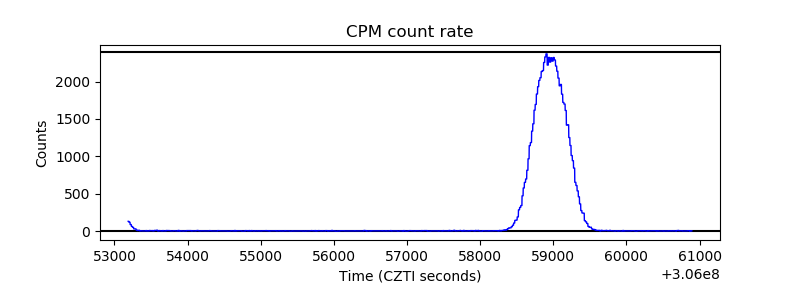 |
| CZT Counter | 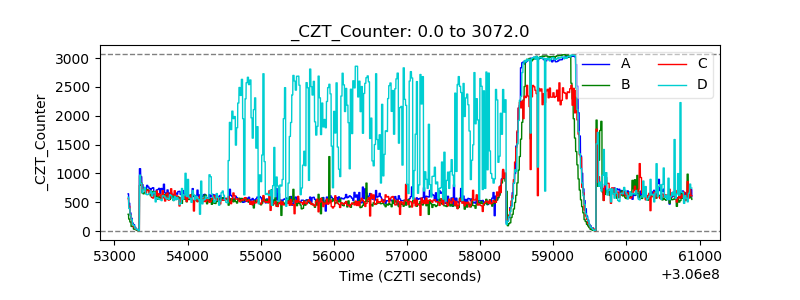 |
| +2.5 Volts monitor |  |
| +5 Volts monitor |  |
| _ROLL_ROT |  |
| _Roll_DEC |  |
| _Roll_RA | 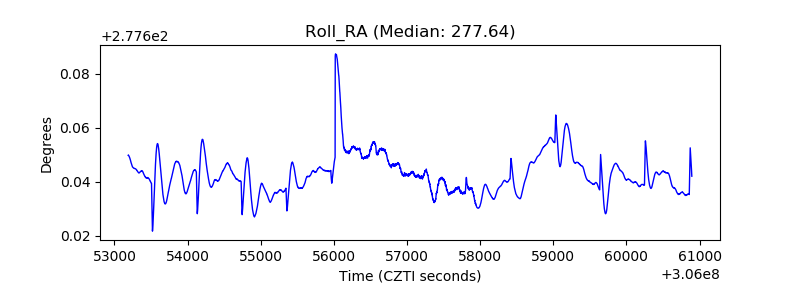 |
| Veto Counter | 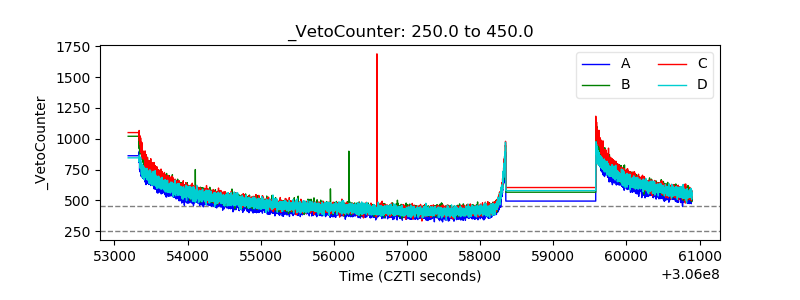 |