| Param | Original file | Final file |
|---|---|---|
| Filename | modeM0/AS1T03_140T01_9000003160_21407cztM0_level2.evt | modeM0/AS1T03_140T01_9000003160_21407cztM0_level2_quad_clean.evt |
| Size (bytes) | 685,745,280 | 95,137,920 |
| Size | 654.0 MB | 90.7 MB |
| Events in quadrant A | 3,643,970 | 657,484 |
| Events in quadrant B | 3,571,389 | 655,329 |
| Events in quadrant C | 4,700,199 | 616,704 |
| Events in quadrant D | 8,450,765 | 535,488 |
| Mode SS | |||
|---|---|---|---|
| Quadrant | BADHDUFLAG | Total packets | Discarded packets |
| A | 0 | 120 | 0 |
| B | 0 | 120 | 0 |
| C | 0 | 120 | 0 |
| D | 0 | 120 | 0 |
| Mode M0 | |||
|---|---|---|---|
| Quadrant | BADHDUFLAG | Total packets | Discarded packets |
| A | 0 | 15156 | 1 |
| B | 0 | 14491 | 1 |
| C | 0 | 18185 | 1 |
| D | 0 | 29414 | 1 |
| Mode M9 | |||
|---|---|---|---|
| Quadrant | BADHDUFLAG | Total packets | Discarded packets |
| A | 0 | 13 | 0 |
| B | 0 | 13 | 0 |
| C | 0 | 13 | 0 |
| D | 0 | 13 | 0 |
| Quadrant | Total seconds | Saturated seconds | Saturation percentage |
|---|---|---|---|
| A | 5951 | 76 | 1.277096% |
| B | 5951 | 181 | 3.041506% |
| C | 5952 | 519 | 8.719758% |
| D | 5952 | 1592 | 26.747312% |
Noise dominated data is calculated using 1-second bins in cleaned event files. If a bin has >2000 counts, and if more than 50% of those come from <1% of pixels, then it is considered to be noise-dominated and hence unusable.
| Quadrant | # 1 sec bins | Bins with >0 counts | Bins with >2000 counts | High rate bins dominated by noise | Noise dominated (total time) | Noise dominated (detector-on time) | Marked lightcurve |
|---|---|---|---|---|---|---|---|
| A | 7251 | 5951 | 0 | 0 | 0.00% | 0.00% | 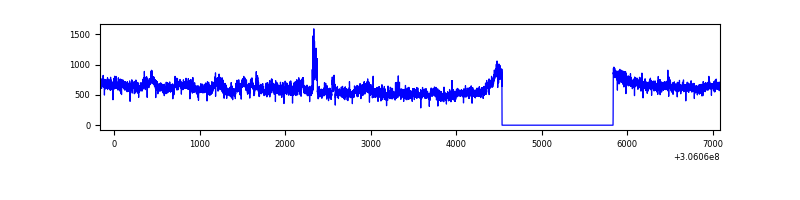 |
| B | 7251 | 5951 | 95 | 95 | 1.31% | 1.60% | 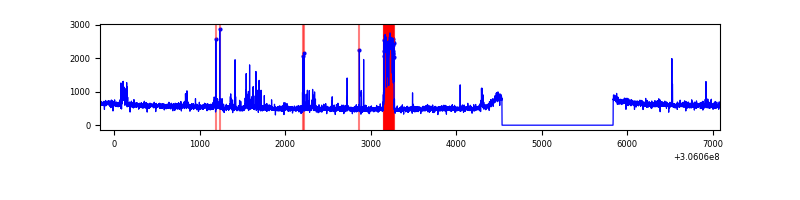 |
| C | 7252 | 5952 | 356 | 356 | 4.91% | 5.98% | 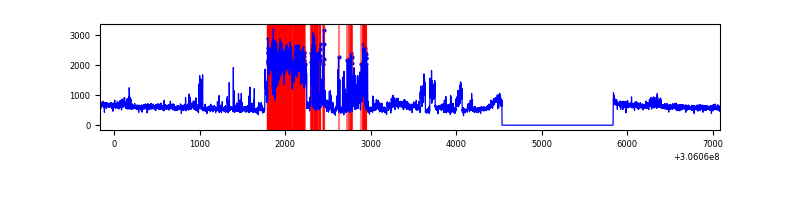 |
| D | 7252 | 5952 | 1562 | 1562 | 21.54% | 26.24% |  |
Top three noisy pixels from each quadrant. If the there are fewer than three noisy pixels in the level2.evt file, extra rows are filled as -1
| Pixel properties | Quadrant properties | ||||||
|---|---|---|---|---|---|---|---|
| Quadrant | DetID | PixID | Counts | Sigma | Mean | Median | Sigma |
| A | 5 | 168 | 366773 | 2212.21 | 839 | 826 | 165.4 |
| A | 15 | 174 | 27363 | 160.42 | 839 | 826 | 165.4 |
| A | 11 | 47 | 19066 | 110.26 | 839 | 826 | 165.4 |
| B | 6 | 36 | 278972 | 1843.67 | 817 | 801 | 150.9 |
| B | 0 | 230 | 34295 | 221.99 | 817 | 801 | 150.9 |
| B | 0 | 190 | 25740 | 165.29 | 817 | 801 | 150.9 |
| C | 3 | 233 | 1528424 | 8537.7 | 779 | 787 | 178.9 |
| C | 14 | 238 | 125679 | 698.0 | 779 | 787 | 178.9 |
| C | 0 | 236 | 7648 | 38.34 | 779 | 787 | 178.9 |
| D | 12 | 235 | 4752070 | 26603.34 | 743 | 725 | 178.6 |
| D | 1 | 52 | 621607 | 3476.39 | 743 | 725 | 178.6 |
| D | 7 | 38 | 109414 | 608.56 | 743 | 725 | 178.6 |
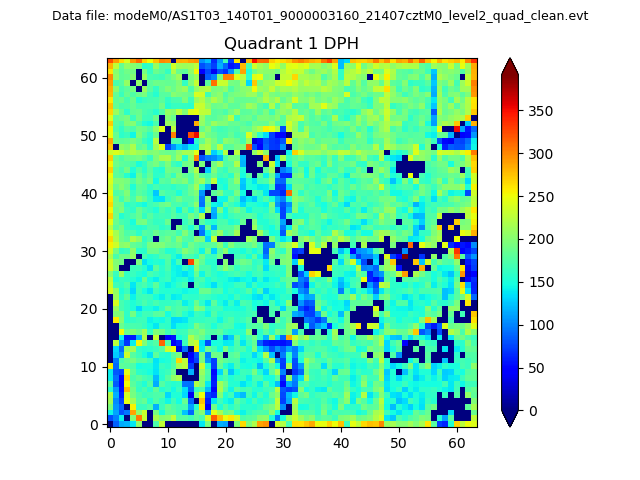
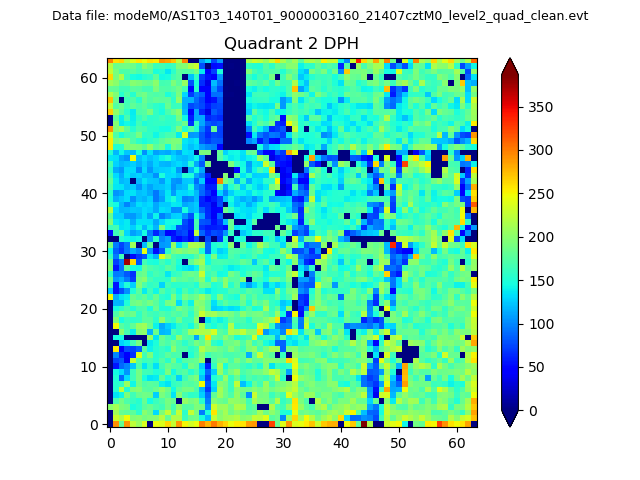
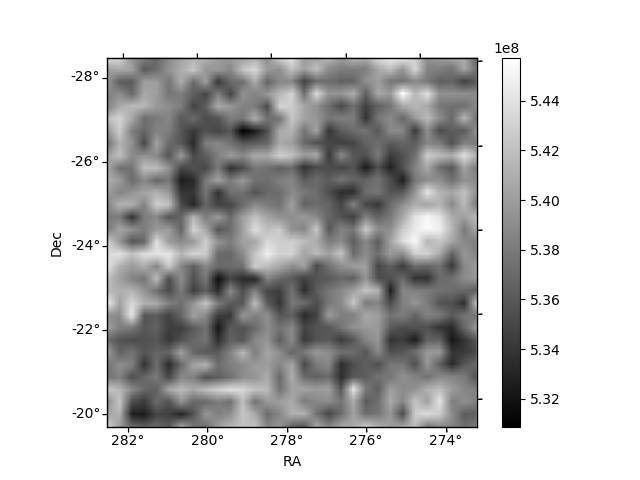
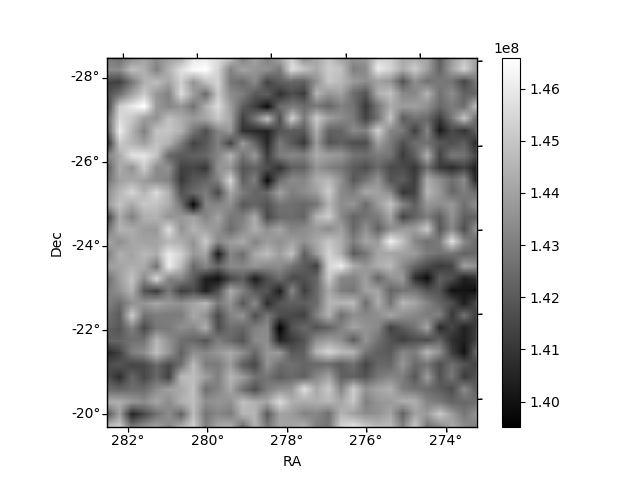
Histogram calculated using DETX and DETY for each event in the final _common_clean file
| Quadrant A | 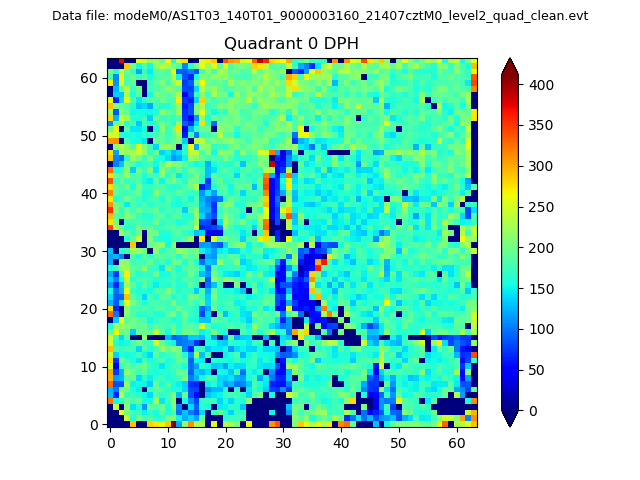 |
 |
Quadrant B |
|---|---|---|---|
| Quadrant D | 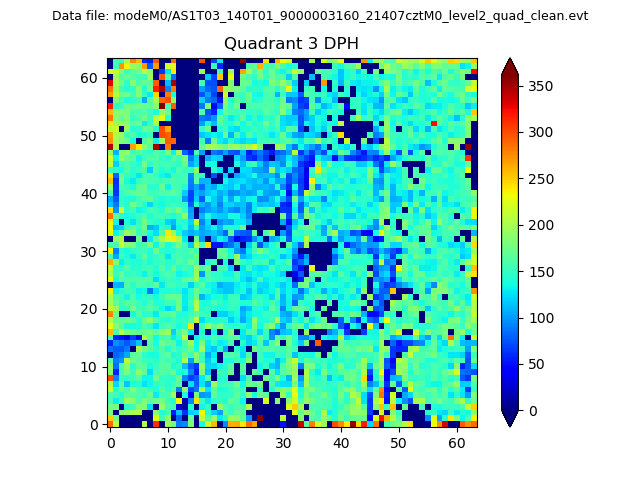 |
 |
Quadrant C |
| Plot type | Count rate plots | Images |
|---|---|---|
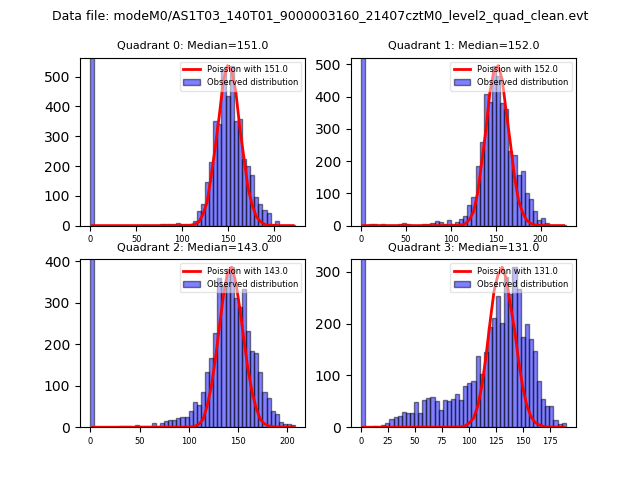
| Comparison with Poisson distribution Blue bars denote a histogram of data divided into 1 sec bins. Red curve is a Poisson curve with rate = median count rate of data. |
 |
 |
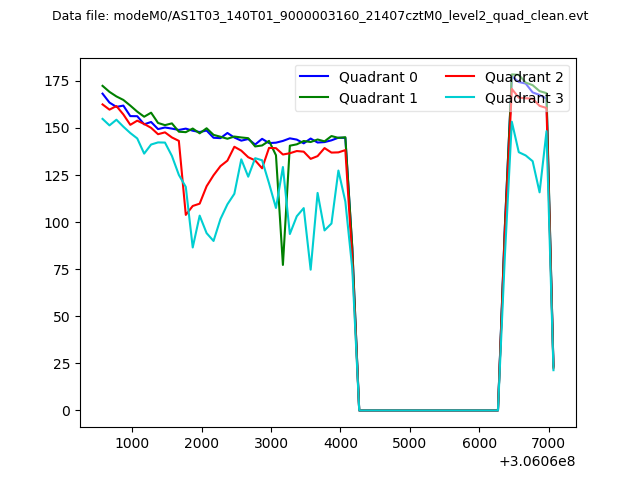
| Quadrant-wise count rates Data is divided into 100 sec bins |
 |
|
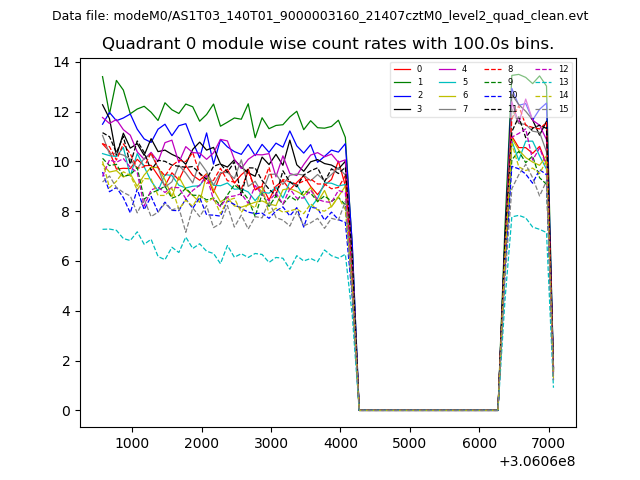
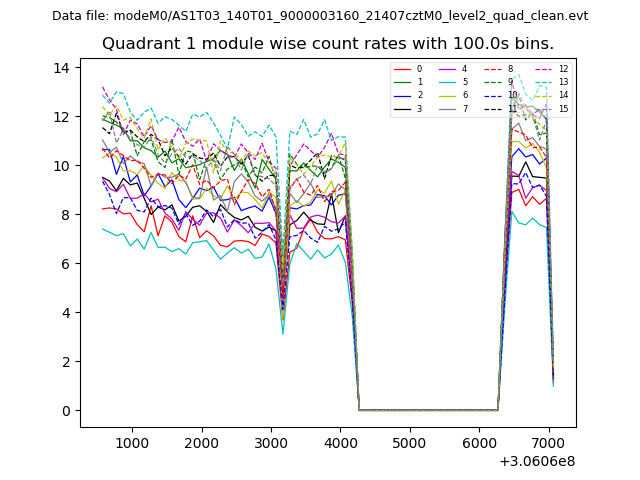
| Module-wise count rates for Quadrant A Data is divided into 100 sec bins |
 |
 |
| Module-wise count rates for Quadrant B Data is divided into 100 sec bins |
 |
 |
| Module-wise count rates for Quadrant C Data is divided into 100 sec bins |
 |
 |
| Module-wise count rates for Quadrant D Data is divided into 100 sec bins |
 |
 |
| Parameter | Plot |
|---|---|
| CZT HV Monitor | 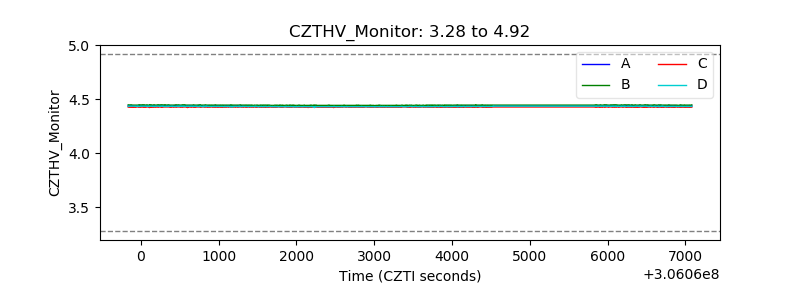 |
| D_VDD |  |
| Temperature 1 | 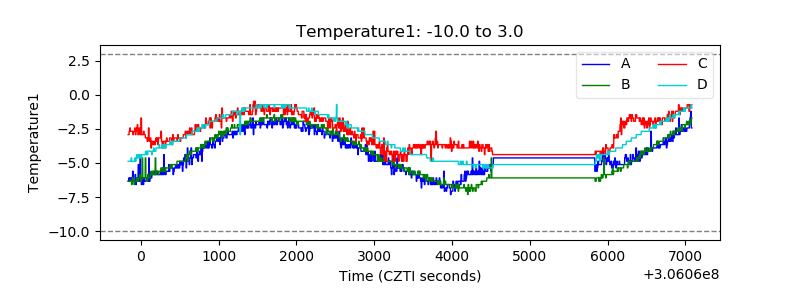 |
| Veto HV Monitor | 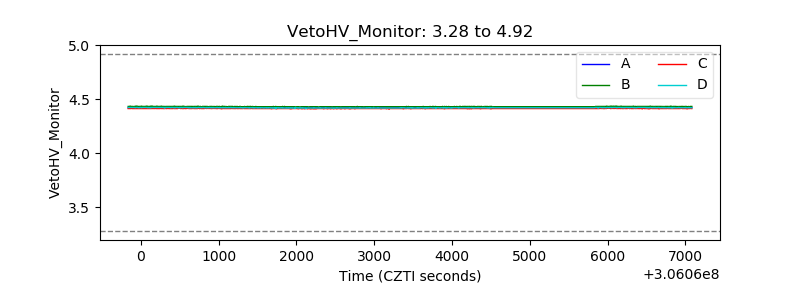 |
| Veto LLD | 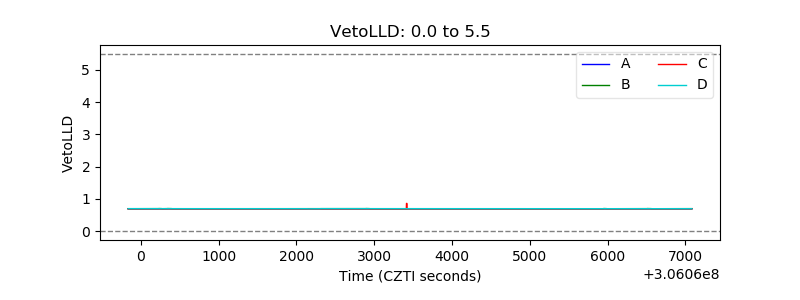 |
| Alpha Counter | 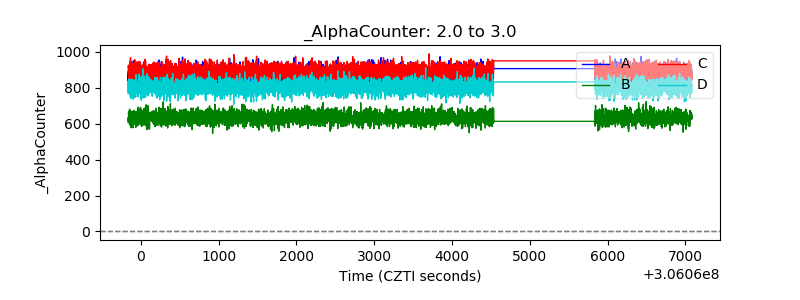 |
| _CPM_Rate | 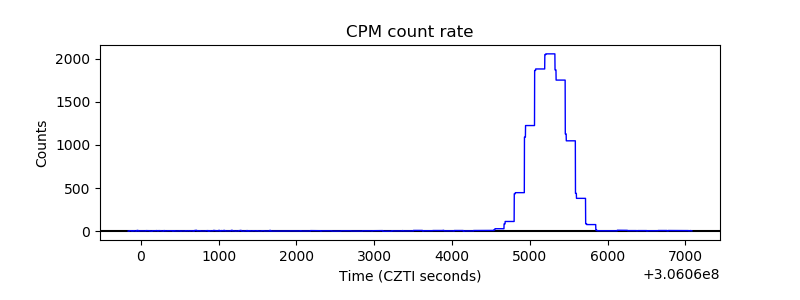 |
| CZT Counter | 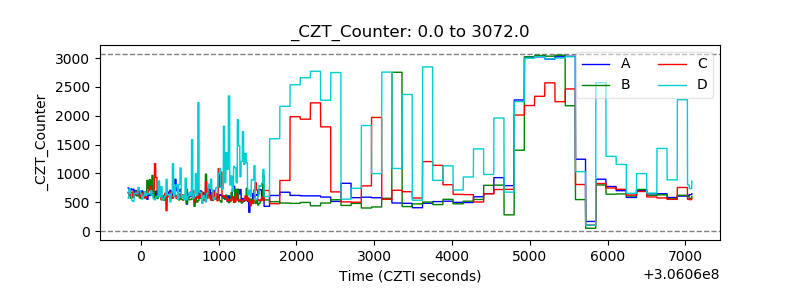 |
| +2.5 Volts monitor |  |
| +5 Volts monitor |  |
| _ROLL_ROT |  |
| _Roll_DEC | 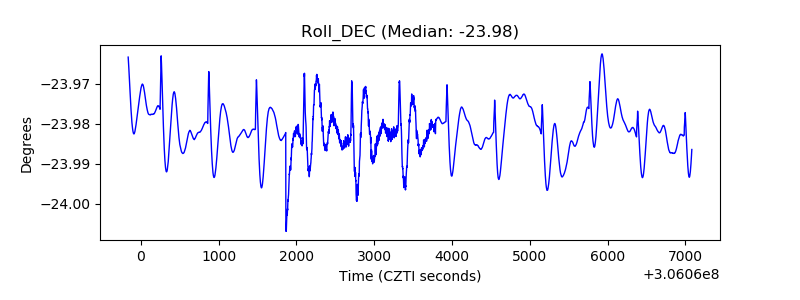 |
| _Roll_RA | 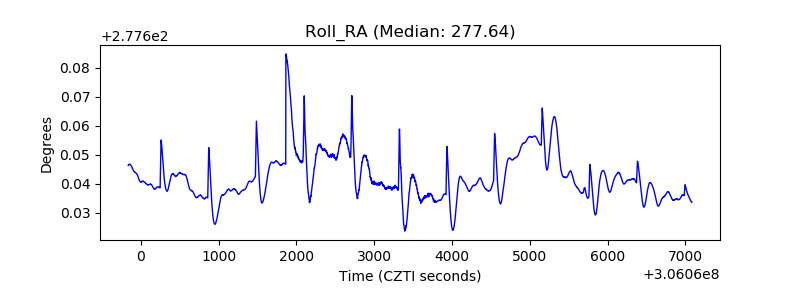 |
| Veto Counter |  |