| Param | Original file | Final file |
|---|---|---|
| Filename | modeM0/AS1T03_140T01_9000003160_21409cztM0_level2.evt | modeM0/AS1T03_140T01_9000003160_21409cztM0_level2_quad_clean.evt |
| Size (bytes) | 605,105,280 | 116,058,240 |
| Size | 577.1 MB | 110.7 MB |
| Events in quadrant A | 3,714,750 | 793,591 |
| Events in quadrant B | 3,588,376 | 793,618 |
| Events in quadrant C | 3,589,159 | 757,484 |
| Events in quadrant D | 6,983,727 | 706,885 |
| Mode SS | |||
|---|---|---|---|
| Quadrant | BADHDUFLAG | Total packets | Discarded packets |
| A | 0 | 136 | 0 |
| B | 0 | 136 | 0 |
| C | 0 | 136 | 0 |
| D | 0 | 136 | 0 |
| Mode M0 | |||
|---|---|---|---|
| Quadrant | BADHDUFLAG | Total packets | Discarded packets |
| A | 0 | 15381 | 2 |
| B | 0 | 14837 | 2 |
| C | 0 | 14740 | 2 |
| D | 0 | 25579 | 4 |
| Mode M9 | |||
|---|---|---|---|
| Quadrant | BADHDUFLAG | Total packets | Discarded packets |
| A | 0 | 17 | 0 |
| B | 0 | 18 | 0 |
| C | 0 | 18 | 0 |
| D | 0 | 18 | 0 |
| Quadrant | Total seconds | Saturated seconds | Saturation percentage |
|---|---|---|---|
| A | 6642 | 115 | 1.731406% |
| B | 6642 | 127 | 1.912075% |
| C | 6642 | 148 | 2.228245% |
| D | 6641 | 657 | 9.893088% |
Noise dominated data is calculated using 1-second bins in cleaned event files. If a bin has >2000 counts, and if more than 50% of those come from <1% of pixels, then it is considered to be noise-dominated and hence unusable.
| Quadrant | # 1 sec bins | Bins with >0 counts | Bins with >2000 counts | High rate bins dominated by noise | Noise dominated (total time) | Noise dominated (detector-on time) | Marked lightcurve |
|---|---|---|---|---|---|---|---|
| A | 7858 | 6642 | 1 | 1 | 0.01% | 0.02% | 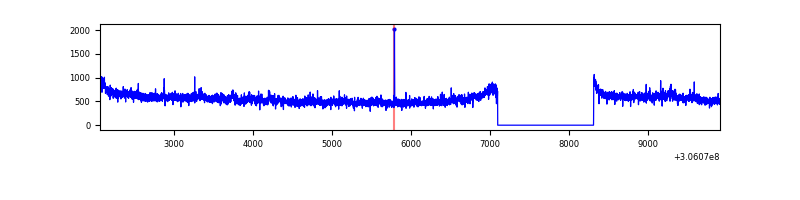 |
| B | 7858 | 6642 | 11 | 11 | 0.14% | 0.17% | 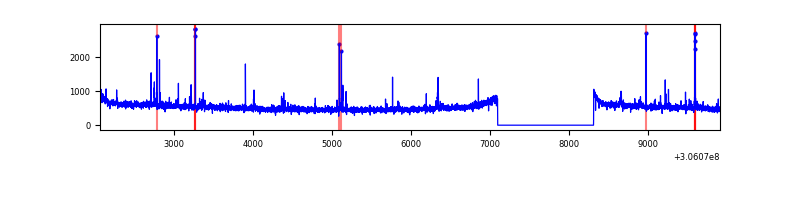 |
| C | 7858 | 6642 | 2 | 2 | 0.03% | 0.03% | 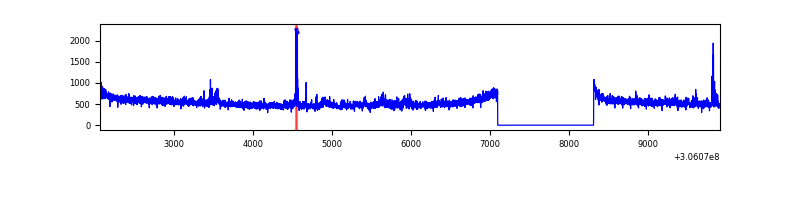 |
| D | 7857 | 6641 | 668 | 668 | 8.50% | 10.06% | 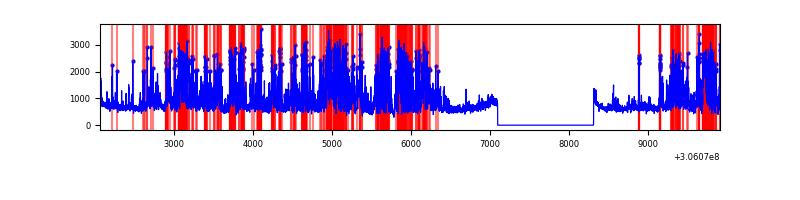 |
Top three noisy pixels from each quadrant. If the there are fewer than three noisy pixels in the level2.evt file, extra rows are filled as -1
| Pixel properties | Quadrant properties | ||||||
|---|---|---|---|---|---|---|---|
| Quadrant | DetID | PixID | Counts | Sigma | Mean | Median | Sigma |
| A | 5 | 168 | 195461 | 1088.09 | 898 | 884 | 178.8 |
| A | 11 | 47 | 48479 | 266.16 | 898 | 884 | 178.8 |
| A | 13 | 254 | 10604 | 54.36 | 898 | 884 | 178.8 |
| B | 0 | 230 | 37238 | 217.97 | 881 | 861 | 166.9 |
| B | 0 | 190 | 28282 | 164.31 | 881 | 861 | 166.9 |
| B | 6 | 36 | 20869 | 119.89 | 881 | 861 | 166.9 |
| C | 3 | 233 | 171026 | 875.92 | 839 | 844 | 194.3 |
| C | 14 | 238 | 135182 | 691.43 | 839 | 844 | 194.3 |
| C | 0 | 236 | 10604 | 50.23 | 839 | 844 | 194.3 |
| D | 12 | 235 | 2339869 | 11471.6 | 845 | 824 | 203.9 |
| D | 1 | 52 | 490874 | 2403.4 | 845 | 824 | 203.9 |
| D | 1 | 20 | 365449 | 1788.27 | 845 | 824 | 203.9 |
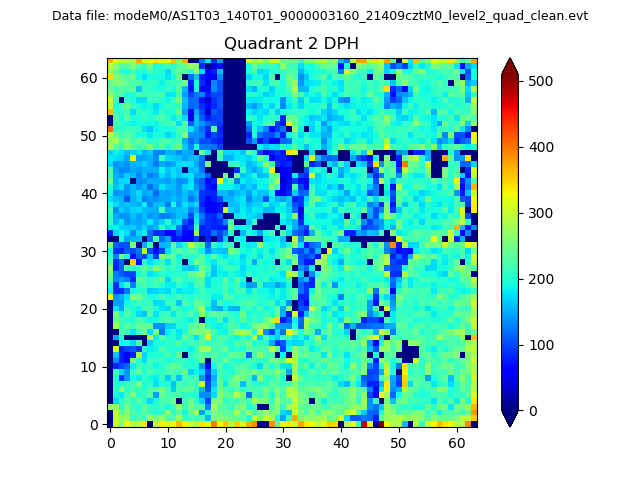
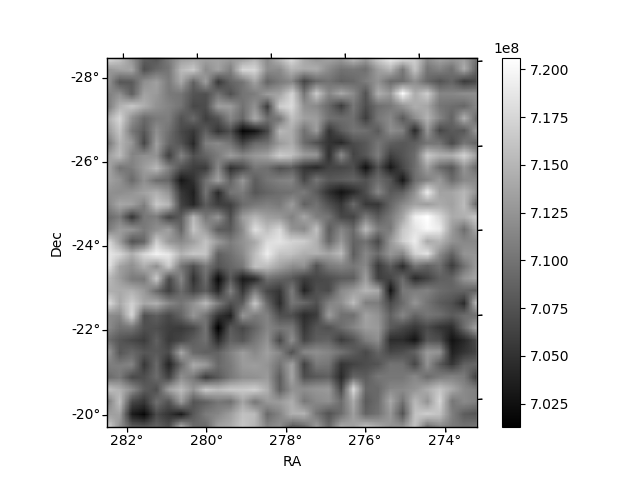
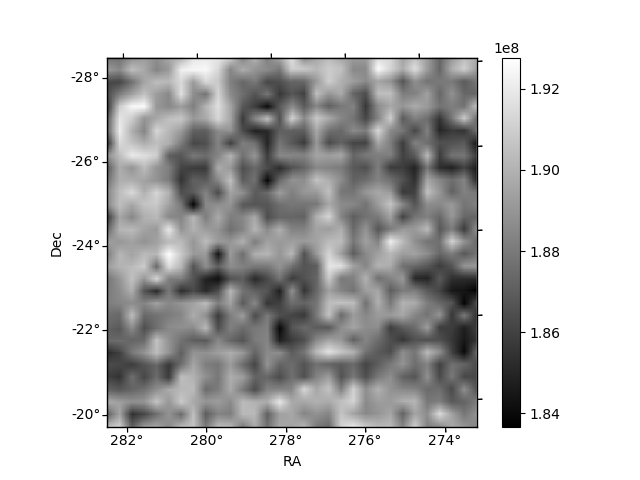
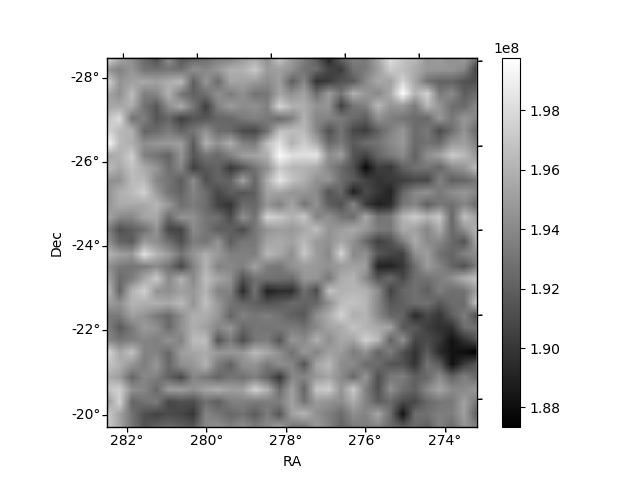
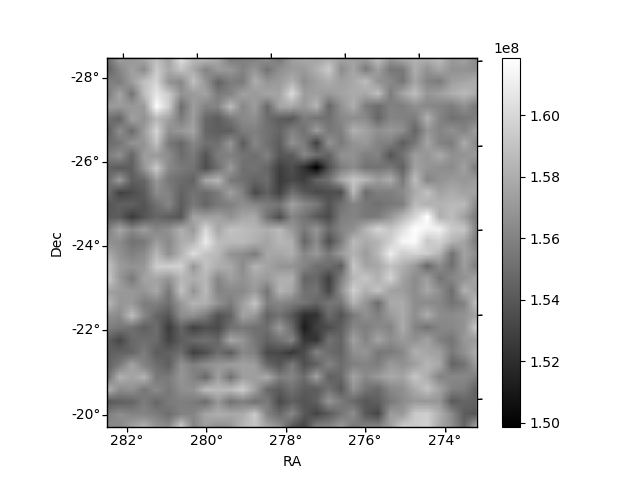
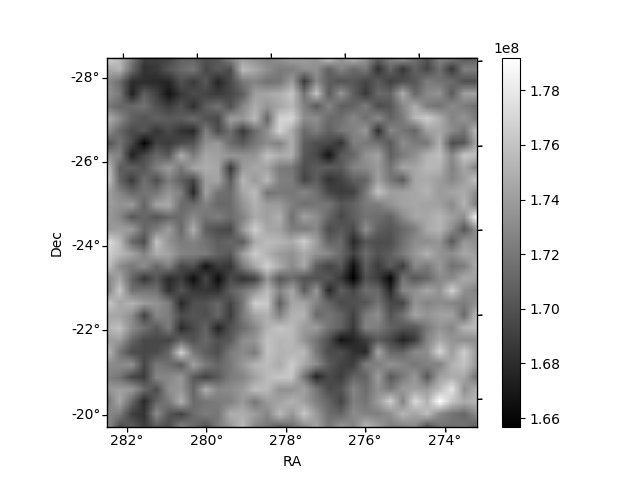
Histogram calculated using DETX and DETY for each event in the final _common_clean file
| Quadrant A | 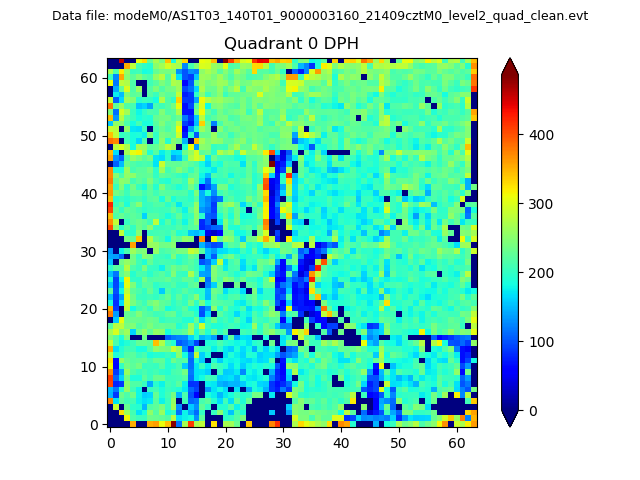 |
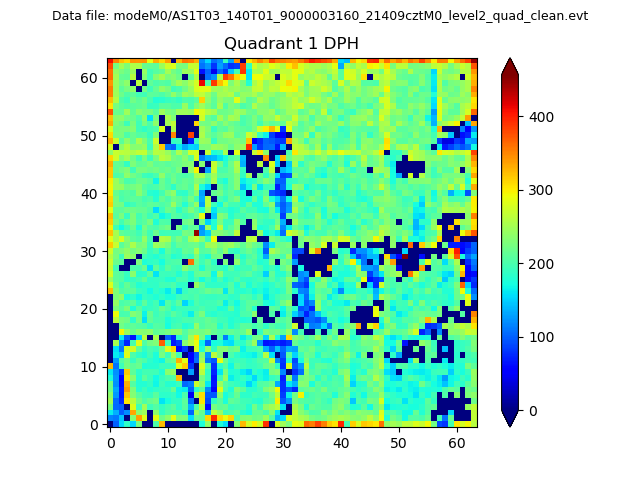 |
Quadrant B |
|---|---|---|---|
| Quadrant D | 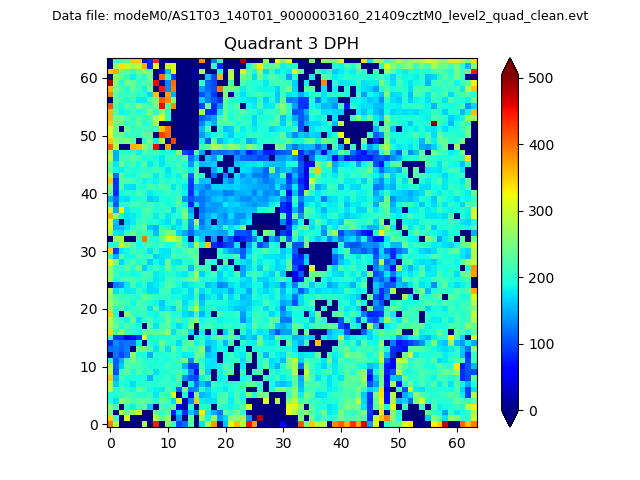 |
 |
Quadrant C |
| Plot type | Count rate plots | Images |
|---|---|---|
| Comparison with Poisson distribution Blue bars denote a histogram of data divided into 1 sec bins. Red curve is a Poisson curve with rate = median count rate of data. |
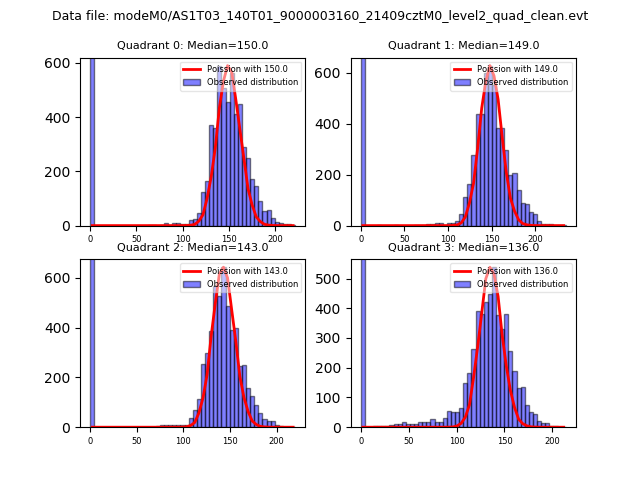 |
 |
| Quadrant-wise count rates Data is divided into 100 sec bins |
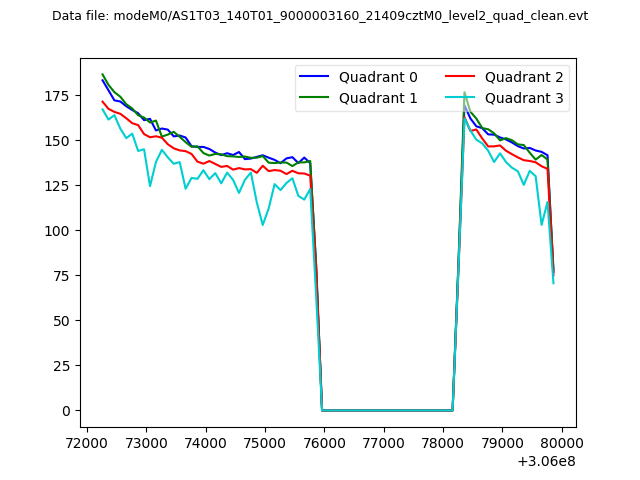 |
|
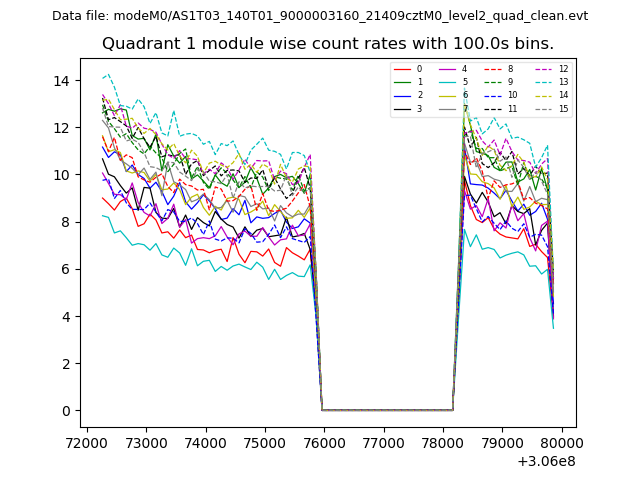
| Module-wise count rates for Quadrant A Data is divided into 100 sec bins |
 |
 |
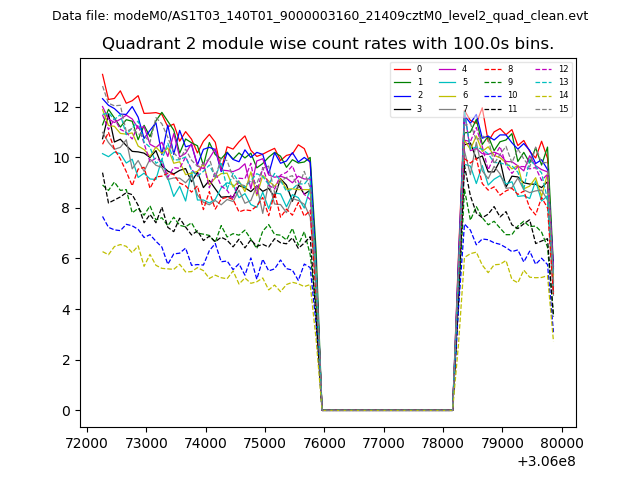
| Module-wise count rates for Quadrant B Data is divided into 100 sec bins |
 |
 |
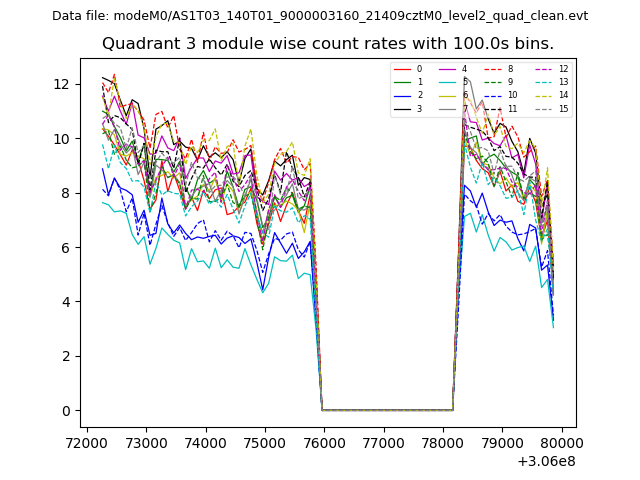
| Module-wise count rates for Quadrant C Data is divided into 100 sec bins |
 |
 |
| Module-wise count rates for Quadrant D Data is divided into 100 sec bins |
 |
 |
| Parameter | Plot |
|---|---|
| CZT HV Monitor | 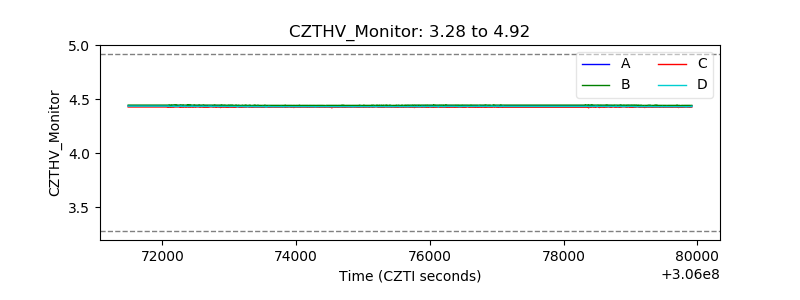 |
| D_VDD | 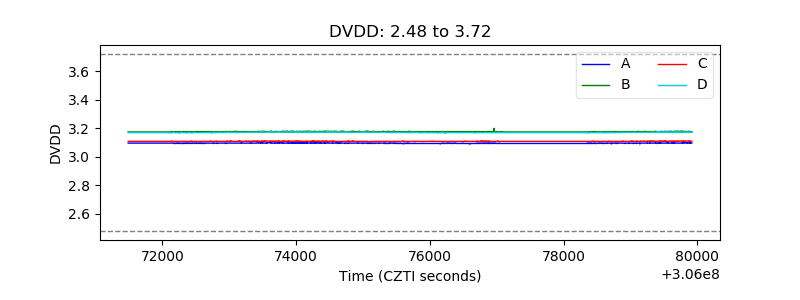 |
| Temperature 1 | 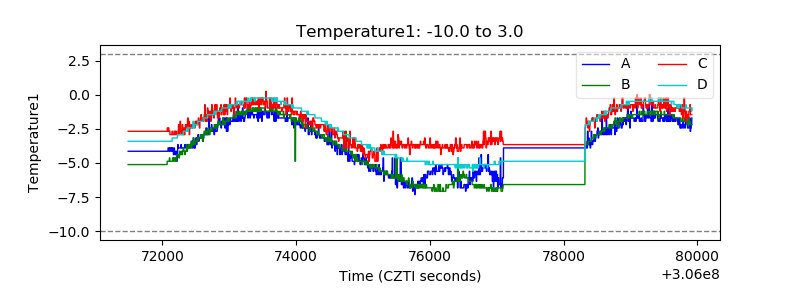 |
| Veto HV Monitor | 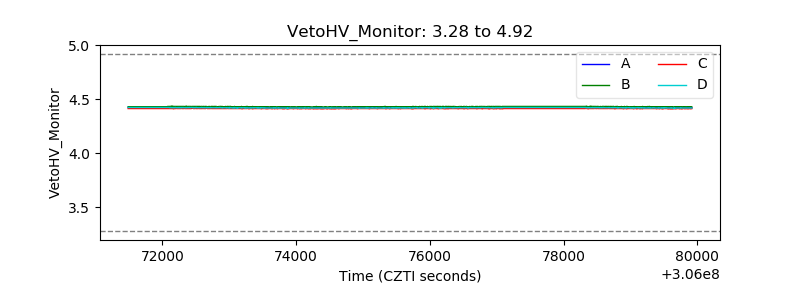 |
| Veto LLD | 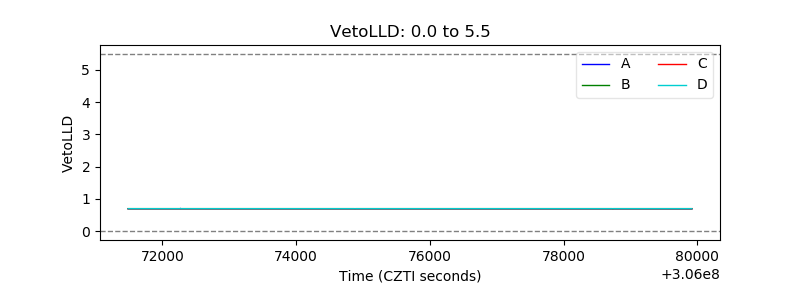 |
| Alpha Counter | 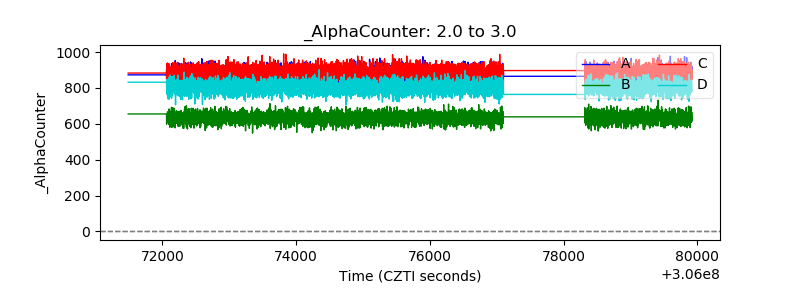 |
| _CPM_Rate | 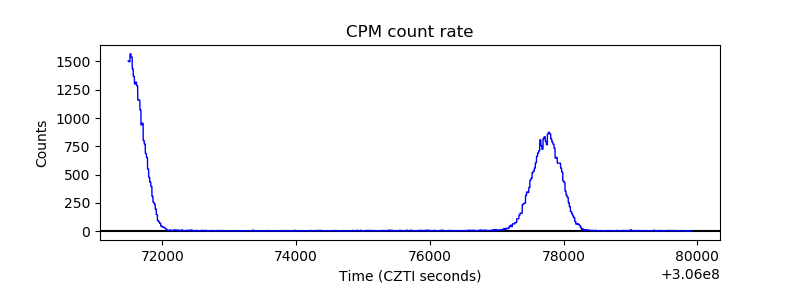 |
| CZT Counter | 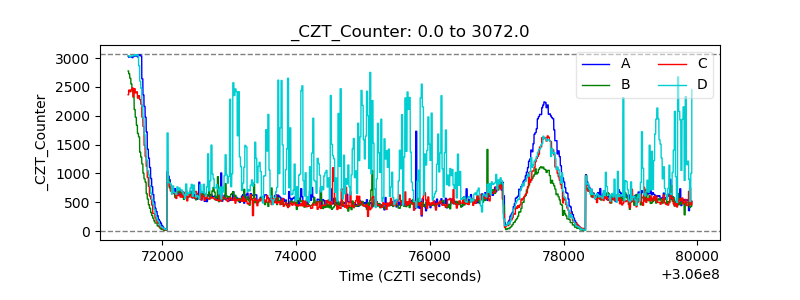 |
| +2.5 Volts monitor |  |
| +5 Volts monitor |  |
| _ROLL_ROT |  |
| _Roll_DEC |  |
| _Roll_RA | 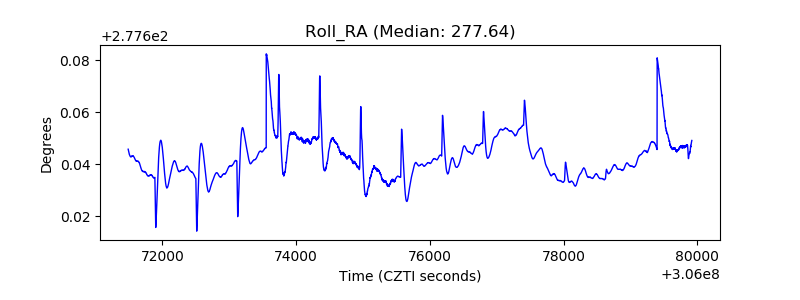 |
| Veto Counter | 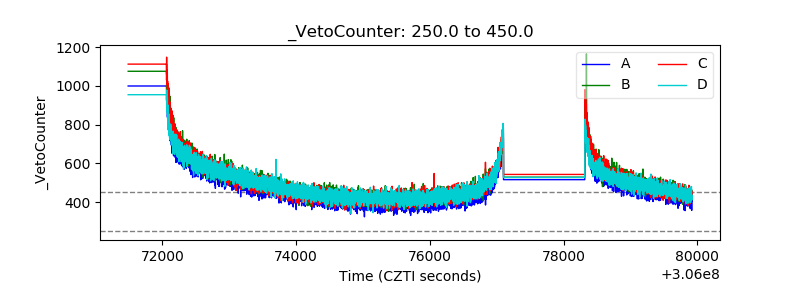 |