| Param | Original file | Final file |
|---|---|---|
| Filename | modeM0/AS1T03_140T01_9000003160_21410cztM0_level2.evt | modeM0/AS1T03_140T01_9000003160_21410cztM0_level2_quad_clean.evt |
| Size (bytes) | 590,618,880 | 96,658,560 |
| Size | 563.3 MB | 92.2 MB |
| Events in quadrant A | 3,487,529 | 648,573 |
| Events in quadrant B | 3,314,939 | 650,492 |
| Events in quadrant C | 3,231,906 | 624,290 |
| Events in quadrant D | 7,413,516 | 551,307 |
| Mode SS | |||
|---|---|---|---|
| Quadrant | BADHDUFLAG | Total packets | Discarded packets |
| A | 0 | 132 | 0 |
| B | 0 | 132 | 0 |
| C | 0 | 132 | 0 |
| D | 0 | 132 | 0 |
| Mode M0 | |||
|---|---|---|---|
| Quadrant | BADHDUFLAG | Total packets | Discarded packets |
| A | 0 | 14319 | 1 |
| B | 0 | 13886 | 2 |
| C | 0 | 13642 | 1 |
| D | 0 | 26599 | 1 |
| Mode M9 | |||
|---|---|---|---|
| Quadrant | BADHDUFLAG | Total packets | Discarded packets |
| A | 0 | 10 | 0 |
| B | 0 | 10 | 0 |
| C | 0 | 10 | 0 |
| D | 0 | 10 | 0 |
| Quadrant | Total seconds | Saturated seconds | Saturation percentage |
|---|---|---|---|
| A | 6481 | 93 | 1.434964% |
| B | 6480 | 103 | 1.589506% |
| C | 6480 | 119 | 1.836420% |
| D | 6481 | 1082 | 16.694954% |
Noise dominated data is calculated using 1-second bins in cleaned event files. If a bin has >2000 counts, and if more than 50% of those come from <1% of pixels, then it is considered to be noise-dominated and hence unusable.
| Quadrant | # 1 sec bins | Bins with >0 counts | Bins with >2000 counts | High rate bins dominated by noise | Noise dominated (total time) | Noise dominated (detector-on time) | Marked lightcurve |
|---|---|---|---|---|---|---|---|
| A | 7451 | 6481 | 0 | 0 | 0.00% | 0.00% | 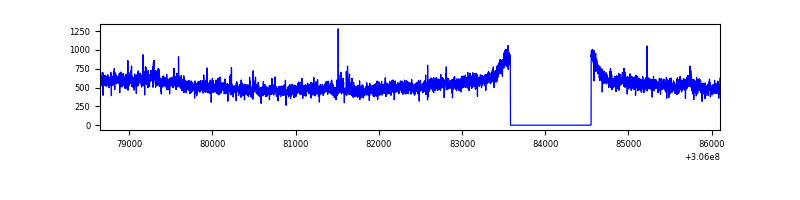 |
| B | 7450 | 6480 | 8 | 8 | 0.11% | 0.12% | 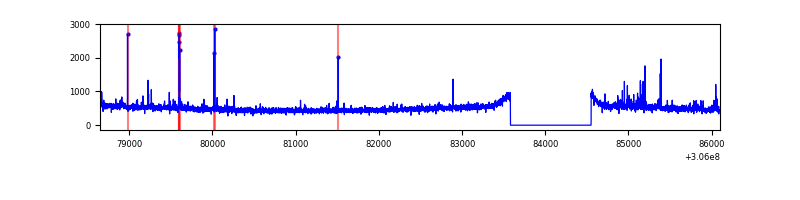 |
| C | 7450 | 6481 | 0 | 0 | 0.00% | 0.00% | 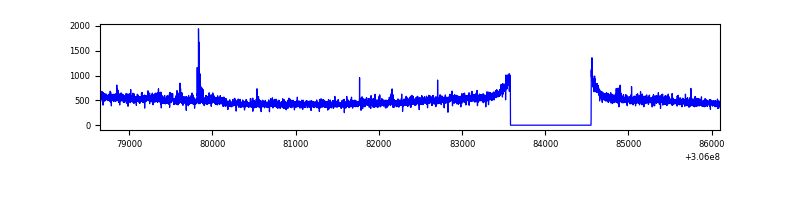 |
| D | 7451 | 6481 | 1025 | 1025 | 13.76% | 15.82% | 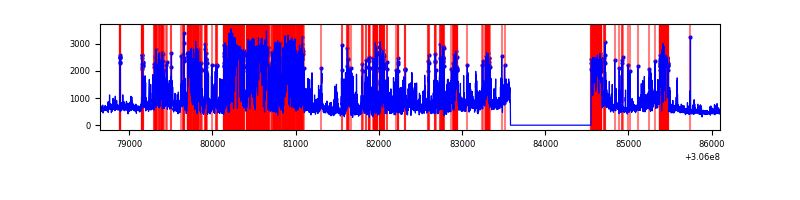 |
Top three noisy pixels from each quadrant. If the there are fewer than three noisy pixels in the level2.evt file, extra rows are filled as -1
| Pixel properties | Quadrant properties | ||||||
|---|---|---|---|---|---|---|---|
| Quadrant | DetID | PixID | Counts | Sigma | Mean | Median | Sigma |
| A | 5 | 168 | 264167 | 1584.17 | 824 | 809 | 166.2 |
| A | 11 | 47 | 48882 | 289.17 | 824 | 809 | 166.2 |
| A | 13 | 254 | 9333 | 51.27 | 824 | 809 | 166.2 |
| B | 0 | 189 | 44572 | 284.14 | 812 | 794 | 154.1 |
| B | 0 | 230 | 33813 | 214.31 | 812 | 794 | 154.1 |
| B | 0 | 190 | 20018 | 124.77 | 812 | 794 | 154.1 |
| C | 14 | 238 | 123514 | 676.89 | 774 | 779 | 181.3 |
| C | 3 | 233 | 85599 | 467.79 | 774 | 779 | 181.3 |
| C | 0 | 236 | 5627 | 26.74 | 774 | 779 | 181.3 |
| D | 12 | 235 | 3441647 | 18764.46 | 747 | 725 | 183.4 |
| D | 7 | 38 | 411552 | 2240.37 | 747 | 725 | 183.4 |
| D | 1 | 52 | 310986 | 1691.95 | 747 | 725 | 183.4 |
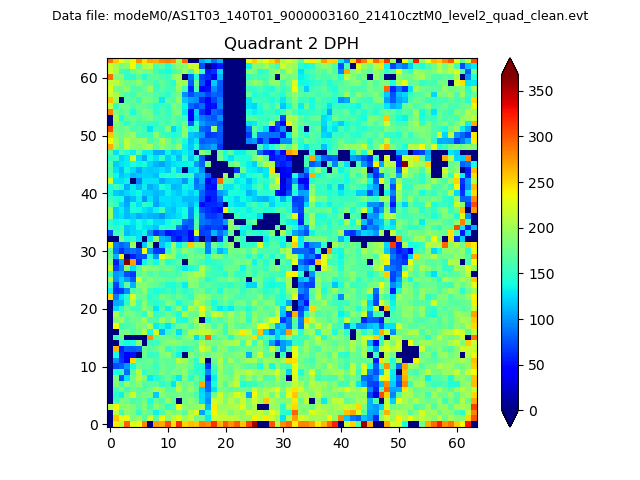
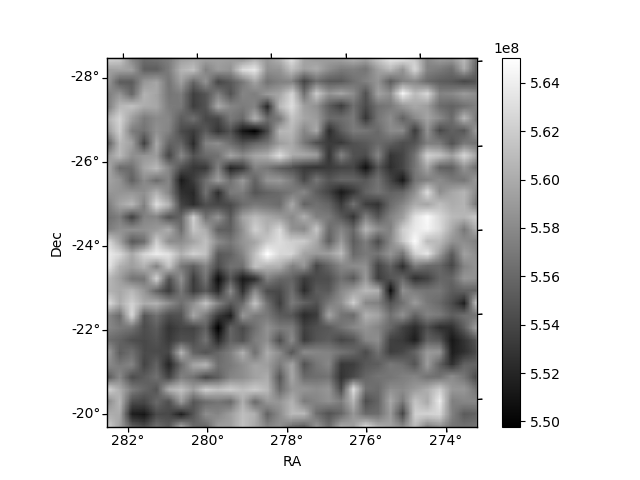
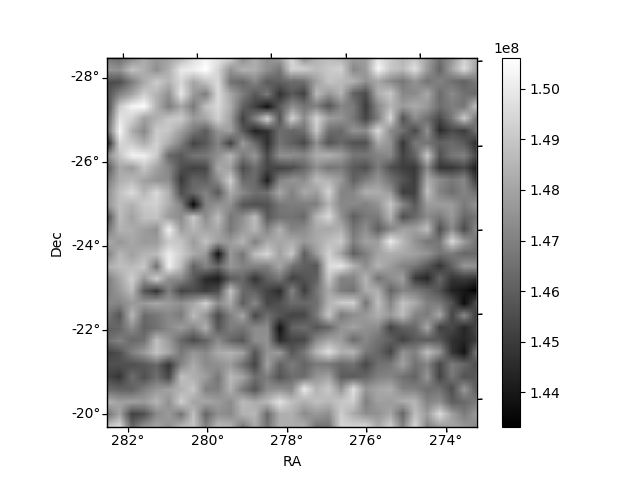
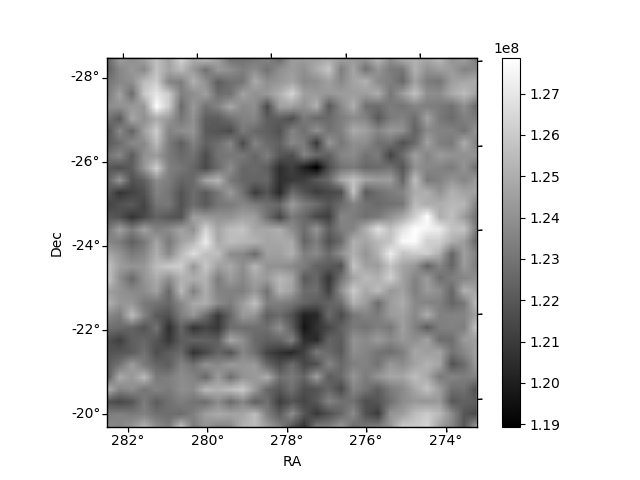
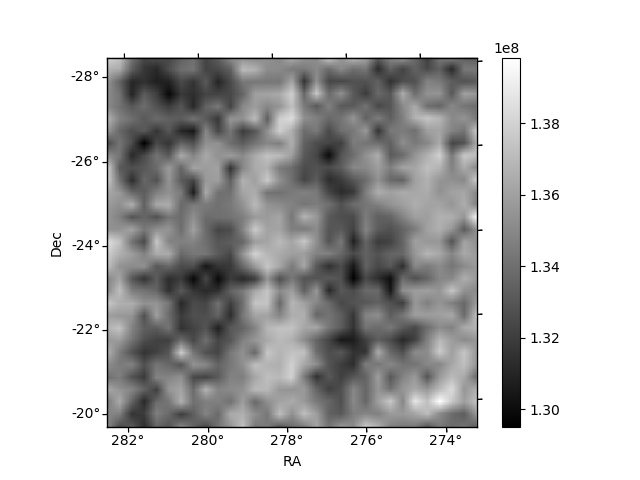
Histogram calculated using DETX and DETY for each event in the final _common_clean file
| Quadrant A | 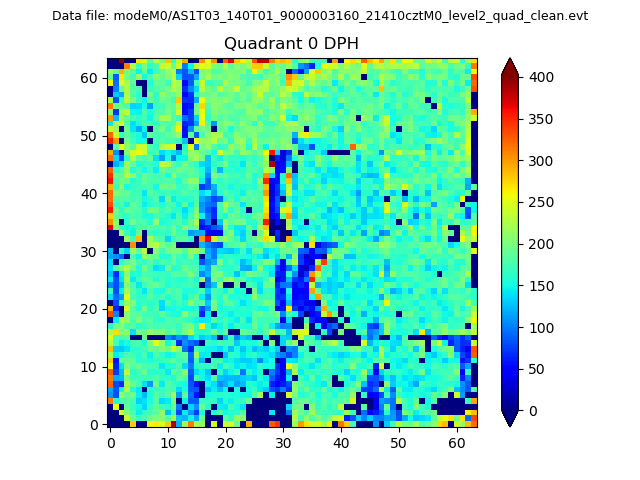 |
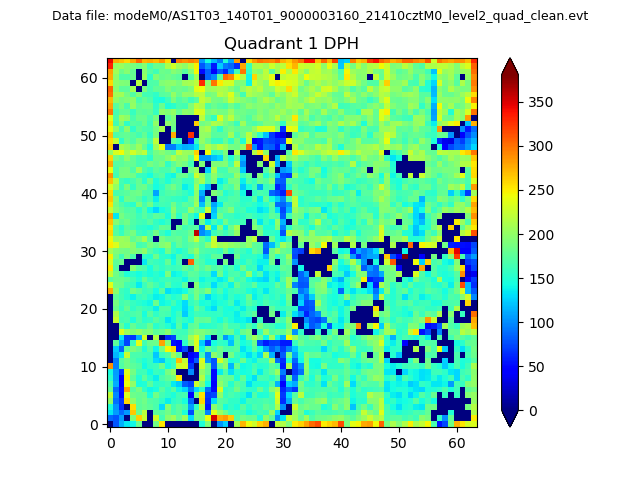 |
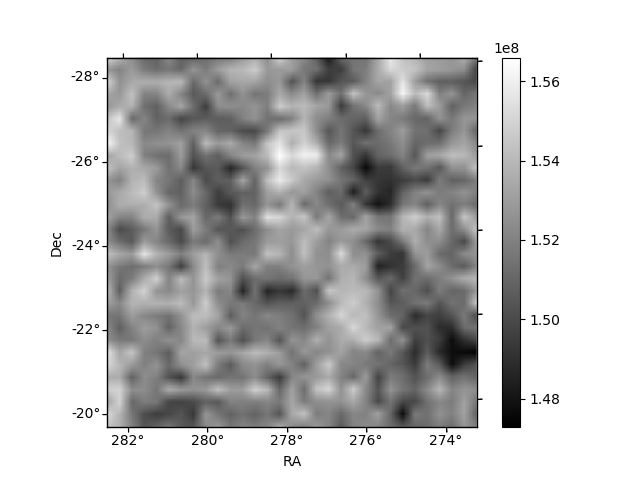
Quadrant B |
|---|---|---|---|
| Quadrant D | 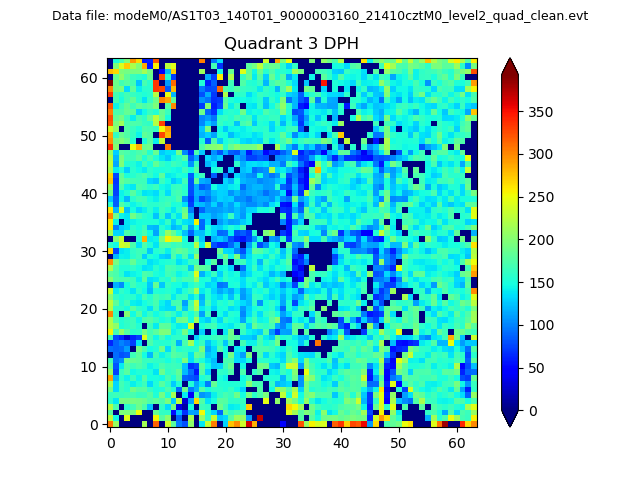 |
 |
Quadrant C |
| Plot type | Count rate plots | Images |
|---|---|---|
| Comparison with Poisson distribution Blue bars denote a histogram of data divided into 1 sec bins. Red curve is a Poisson curve with rate = median count rate of data. |
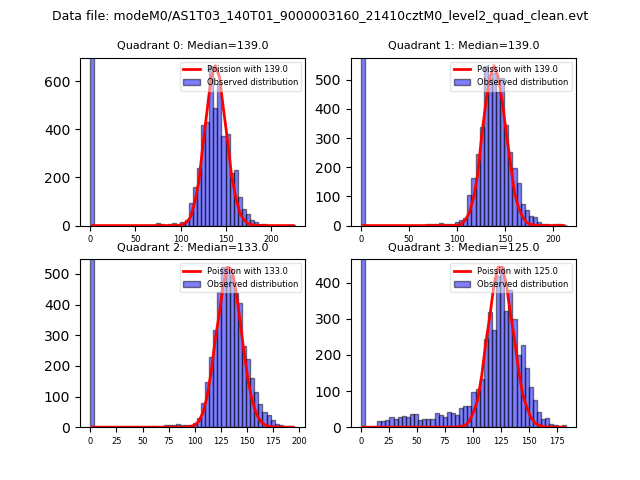 |
 |
| Quadrant-wise count rates Data is divided into 100 sec bins |
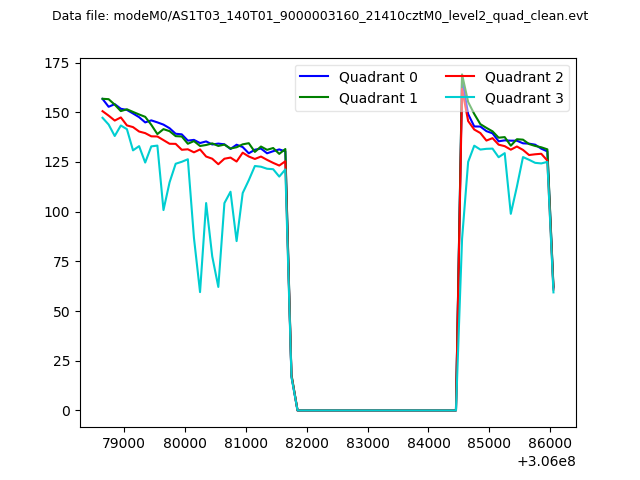 |
|
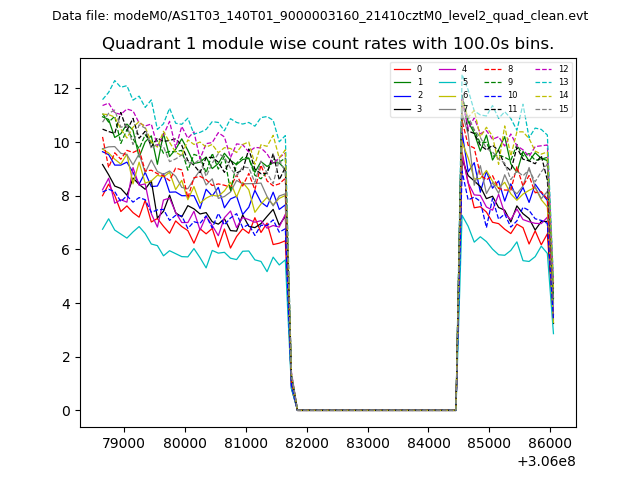
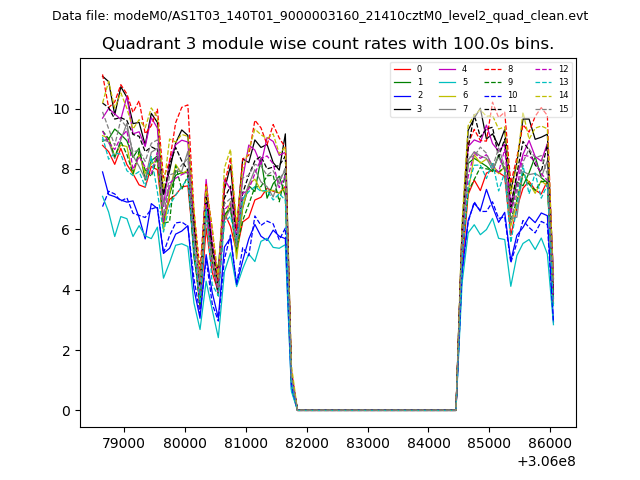
| Module-wise count rates for Quadrant A Data is divided into 100 sec bins |
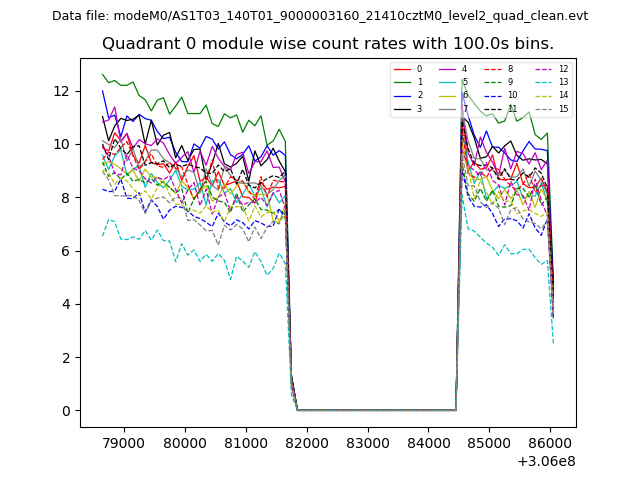 |
 |
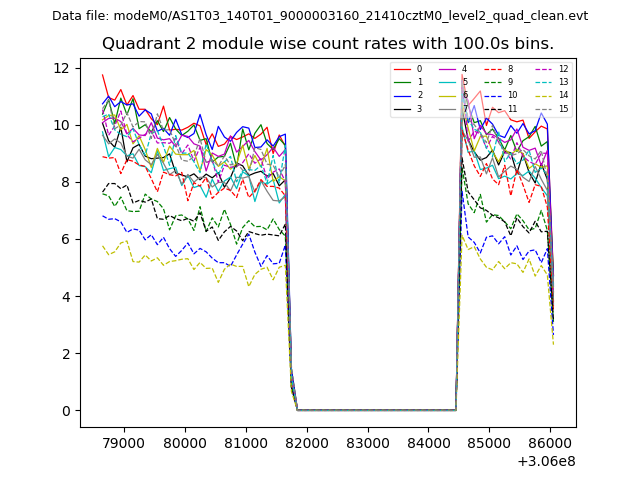
| Module-wise count rates for Quadrant B Data is divided into 100 sec bins |
 |
 |
| Module-wise count rates for Quadrant C Data is divided into 100 sec bins |
 |
 |
| Module-wise count rates for Quadrant D Data is divided into 100 sec bins |
 |
 |
| Parameter | Plot |
|---|---|
| CZT HV Monitor | 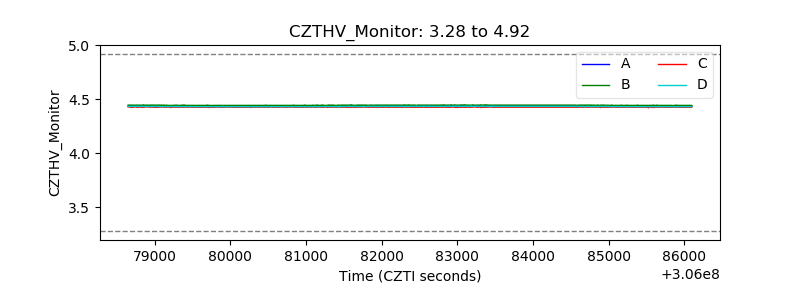 |
| D_VDD | 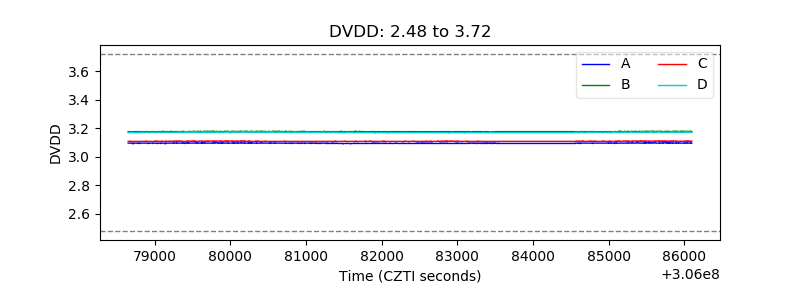 |
| Temperature 1 | 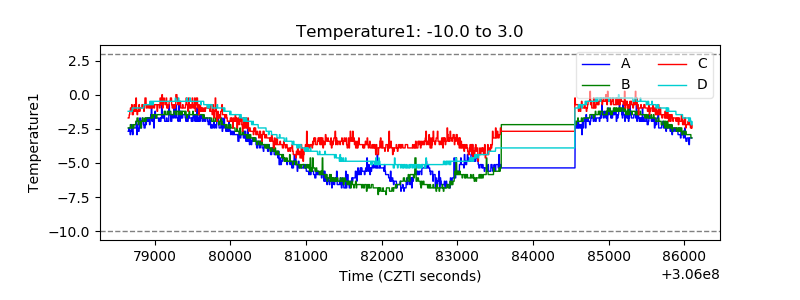 |
| Veto HV Monitor | 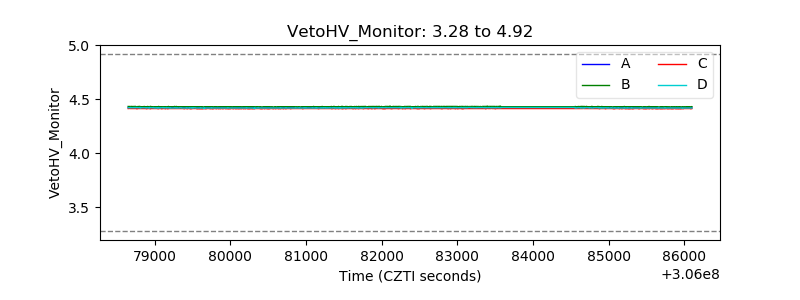 |
| Veto LLD | 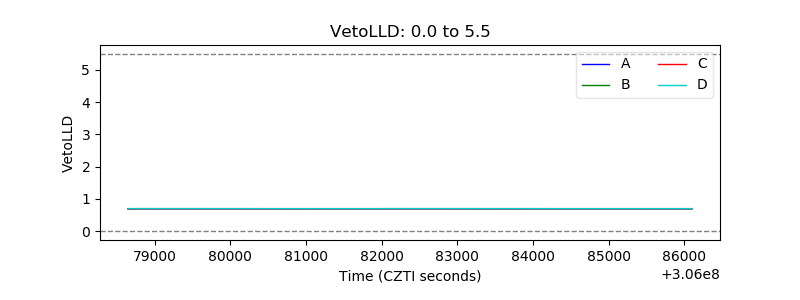 |
| Alpha Counter | 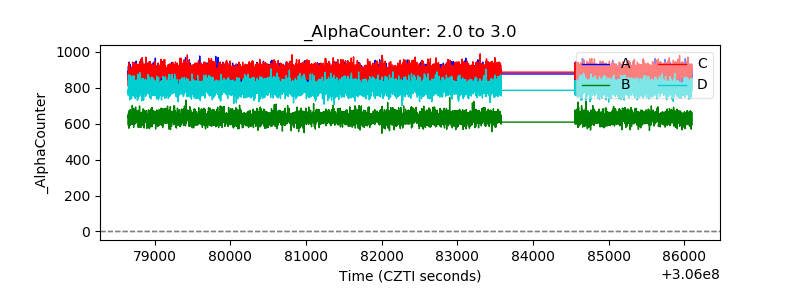 |
| _CPM_Rate | 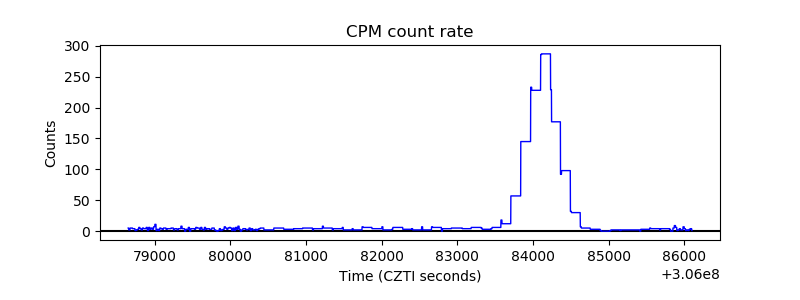 |
| CZT Counter | 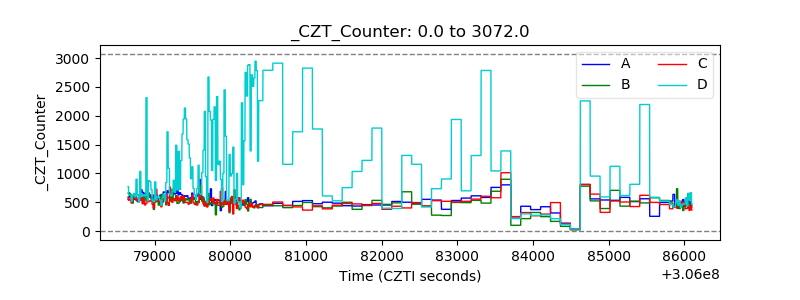 |
| +2.5 Volts monitor |  |
| +5 Volts monitor |  |
| _ROLL_ROT | 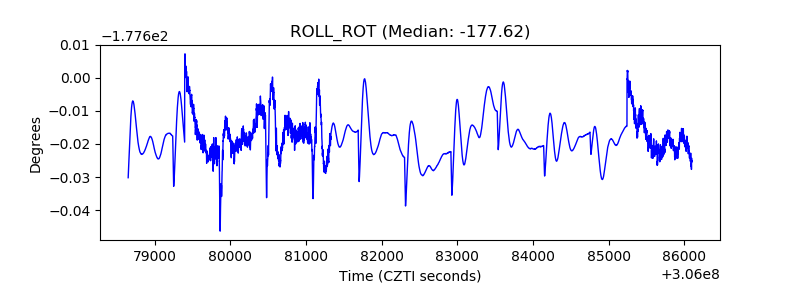 |
| _Roll_DEC | 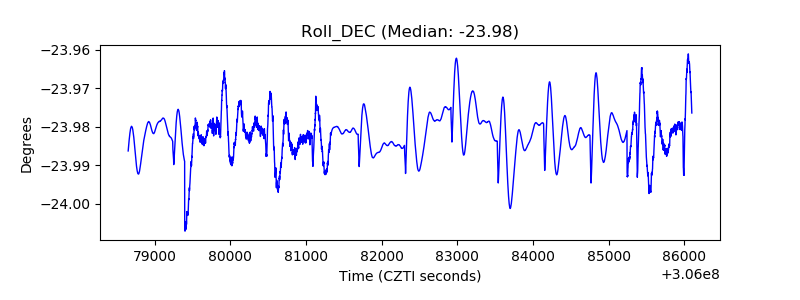 |
| _Roll_RA | 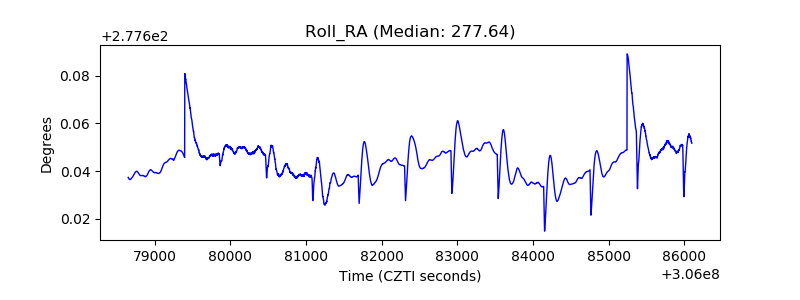 |
| Veto Counter | 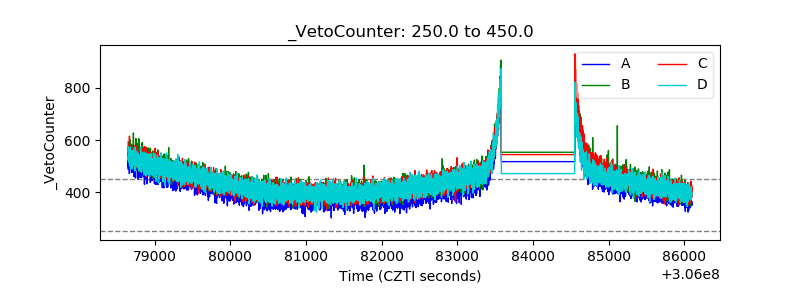 |