| Param | Original file | Final file |
|---|---|---|
| Filename | modeM0/AS1T03_140T01_9000003160_21411cztM0_level2.evt | modeM0/AS1T03_140T01_9000003160_21411cztM0_level2_quad_clean.evt |
| Size (bytes) | 541,261,440 | 101,044,800 |
| Size | 516.2 MB | 96.4 MB |
| Events in quadrant A | 3,644,474 | 659,205 |
| Events in quadrant B | 3,606,524 | 663,233 |
| Events in quadrant C | 3,446,827 | 638,672 |
| Events in quadrant D | 5,211,618 | 603,156 |
| Mode SS | |||
|---|---|---|---|
| Quadrant | BADHDUFLAG | Total packets | Discarded packets |
| A | 0 | 146 | 0 |
| B | 0 | 146 | 0 |
| C | 0 | 146 | 0 |
| D | 0 | 146 | 0 |
| Mode M0 | |||
|---|---|---|---|
| Quadrant | BADHDUFLAG | Total packets | Discarded packets |
| A | 0 | 15070 | 2 |
| B | 0 | 15204 | 2 |
| C | 0 | 14851 | 2 |
| D | 0 | 20314 | 2 |
| Mode M9 | |||
|---|---|---|---|
| Quadrant | BADHDUFLAG | Total packets | Discarded packets |
| A | 0 | 8 | 0 |
| B | 0 | 9 | 0 |
| C | 0 | 9 | 0 |
| D | 0 | 9 | 0 |
| Quadrant | Total seconds | Saturated seconds | Saturation percentage |
|---|---|---|---|
| A | 7111 | 69 | 0.970328% |
| B | 7110 | 83 | 1.167370% |
| C | 7110 | 105 | 1.476793% |
| D | 7110 | 383 | 5.386779% |
Noise dominated data is calculated using 1-second bins in cleaned event files. If a bin has >2000 counts, and if more than 50% of those come from <1% of pixels, then it is considered to be noise-dominated and hence unusable.
| Quadrant | # 1 sec bins | Bins with >0 counts | Bins with >2000 counts | High rate bins dominated by noise | Noise dominated (total time) | Noise dominated (detector-on time) | Marked lightcurve |
|---|---|---|---|---|---|---|---|
| A | 7746 | 7112 | 0 | 0 | 0.00% | 0.00% | 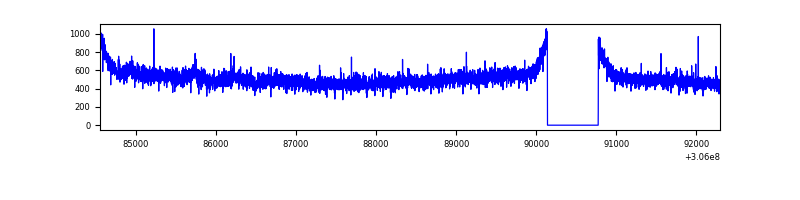 |
| B | 7745 | 7111 | 4 | 4 | 0.05% | 0.06% | 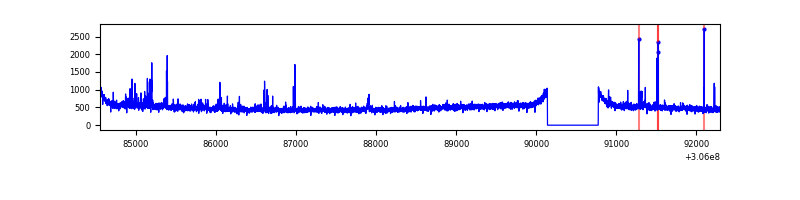 |
| C | 7745 | 7110 | 0 | 0 | 0.00% | 0.00% | 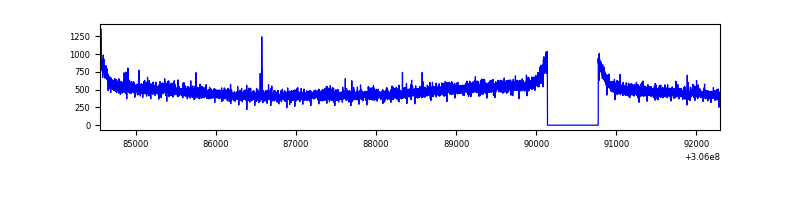 |
| D | 7745 | 7111 | 280 | 280 | 3.62% | 3.94% | 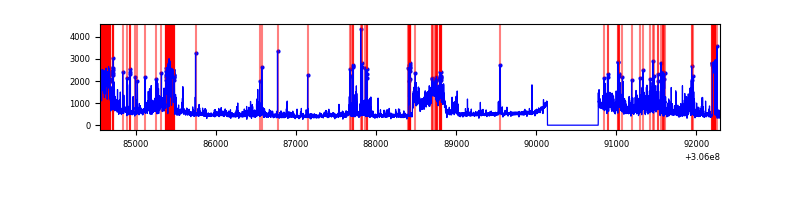 |
Top three noisy pixels from each quadrant. If the there are fewer than three noisy pixels in the level2.evt file, extra rows are filled as -1
| Pixel properties | Quadrant properties | ||||||
|---|---|---|---|---|---|---|---|
| Quadrant | DetID | PixID | Counts | Sigma | Mean | Median | Sigma |
| A | 5 | 168 | 206510 | 1148.47 | 888 | 872 | 179.1 |
| A | 11 | 47 | 10456 | 53.53 | 888 | 872 | 179.1 |
| A | 13 | 254 | 9994 | 50.95 | 888 | 872 | 179.1 |
| B | 0 | 230 | 47802 | 280.08 | 880 | 858 | 167.6 |
| B | 0 | 189 | 43504 | 254.43 | 880 | 858 | 167.6 |
| B | 0 | 190 | 26654 | 153.9 | 880 | 858 | 167.6 |
| C | 14 | 238 | 131661 | 661.64 | 841 | 847 | 197.7 |
| C | 3 | 233 | 34610 | 170.77 | 841 | 847 | 197.7 |
| C | 13 | 61 | 5846 | 25.28 | 841 | 847 | 197.7 |
| D | 13 | 174 | 485586 | 2362.68 | 836 | 812 | 205.2 |
| D | 12 | 235 | 401199 | 1951.4 | 836 | 812 | 205.2 |
| D | 7 | 38 | 397971 | 1935.67 | 836 | 812 | 205.2 |
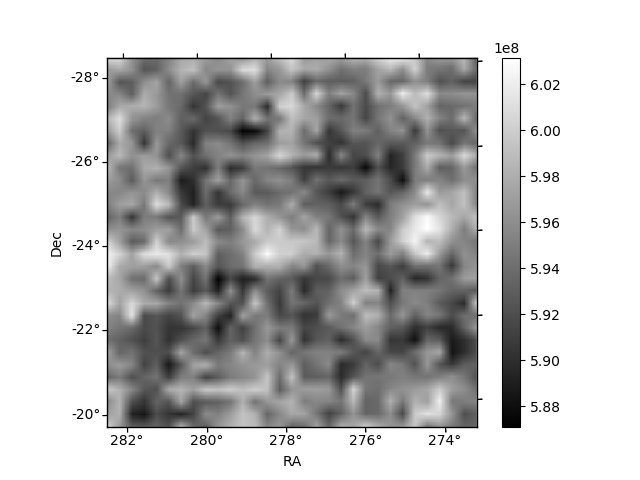
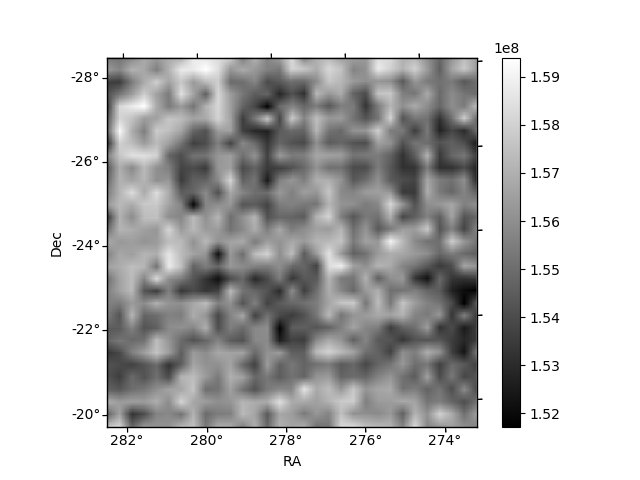
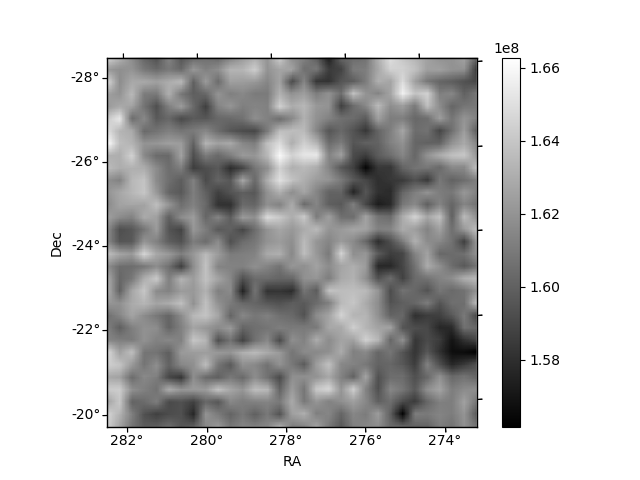
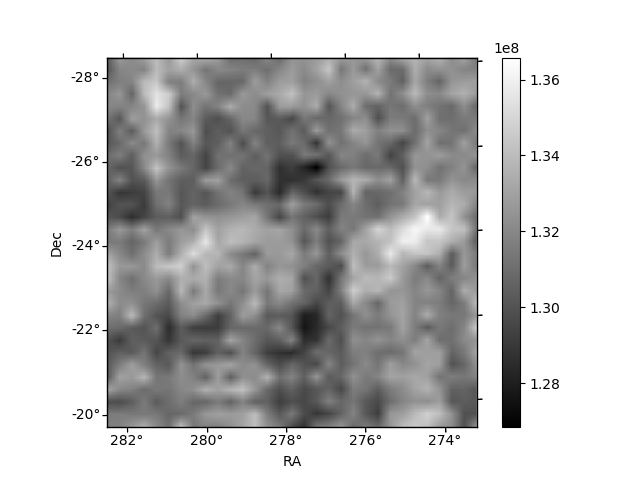
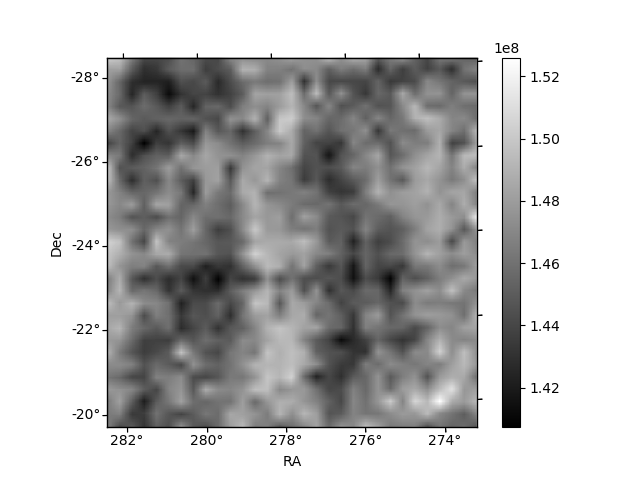
Histogram calculated using DETX and DETY for each event in the final _common_clean file
| Quadrant A | 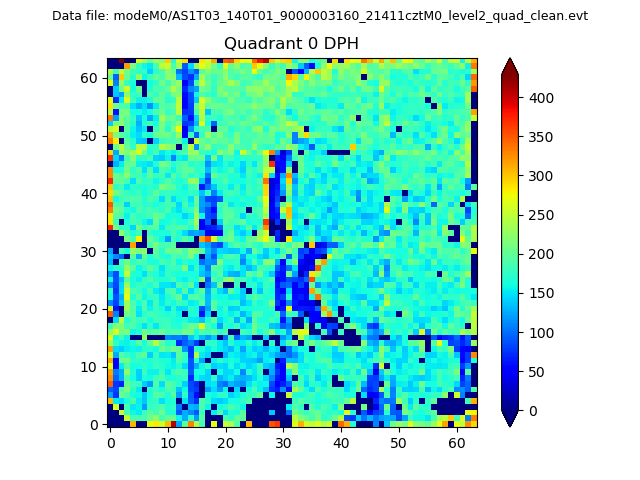 |
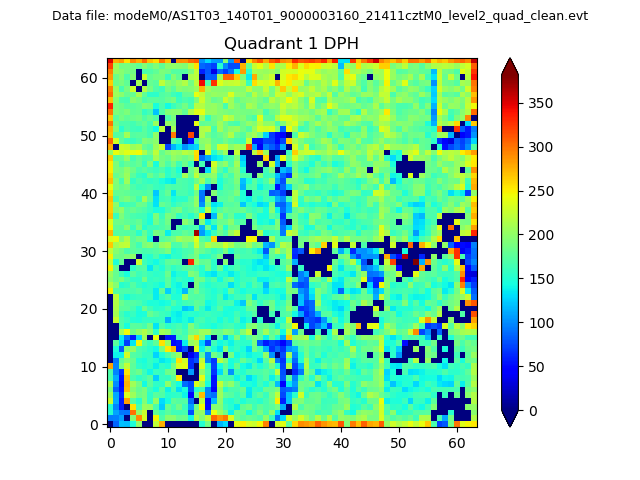 |
Quadrant B |
|---|---|---|---|
| Quadrant D | 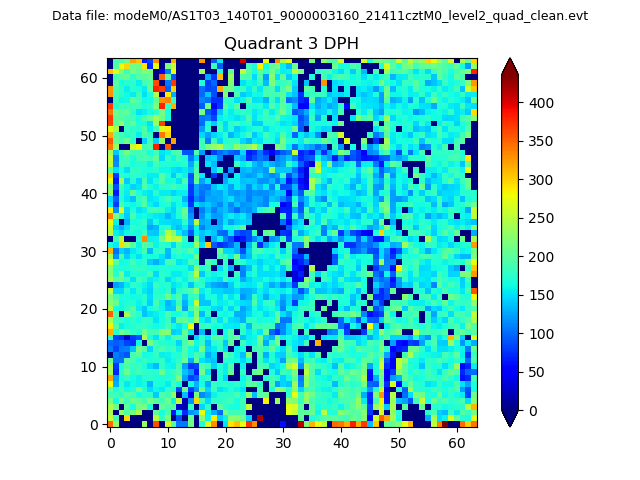 |
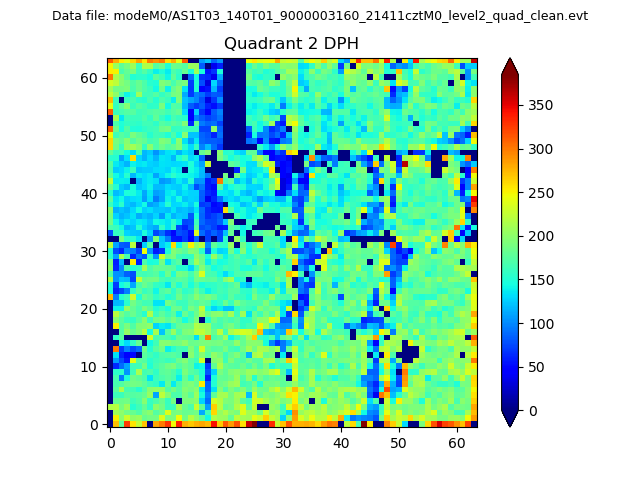 |
Quadrant C |
| Plot type | Count rate plots | Images |
|---|---|---|
| Comparison with Poisson distribution Blue bars denote a histogram of data divided into 1 sec bins. Red curve is a Poisson curve with rate = median count rate of data. |
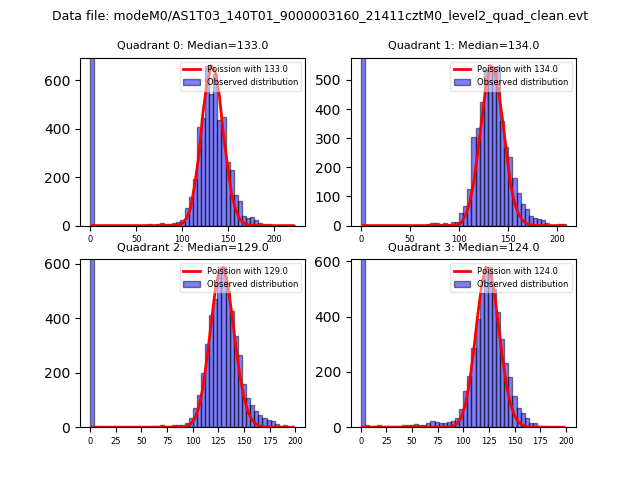 |
 |
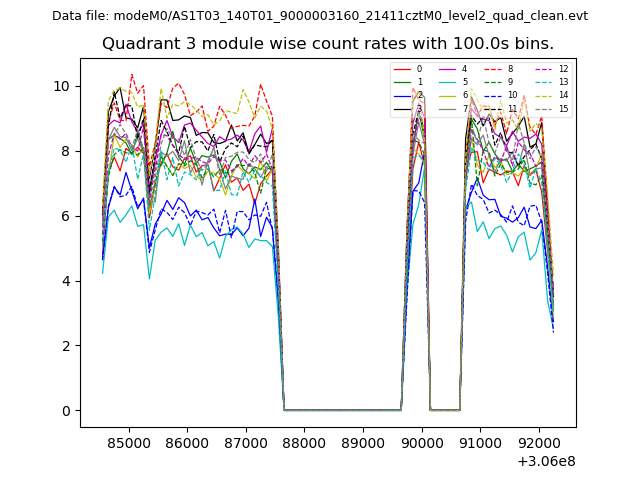
| Quadrant-wise count rates Data is divided into 100 sec bins |
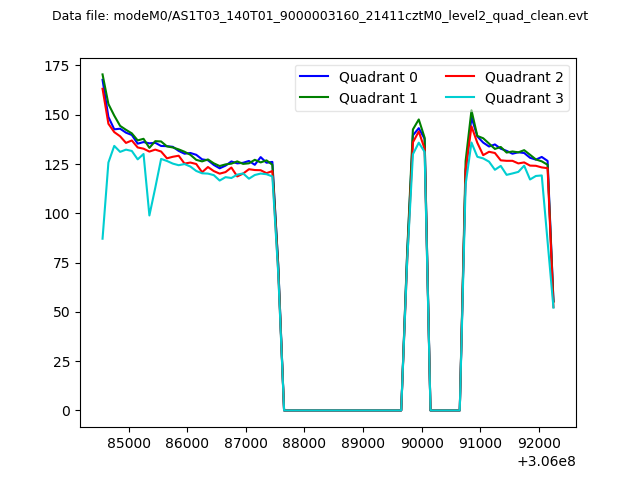 |
|
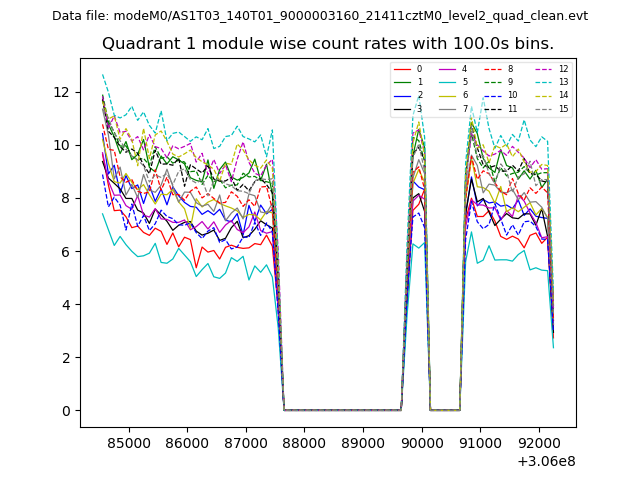
| Module-wise count rates for Quadrant A Data is divided into 100 sec bins |
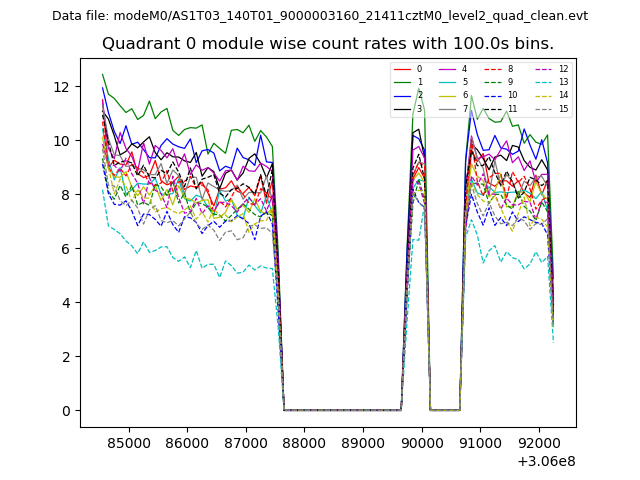 |
 |
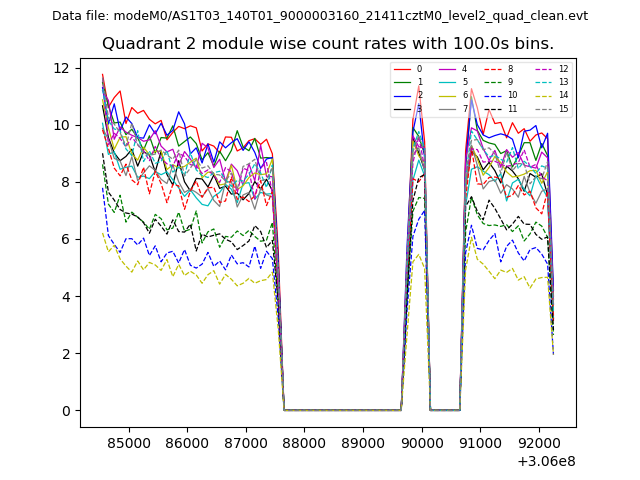
| Module-wise count rates for Quadrant B Data is divided into 100 sec bins |
 |
 |
| Module-wise count rates for Quadrant C Data is divided into 100 sec bins |
 |
 |
| Module-wise count rates for Quadrant D Data is divided into 100 sec bins |
 |
 |
| Parameter | Plot |
|---|---|
| CZT HV Monitor | 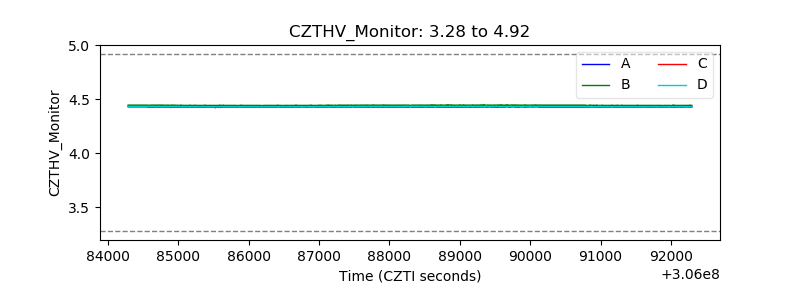 |
| D_VDD | 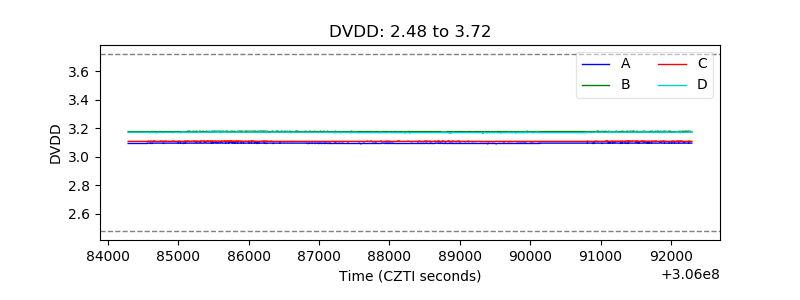 |
| Temperature 1 | 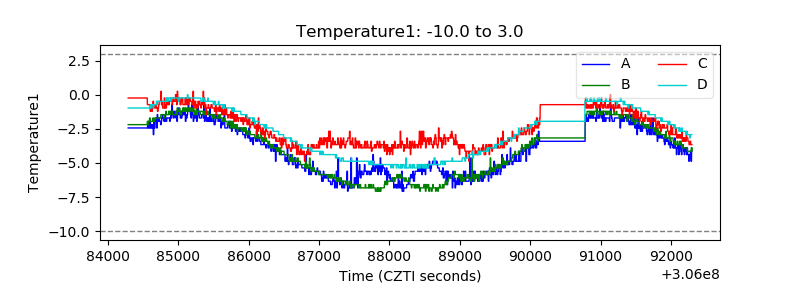 |
| Veto HV Monitor | 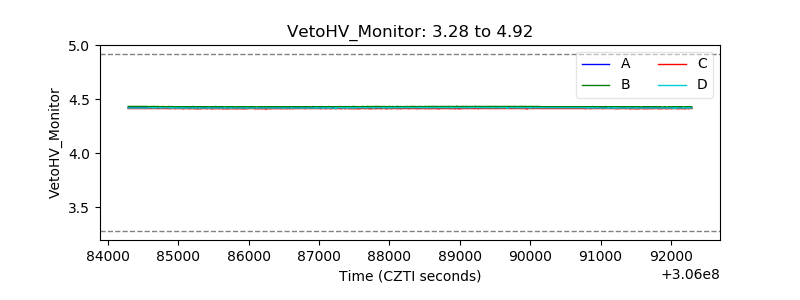 |
| Veto LLD | 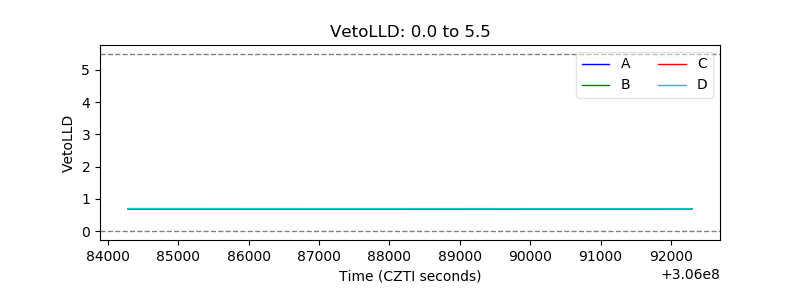 |
| Alpha Counter | 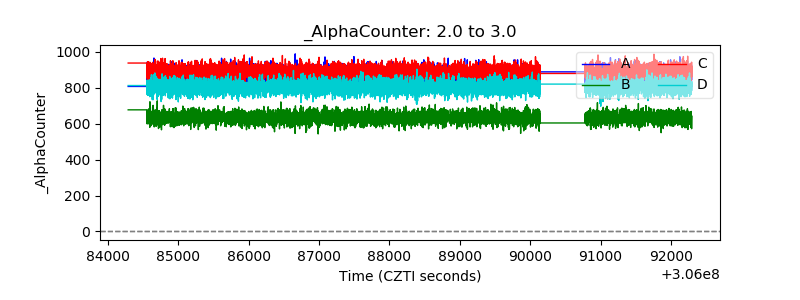 |
| _CPM_Rate | 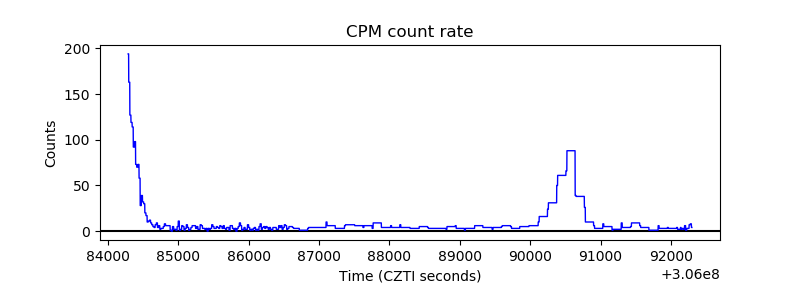 |
| CZT Counter | 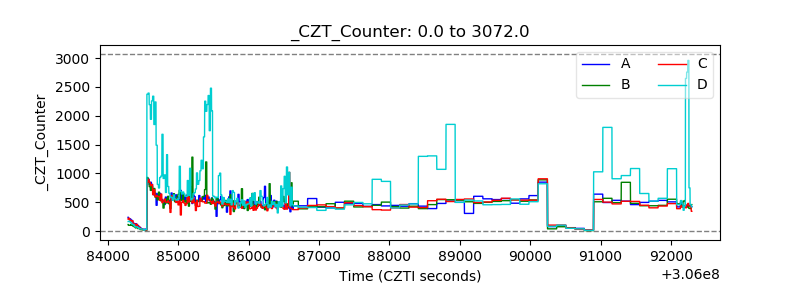 |
| +2.5 Volts monitor |  |
| +5 Volts monitor |  |
| _ROLL_ROT | 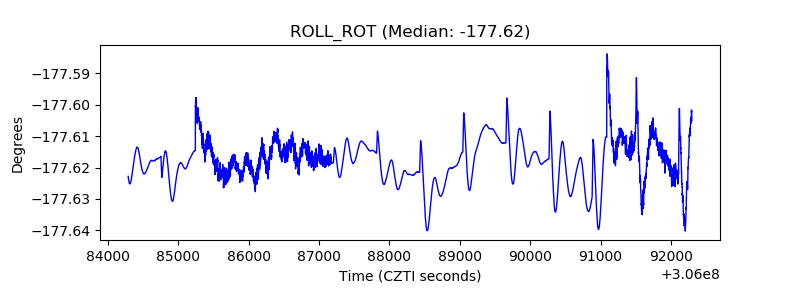 |
| _Roll_DEC | 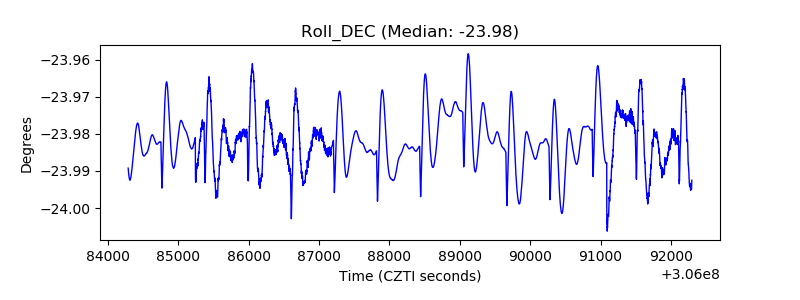 |
| _Roll_RA |  |
| Veto Counter | 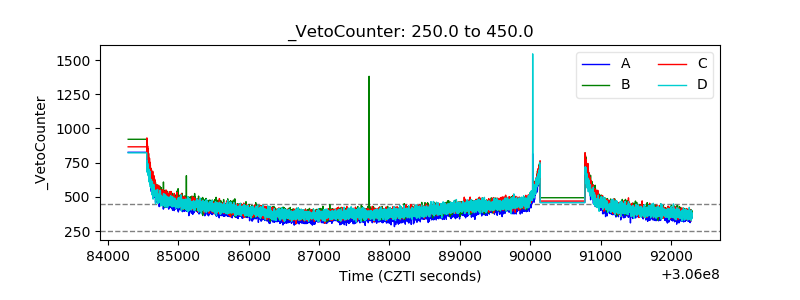 |