| Param | Original file | Final file |
|---|---|---|
| Filename | modeM0/AS1T03_140T01_9000003160_21412cztM0_level2.evt | modeM0/AS1T03_140T01_9000003160_21412cztM0_level2_quad_clean.evt |
| Size (bytes) | 517,867,200 | 102,012,480 |
| Size | 493.9 MB | 97.3 MB |
| Events in quadrant A | 3,499,115 | 658,765 |
| Events in quadrant B | 3,676,376 | 662,214 |
| Events in quadrant C | 3,638,426 | 641,540 |
| Events in quadrant D | 4,377,562 | 622,334 |
| Mode SS | |||
|---|---|---|---|
| Quadrant | BADHDUFLAG | Total packets | Discarded packets |
| A | 0 | 148 | 0 |
| B | 0 | 148 | 0 |
| C | 0 | 148 | 0 |
| D | 0 | 148 | 0 |
| Mode M0 | |||
|---|---|---|---|
| Quadrant | BADHDUFLAG | Total packets | Discarded packets |
| A | 0 | 15009 | 1 |
| B | 0 | 15616 | 1 |
| C | 0 | 15512 | 1 |
| D | 0 | 17862 | 1 |
| Mode M9 | |||
|---|---|---|---|
| Quadrant | BADHDUFLAG | Total packets | Discarded packets |
| A | 0 | 3 | 0 |
| B | 0 | 3 | 0 |
| C | 0 | 3 | 0 |
| D | 0 | 3 | 0 |
| Quadrant | Total seconds | Saturated seconds | Saturation percentage |
|---|---|---|---|
| A | 7246 | 31 | 0.427822% |
| B | 7246 | 91 | 1.255865% |
| C | 7246 | 86 | 1.186862% |
| D | 7247 | 151 | 2.083621% |
Noise dominated data is calculated using 1-second bins in cleaned event files. If a bin has >2000 counts, and if more than 50% of those come from <1% of pixels, then it is considered to be noise-dominated and hence unusable.
| Quadrant | # 1 sec bins | Bins with >0 counts | Bins with >2000 counts | High rate bins dominated by noise | Noise dominated (total time) | Noise dominated (detector-on time) | Marked lightcurve |
|---|---|---|---|---|---|---|---|
| A | 7581 | 7247 | 0 | 0 | 0.00% | 0.00% |  |
| B | 7581 | 7247 | 26 | 26 | 0.34% | 0.36% |  |
| C | 7581 | 7247 | 1 | 1 | 0.01% | 0.01% |  |
| D | 7582 | 7248 | 121 | 121 | 1.60% | 1.67% |  |
Top three noisy pixels from each quadrant. If the there are fewer than three noisy pixels in the level2.evt file, extra rows are filled as -1
| Pixel properties | Quadrant properties | ||||||
|---|---|---|---|---|---|---|---|
| Quadrant | DetID | PixID | Counts | Sigma | Mean | Median | Sigma |
| A | 5 | 168 | 87519 | 484.28 | 883 | 866 | 178.9 |
| A | 13 | 254 | 10721 | 55.08 | 883 | 866 | 178.9 |
| A | 0 | 226 | 7657 | 37.95 | 883 | 866 | 178.9 |
| B | 3 | 64 | 71693 | 416.98 | 876 | 853 | 169.9 |
| B | 0 | 189 | 70005 | 407.04 | 876 | 853 | 169.9 |
| B | 0 | 228 | 46890 | 270.98 | 876 | 853 | 169.9 |
| C | 3 | 233 | 222510 | 1127.64 | 838 | 844 | 196.6 |
| C | 14 | 238 | 132517 | 669.84 | 838 | 844 | 196.6 |
| C | 10 | 91 | 13462 | 64.19 | 838 | 844 | 196.6 |
| D | 12 | 235 | 381674 | 1851.48 | 847 | 821 | 205.7 |
| D | 7 | 38 | 209131 | 1012.68 | 847 | 821 | 205.7 |
| D | 1 | 20 | 116383 | 561.79 | 847 | 821 | 205.7 |
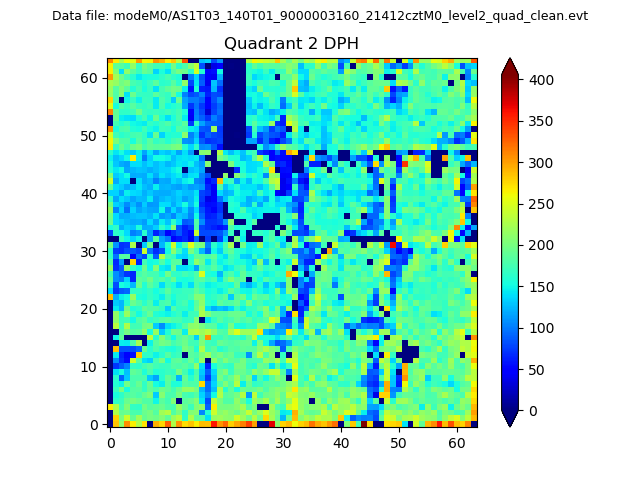
Histogram calculated using DETX and DETY for each event in the final _common_clean file
| Quadrant A | 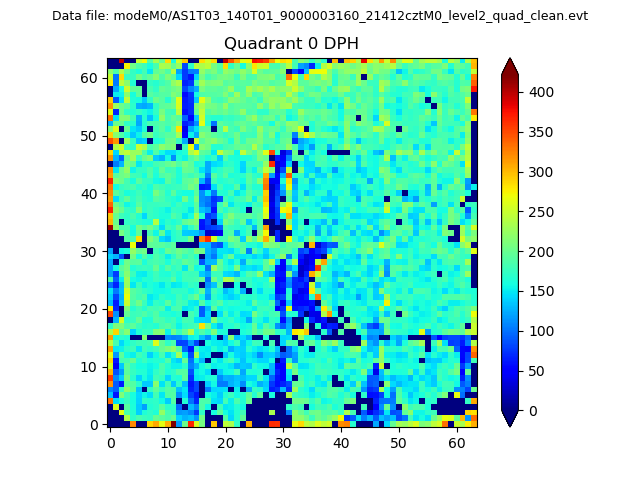 |
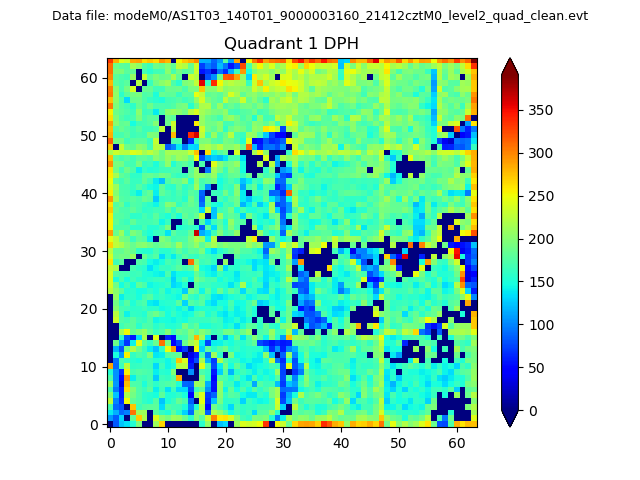 |
Quadrant B |
|---|---|---|---|
| Quadrant D | 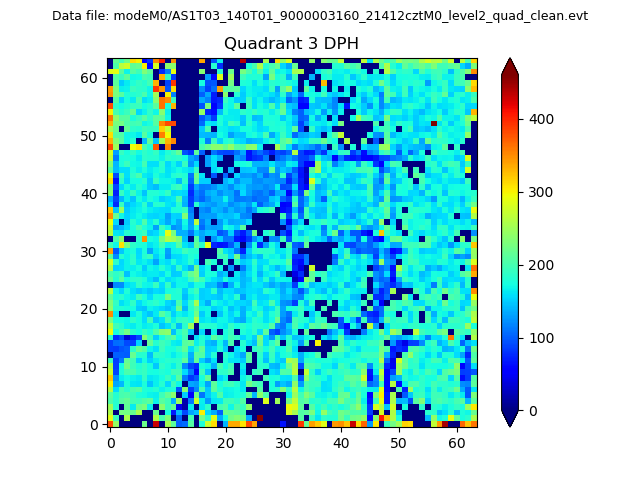 |
 |
Quadrant C |
| Plot type | Count rate plots | Images |
|---|---|---|
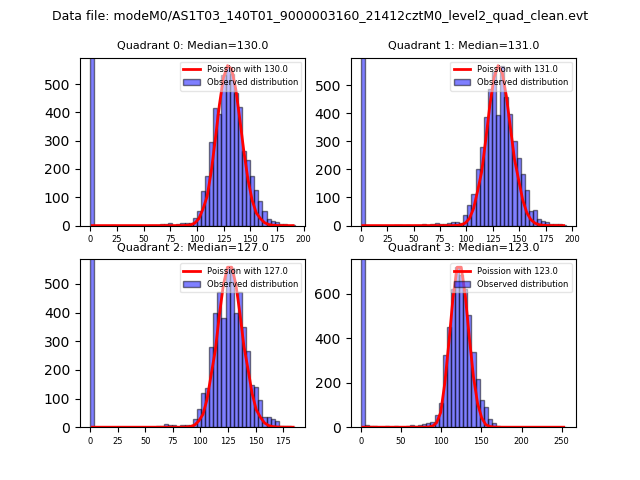
| Comparison with Poisson distribution Blue bars denote a histogram of data divided into 1 sec bins. Red curve is a Poisson curve with rate = median count rate of data. |
 |
 |
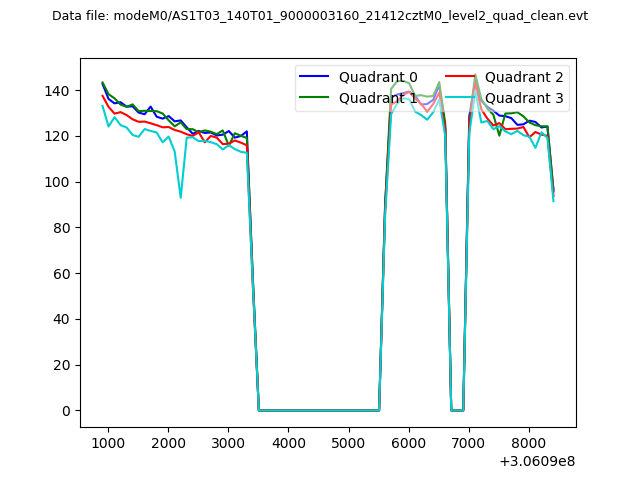
| Quadrant-wise count rates Data is divided into 100 sec bins |
 |
|
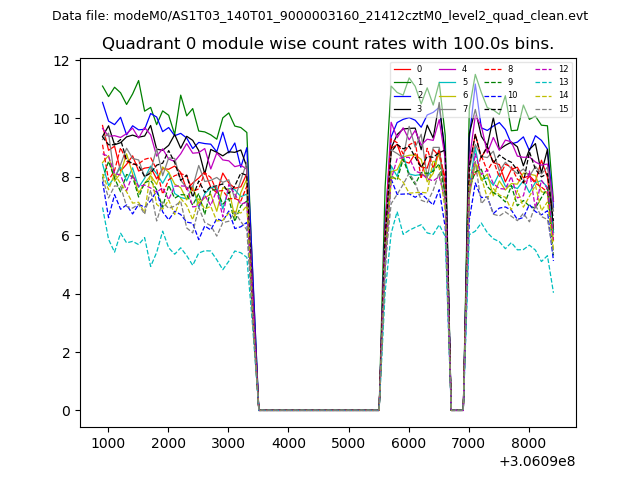
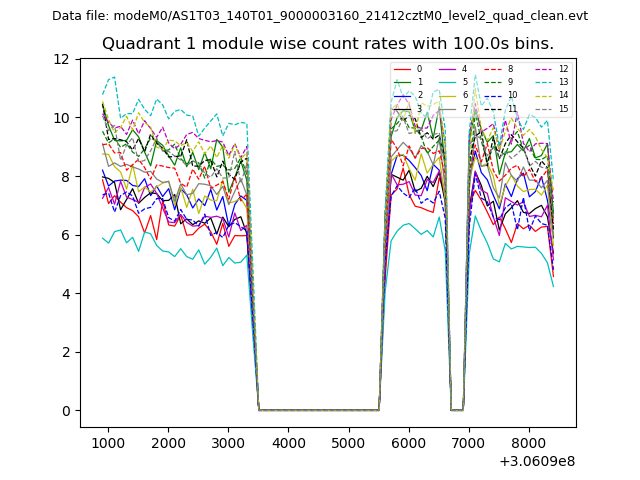
| Module-wise count rates for Quadrant A Data is divided into 100 sec bins |
 |
 |
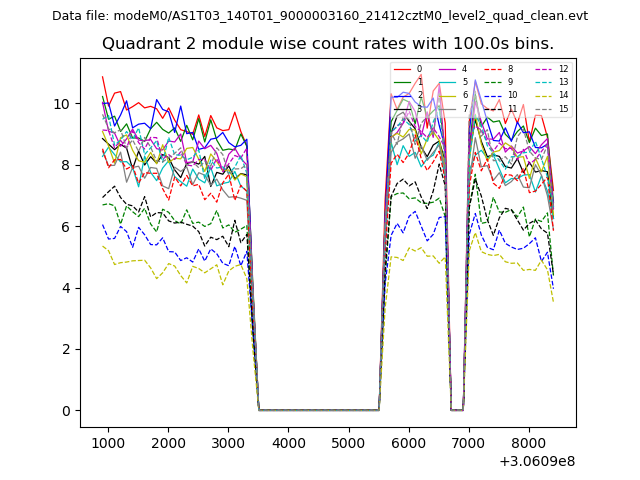
| Module-wise count rates for Quadrant B Data is divided into 100 sec bins |
 |
 |
| Module-wise count rates for Quadrant C Data is divided into 100 sec bins |
 |
 |
| Module-wise count rates for Quadrant D Data is divided into 100 sec bins |
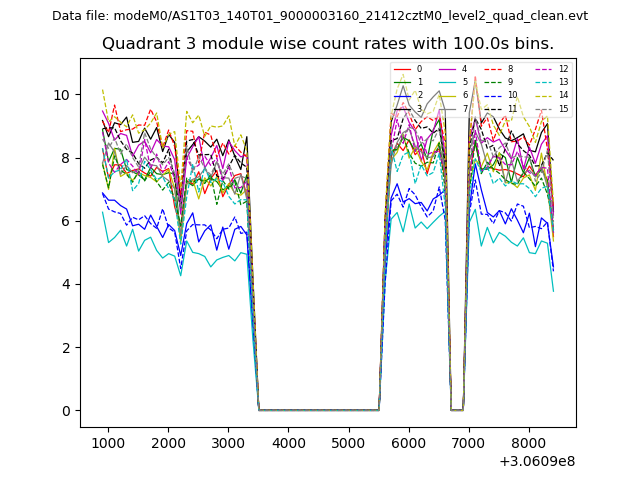 |
 |
| Parameter | Plot |
|---|---|
| CZT HV Monitor | 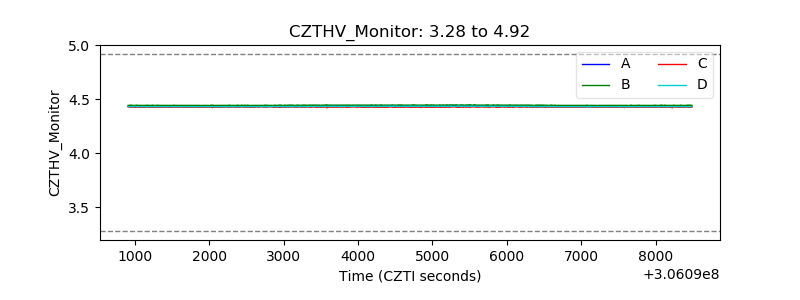 |
| D_VDD | 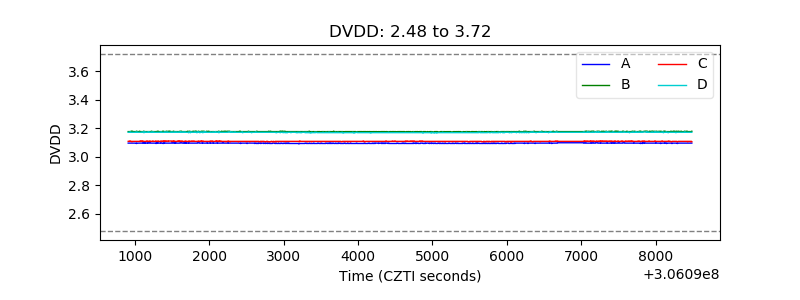 |
| Temperature 1 | 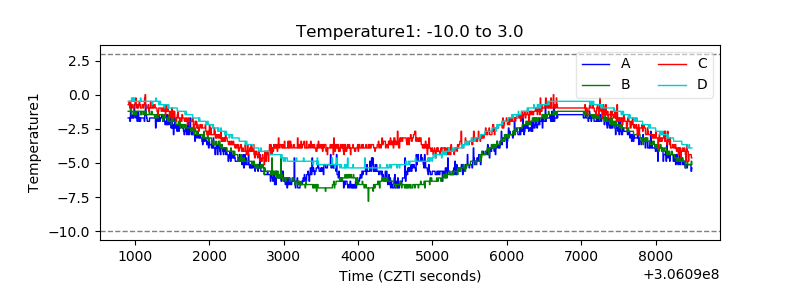 |
| Veto HV Monitor | 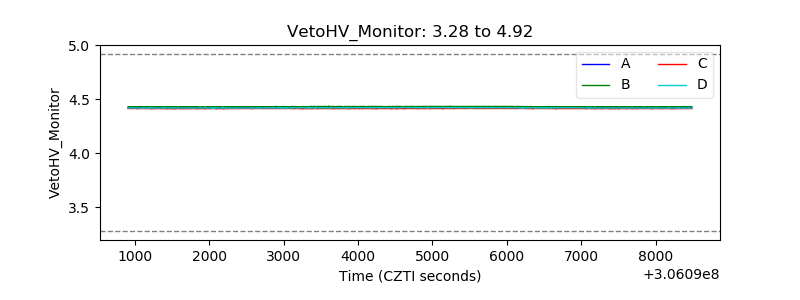 |
| Veto LLD | 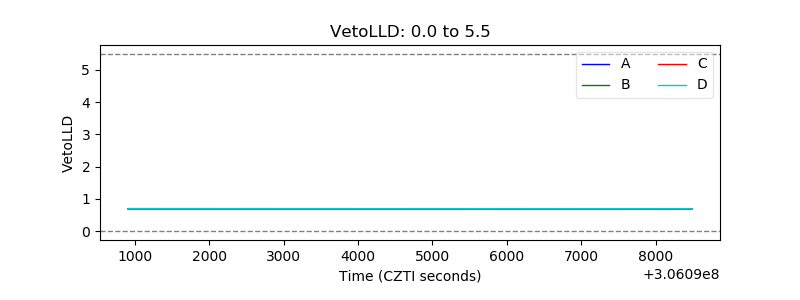 |
| Alpha Counter | 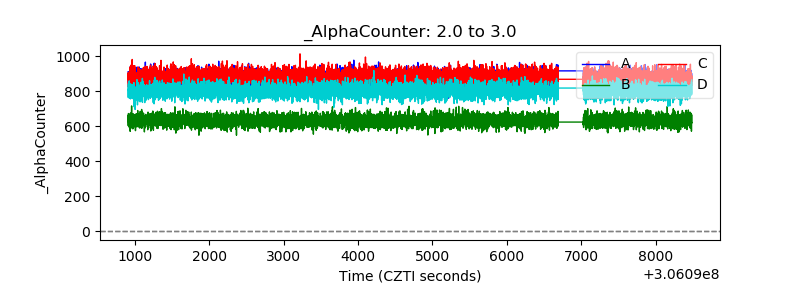 |
| _CPM_Rate | 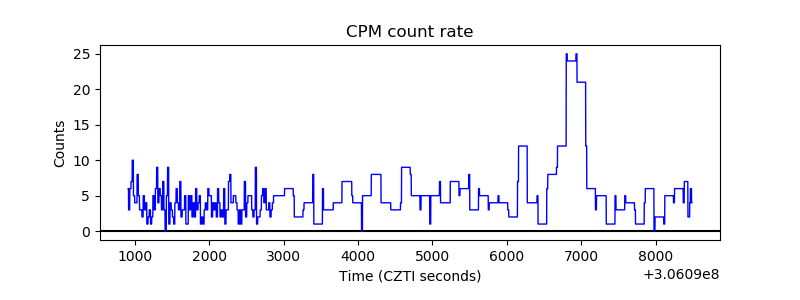 |
| CZT Counter | 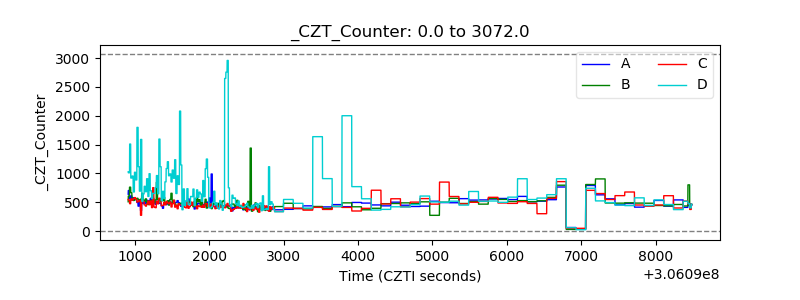 |
| +2.5 Volts monitor |  |
| +5 Volts monitor | 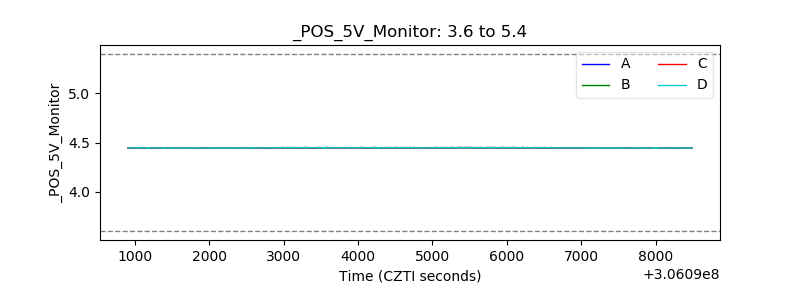 |
| _ROLL_ROT | 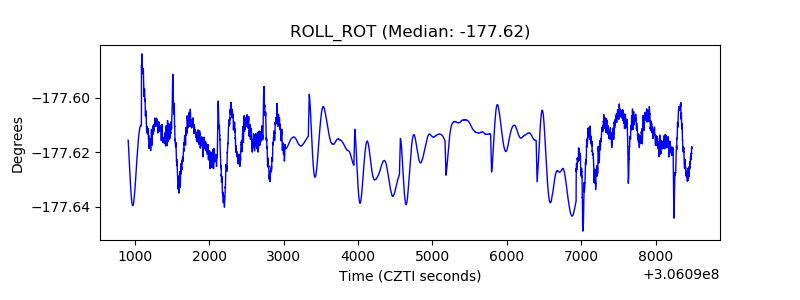 |
| _Roll_DEC | 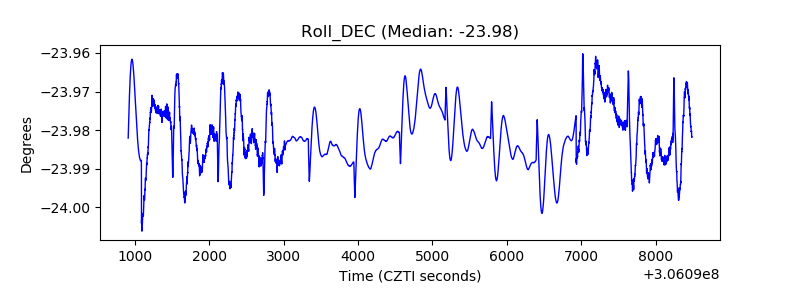 |
| _Roll_RA | 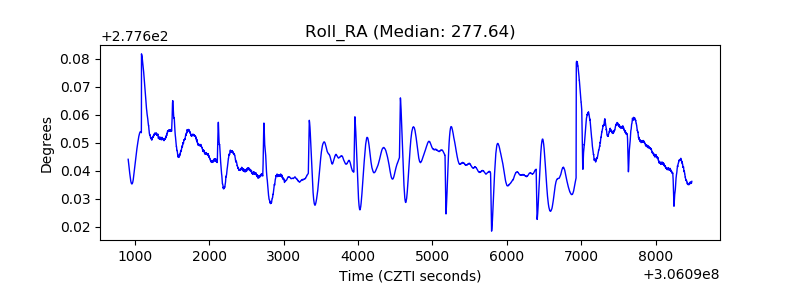 |
| Veto Counter | 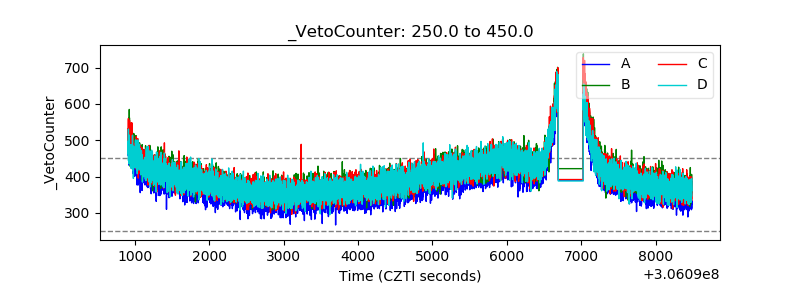 |