| Param | Original file | Final file |
|---|---|---|
| Filename | modeM0/AS1T03_140T01_9000003160_21413cztM0_level2.evt | modeM0/AS1T03_140T01_9000003160_21413cztM0_level2_quad_clean.evt |
| Size (bytes) | 540,316,800 | 106,790,400 |
| Size | 515.3 MB | 101.8 MB |
| Events in quadrant A | 3,687,099 | 688,872 |
| Events in quadrant B | 3,761,018 | 696,639 |
| Events in quadrant C | 4,373,584 | 665,678 |
| Events in quadrant D | 4,030,814 | 658,988 |
| Mode SS | |||
|---|---|---|---|
| Quadrant | BADHDUFLAG | Total packets | Discarded packets |
| A | 0 | 156 | 0 |
| B | 0 | 156 | 0 |
| C | 0 | 156 | 0 |
| D | 0 | 156 | 0 |
| Mode M0 | |||
|---|---|---|---|
| Quadrant | BADHDUFLAG | Total packets | Discarded packets |
| A | 0 | 15720 | 2 |
| B | 0 | 16099 | 2 |
| C | 0 | 18190 | 2 |
| D | 0 | 17117 | 2 |
| Mode M9 | |||
|---|---|---|---|
| Quadrant | BADHDUFLAG | Total packets | Discarded packets |
| A | 0 | 6 | 0 |
| B | 0 | 6 | 0 |
| C | 0 | 6 | 0 |
| D | 0 | 6 | 0 |
| Quadrant | Total seconds | Saturated seconds | Saturation percentage |
|---|---|---|---|
| A | 7525 | 50 | 0.664452% |
| B | 7525 | 110 | 1.461794% |
| C | 7526 | 249 | 3.308530% |
| D | 7526 | 100 | 1.328727% |
Noise dominated data is calculated using 1-second bins in cleaned event files. If a bin has >2000 counts, and if more than 50% of those come from <1% of pixels, then it is considered to be noise-dominated and hence unusable.
| Quadrant | # 1 sec bins | Bins with >0 counts | Bins with >2000 counts | High rate bins dominated by noise | Noise dominated (total time) | Noise dominated (detector-on time) | Marked lightcurve |
|---|---|---|---|---|---|---|---|
| A | 8230 | 7527 | 0 | 0 | 0.00% | 0.00% | 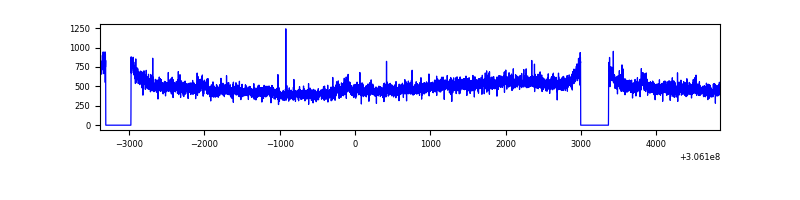 |
| B | 8230 | 7526 | 28 | 28 | 0.34% | 0.37% | 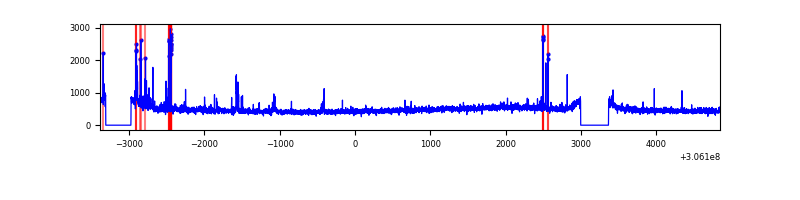 |
| C | 8231 | 7528 | 46 | 46 | 0.56% | 0.61% | 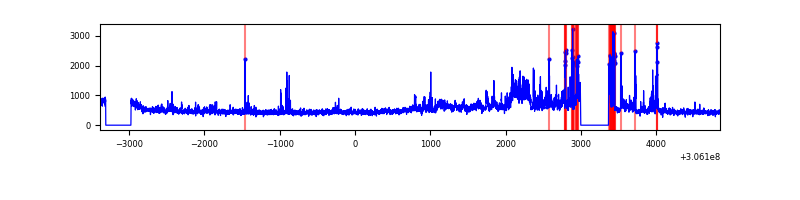 |
| D | 8231 | 7527 | 49 | 49 | 0.60% | 0.65% | 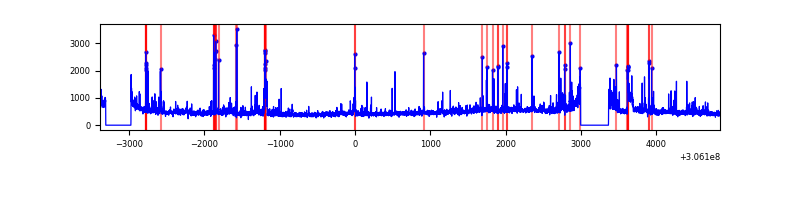 |
Top three noisy pixels from each quadrant. If the there are fewer than three noisy pixels in the level2.evt file, extra rows are filled as -1
| Pixel properties | Quadrant properties | ||||||
|---|---|---|---|---|---|---|---|
| Quadrant | DetID | PixID | Counts | Sigma | Mean | Median | Sigma |
| A | 5 | 168 | 151845 | 817.92 | 912 | 895 | 184.6 |
| A | 11 | 47 | 14758 | 75.12 | 912 | 895 | 184.6 |
| A | 13 | 254 | 10094 | 49.84 | 912 | 895 | 184.6 |
| B | 3 | 64 | 83633 | 470.71 | 907 | 883 | 175.8 |
| B | 0 | 189 | 55672 | 311.66 | 907 | 883 | 175.8 |
| B | 0 | 230 | 23562 | 129.01 | 907 | 883 | 175.8 |
| C | 3 | 233 | 862199 | 4259.09 | 862 | 869 | 202.2 |
| C | 14 | 238 | 135336 | 664.91 | 862 | 869 | 202.2 |
| C | 10 | 91 | 16513 | 77.35 | 862 | 869 | 202.2 |
| D | 1 | 52 | 184659 | 858.59 | 880 | 855 | 214.1 |
| D | 12 | 235 | 102952 | 476.92 | 880 | 855 | 214.1 |
| D | 13 | 104 | 100765 | 466.7 | 880 | 855 | 214.1 |
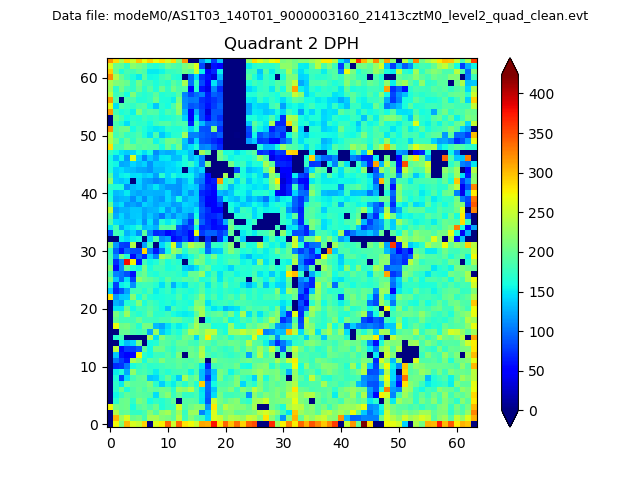
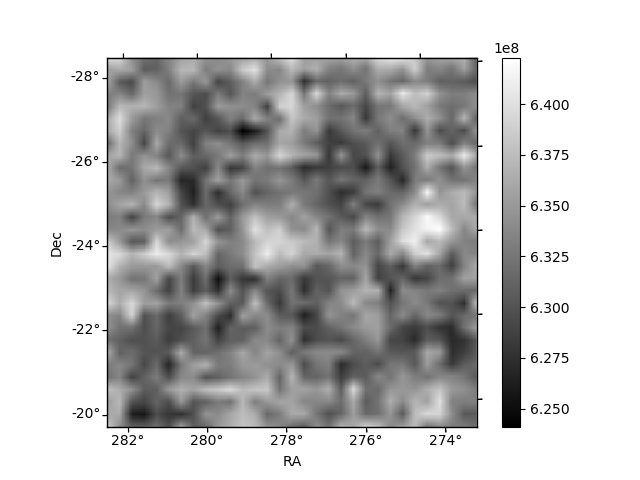
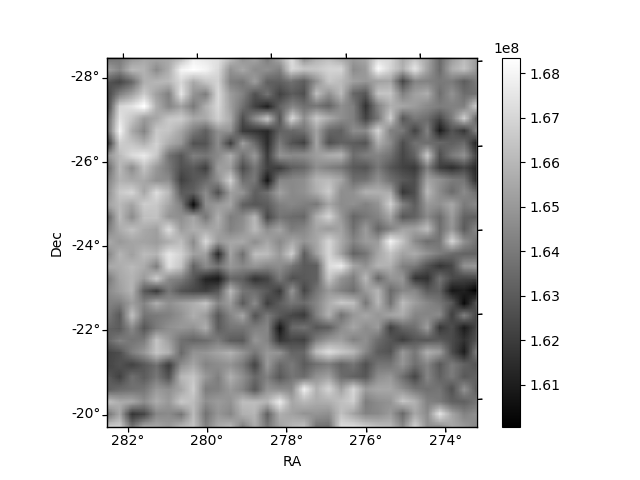
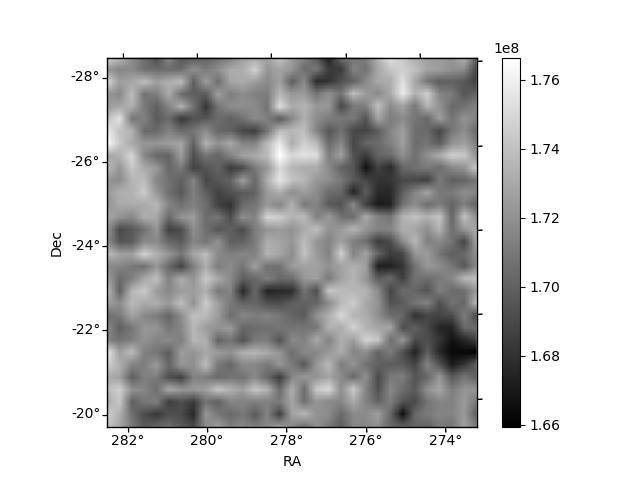
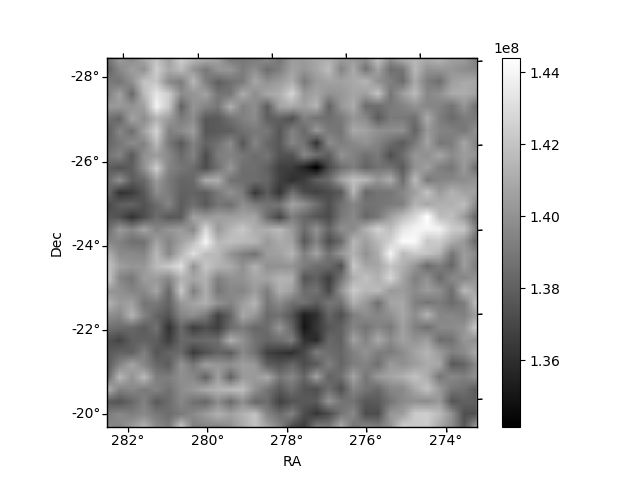
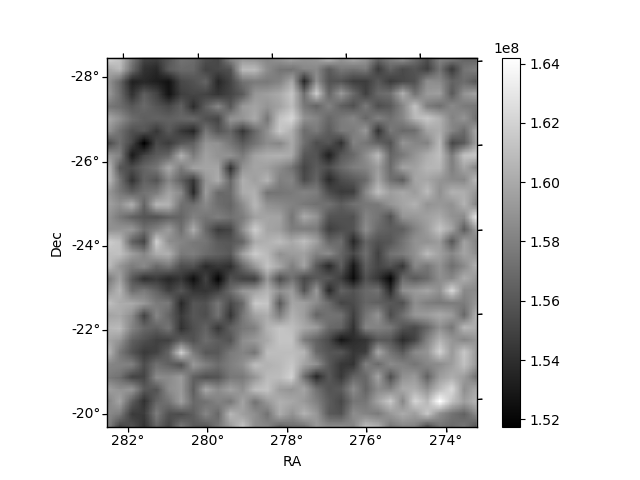
Histogram calculated using DETX and DETY for each event in the final _common_clean file
| Quadrant A | 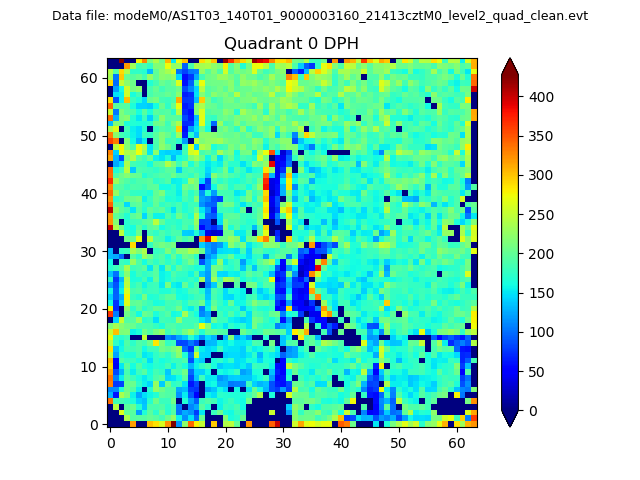 |
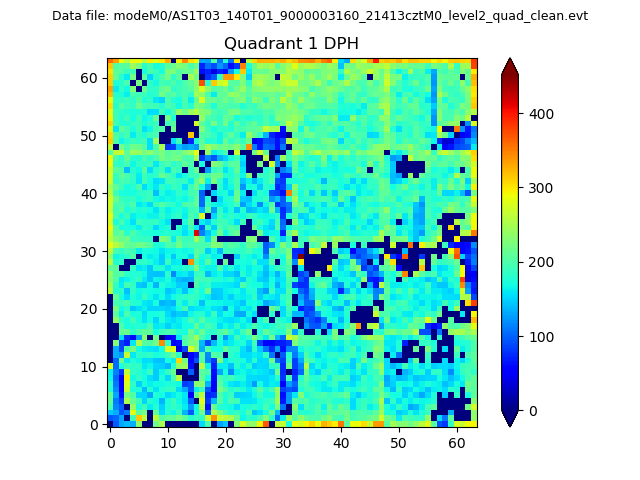 |
Quadrant B |
|---|---|---|---|
| Quadrant D | 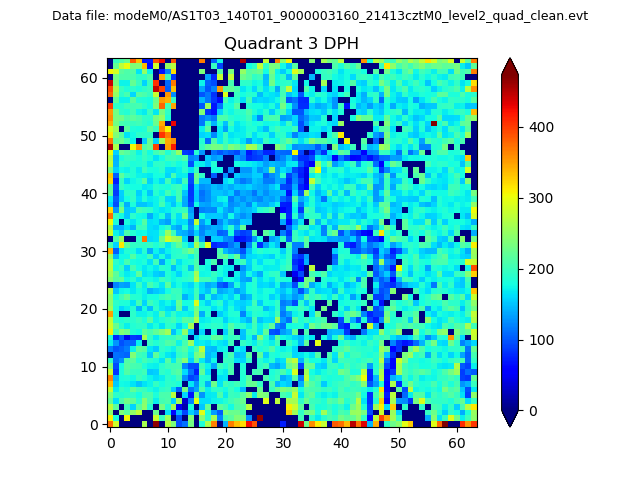 |
 |
Quadrant C |
| Plot type | Count rate plots | Images |
|---|---|---|
| Comparison with Poisson distribution Blue bars denote a histogram of data divided into 1 sec bins. Red curve is a Poisson curve with rate = median count rate of data. |
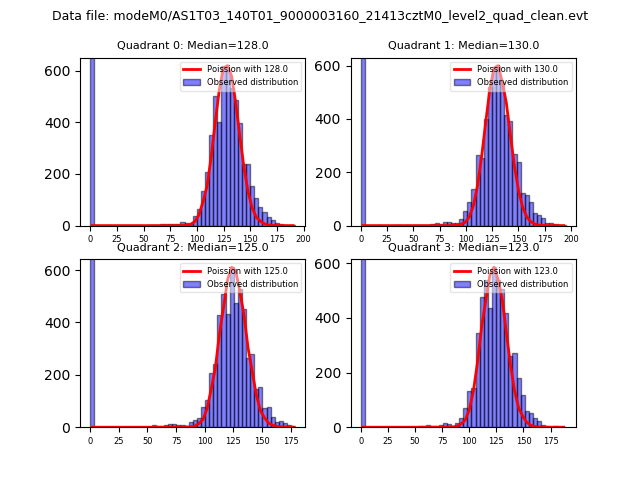 |
 |
| Quadrant-wise count rates Data is divided into 100 sec bins |
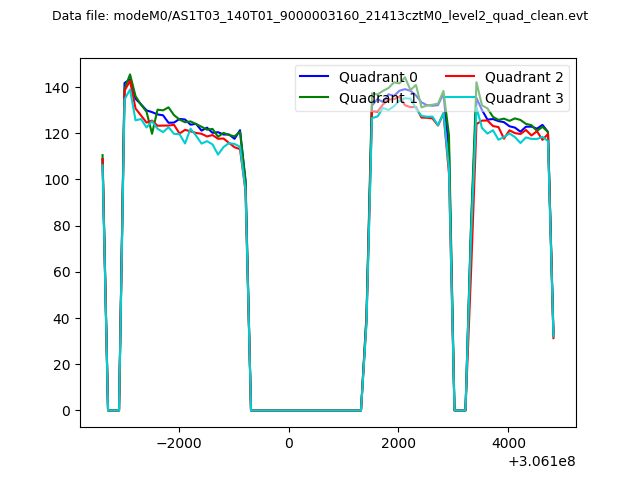 |
|
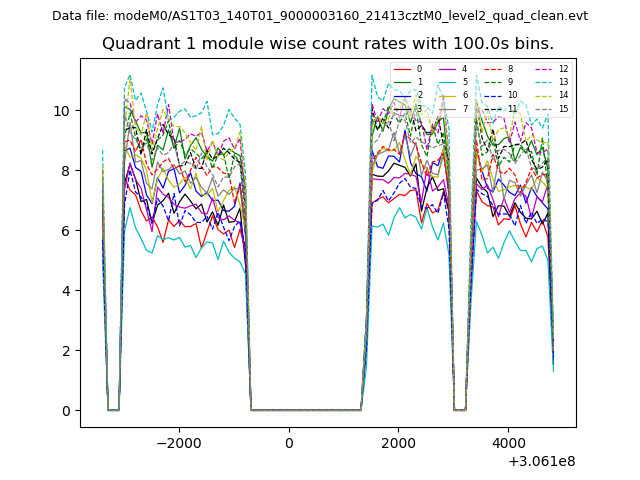
| Module-wise count rates for Quadrant A Data is divided into 100 sec bins |
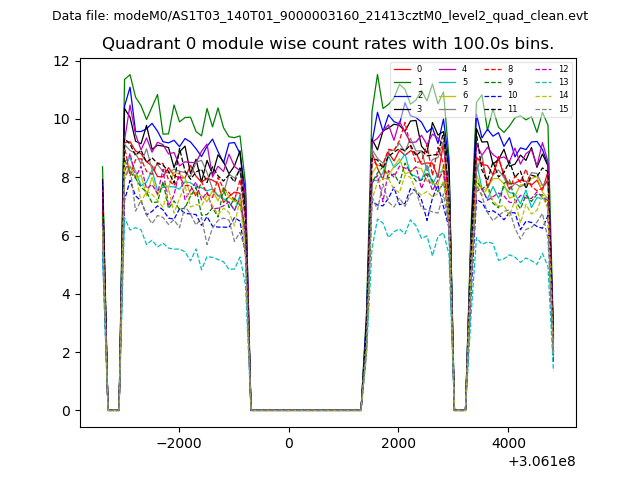 |
 |
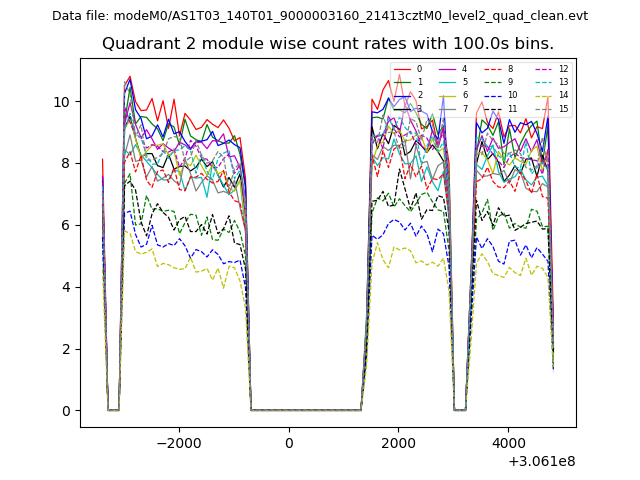
| Module-wise count rates for Quadrant B Data is divided into 100 sec bins |
 |
 |
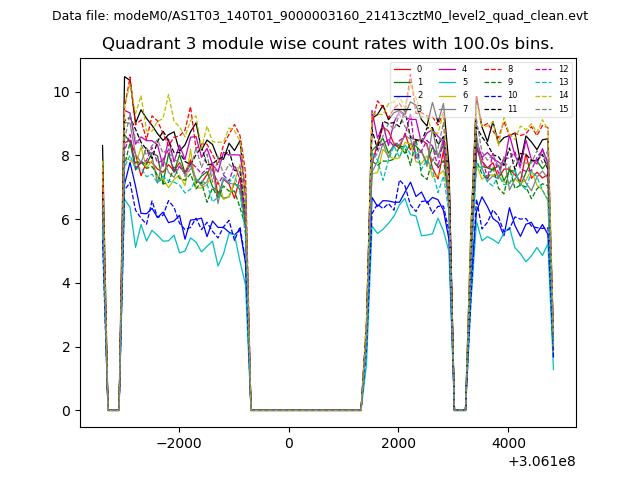
| Module-wise count rates for Quadrant C Data is divided into 100 sec bins |
 |
 |
| Module-wise count rates for Quadrant D Data is divided into 100 sec bins |
 |
 |
| Parameter | Plot |
|---|---|
| CZT HV Monitor | 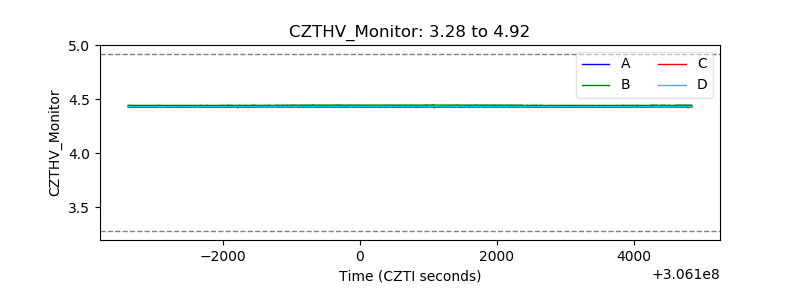 |
| D_VDD | 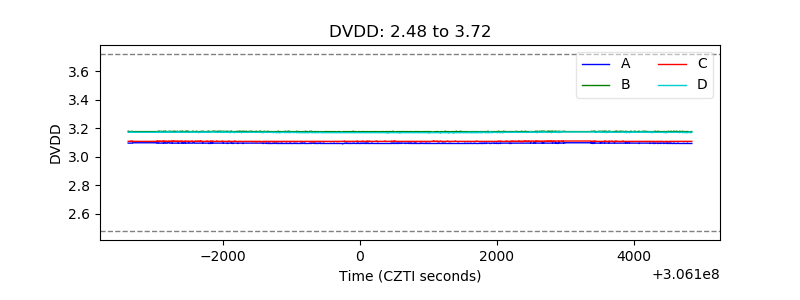 |
| Temperature 1 | 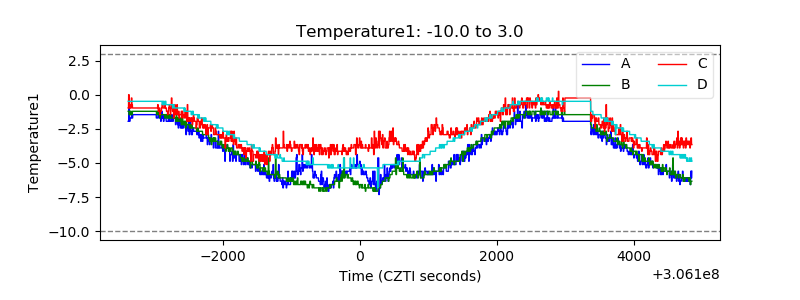 |
| Veto HV Monitor | 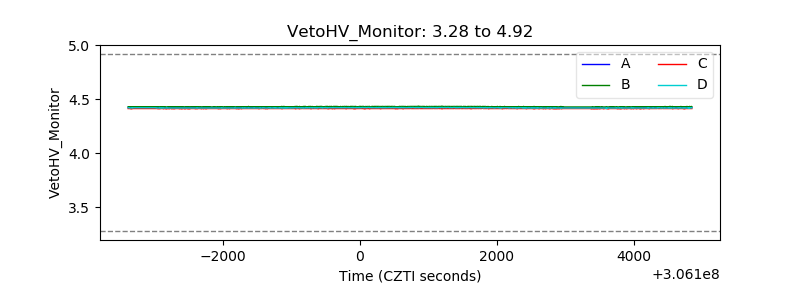 |
| Veto LLD | 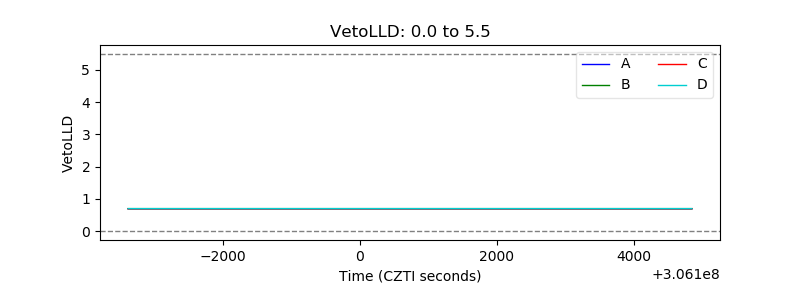 |
| Alpha Counter | 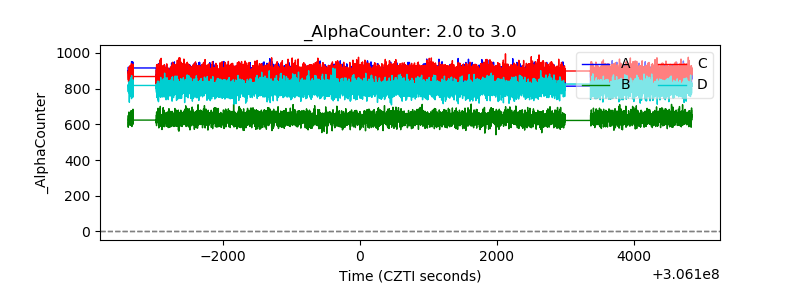 |
| _CPM_Rate | 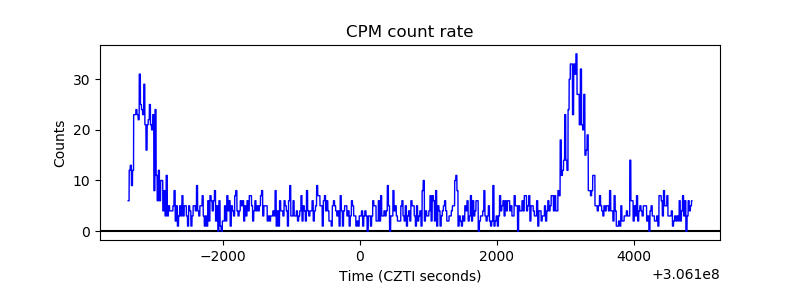 |
| CZT Counter | 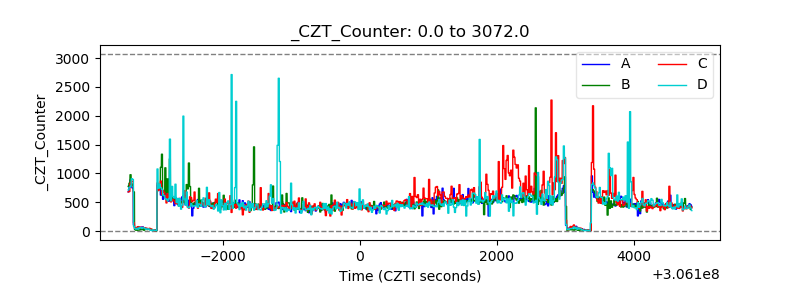 |
| +2.5 Volts monitor |  |
| +5 Volts monitor |  |
| _ROLL_ROT | 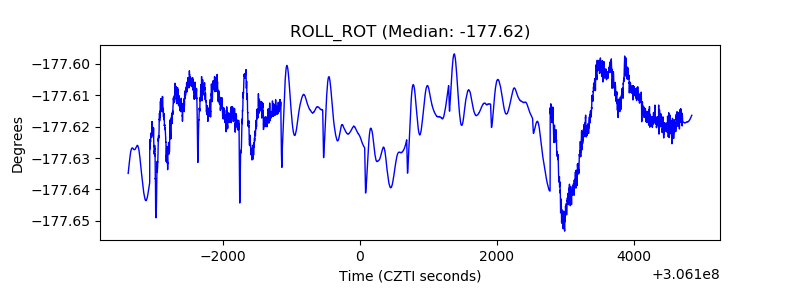 |
| _Roll_DEC |  |
| _Roll_RA | 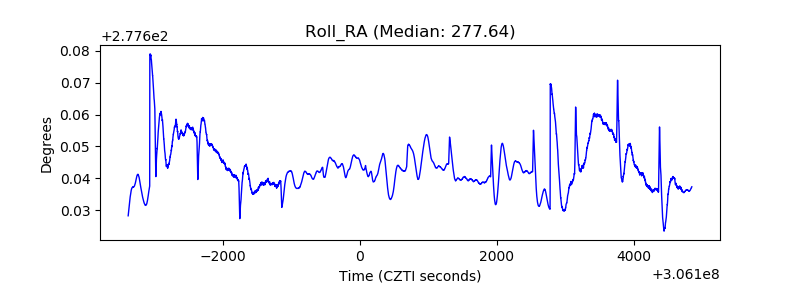 |
| Veto Counter | 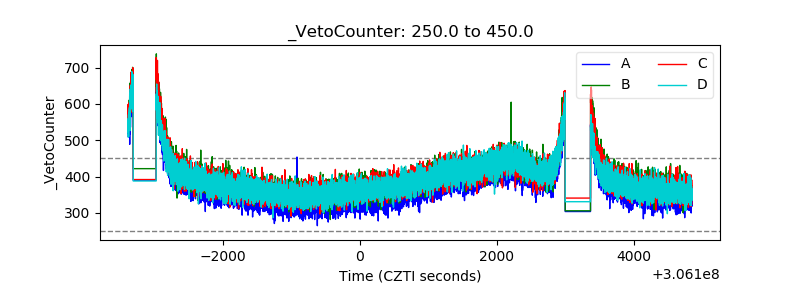 |