| Param | Original file | Final file |
|---|---|---|
| Filename | modeM0/AS1T03_140T01_9000003160_21421cztM0_level2.evt | modeM0/AS1T03_140T01_9000003160_21421cztM0_level2_quad_clean.evt |
| Size (bytes) | 194,313,600 | 31,824,000 |
| Size | 185.3 MB | 30.3 MB |
| Events in quadrant A | 1,402,625 | 203,191 |
| Events in quadrant B | 1,346,847 | 206,898 |
| Events in quadrant C | 1,338,992 | 196,705 |
| Events in quadrant D | 1,639,150 | 191,546 |
| Mode SS | |||
|---|---|---|---|
| Quadrant | BADHDUFLAG | Total packets | Discarded packets |
| A | 0 | 48 | 0 |
| B | 0 | 49 | 1 |
| C | 0 | 48 | 0 |
| D | 0 | 48 | 0 |
| Mode M0 | |||
|---|---|---|---|
| Quadrant | BADHDUFLAG | Total packets | Discarded packets |
| A | 0 | 5906 | 82 |
| B | 0 | 5608 | 78 |
| C | 0 | 5605 | 68 |
| D | 0 | 6665 | 203 |
| Mode M9 | |||
|---|---|---|---|
| Quadrant | BADHDUFLAG | Total packets | Discarded packets |
| A | 0 | 12 | 0 |
| B | 0 | 12 | 0 |
| C | 0 | 12 | 0 |
| D | 0 | 12 | 0 |
| Quadrant | Total seconds | Saturated seconds | Saturation percentage |
|---|---|---|---|
| A | 2284 | 93 | 4.071804% |
| B | 2284 | 92 | 4.028021% |
| C | 2286 | 112 | 4.899388% |
| D | 2284 | 98 | 4.290718% |
Noise dominated data is calculated using 1-second bins in cleaned event files. If a bin has >2000 counts, and if more than 50% of those come from <1% of pixels, then it is considered to be noise-dominated and hence unusable.
| Quadrant | # 1 sec bins | Bins with >0 counts | Bins with >2000 counts | High rate bins dominated by noise | Noise dominated (total time) | Noise dominated (detector-on time) | Marked lightcurve |
|---|---|---|---|---|---|---|---|
| A | 3543 | 2290 | 0 | 0 | 0.00% | 0.00% |  |
| B | 3544 | 2290 | 1 | 1 | 0.03% | 0.04% | 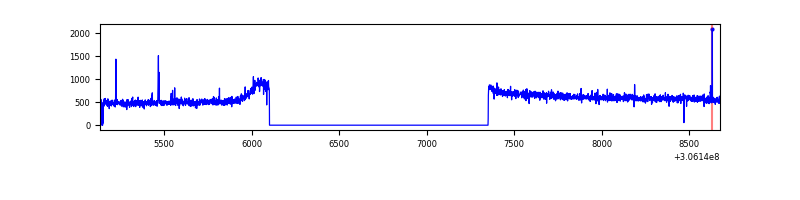 |
| C | 3540 | 2289 | 0 | 0 | 0.00% | 0.00% | 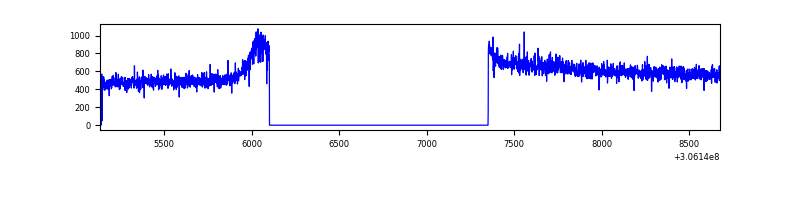 |
| D | 3542 | 2289 | 33 | 33 | 0.93% | 1.44% | 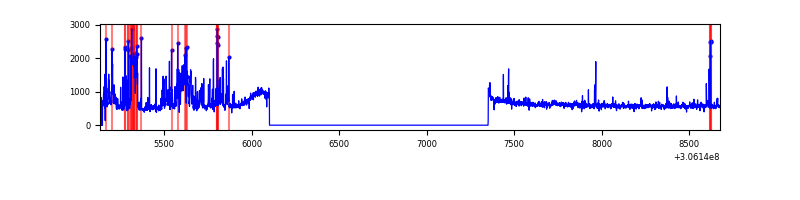 |
Top three noisy pixels from each quadrant. If the there are fewer than three noisy pixels in the level2.evt file, extra rows are filled as -1
| Pixel properties | Quadrant properties | ||||||
|---|---|---|---|---|---|---|---|
| Quadrant | DetID | PixID | Counts | Sigma | Mean | Median | Sigma |
| A | 5 | 168 | 39367 | 562.19 | 345 | 340 | 69.4 |
| A | 11 | 47 | 33362 | 475.69 | 345 | 340 | 69.4 |
| A | 0 | 226 | 2974 | 37.94 | 345 | 340 | 69.4 |
| B | 12 | 111 | 7462 | 106.81 | 342 | 334 | 66.7 |
| B | 3 | 64 | 6572 | 93.47 | 342 | 334 | 66.7 |
| B | 11 | 111 | 6548 | 93.11 | 342 | 334 | 66.7 |
| C | 14 | 238 | 52044 | 669.63 | 329 | 332 | 77.2 |
| C | 3 | 233 | 4692 | 56.46 | 329 | 332 | 77.2 |
| C | 13 | 61 | 2215 | 24.38 | 329 | 332 | 77.2 |
| D | 1 | 20 | 151163 | 1825.24 | 335 | 325 | 82.6 |
| D | 1 | 52 | 78302 | 943.57 | 335 | 325 | 82.6 |
| D | 13 | 172 | 46333 | 556.73 | 335 | 325 | 82.6 |
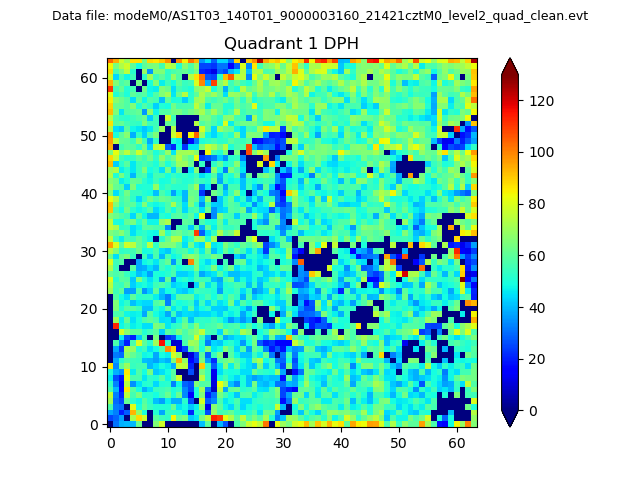
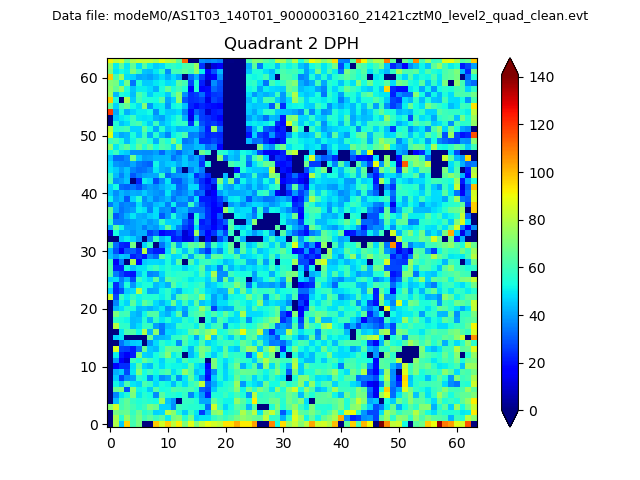
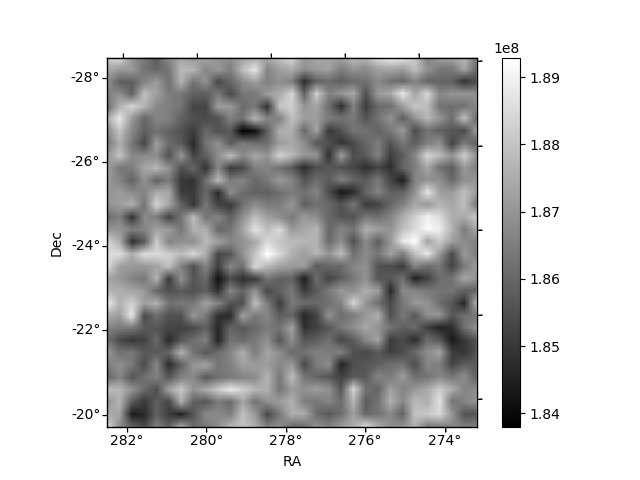
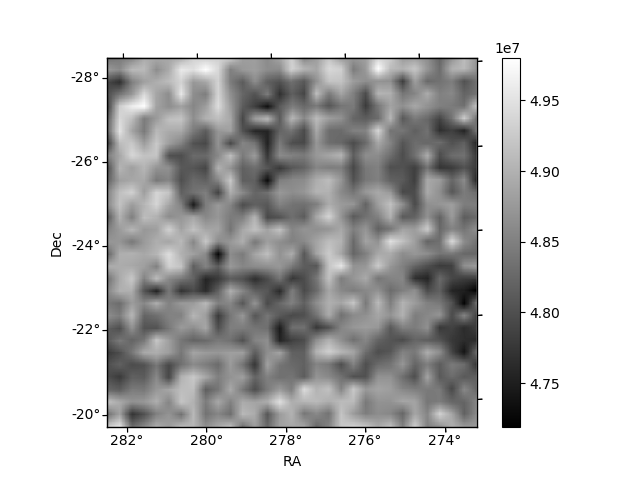
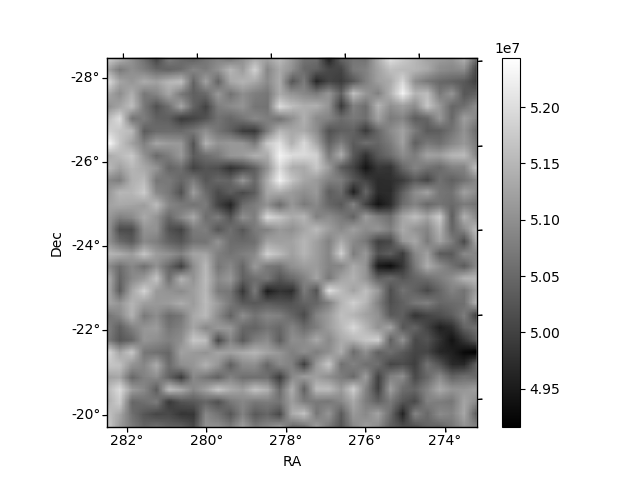
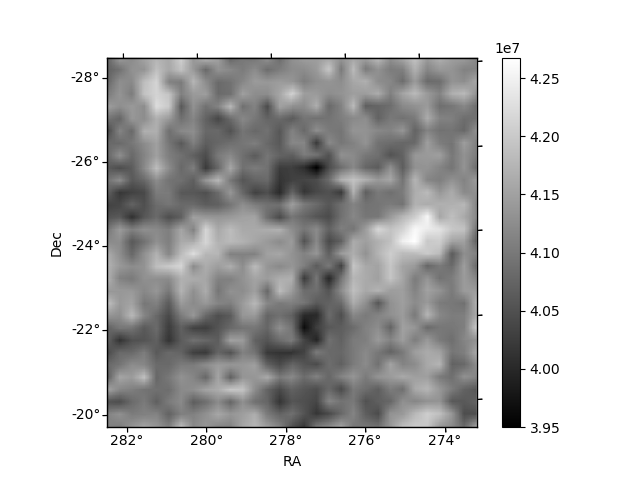
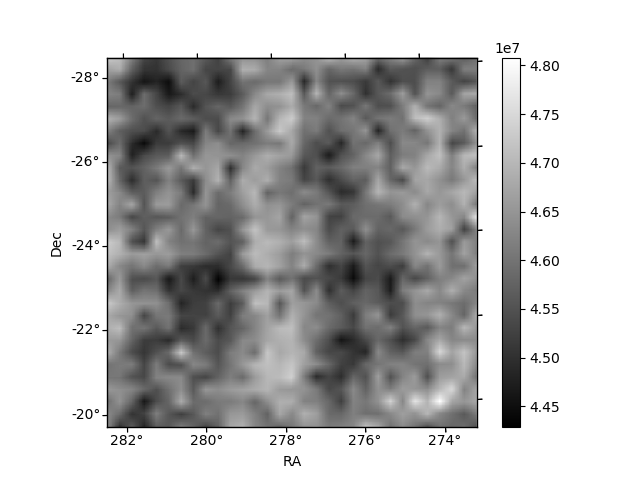
Histogram calculated using DETX and DETY for each event in the final _common_clean file
| Quadrant A | 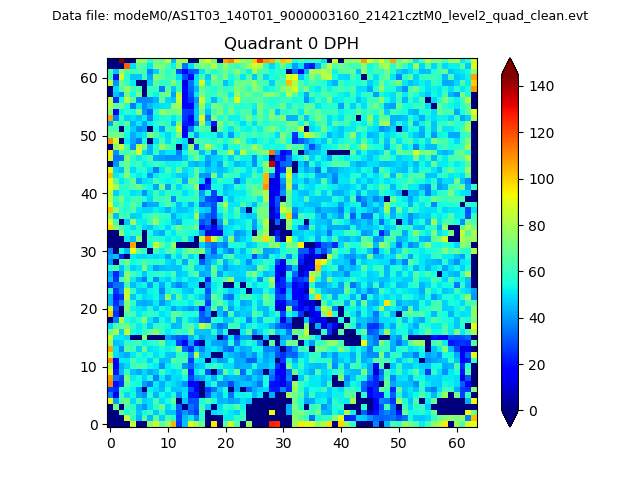 |
 |
Quadrant B |
|---|---|---|---|
| Quadrant D | 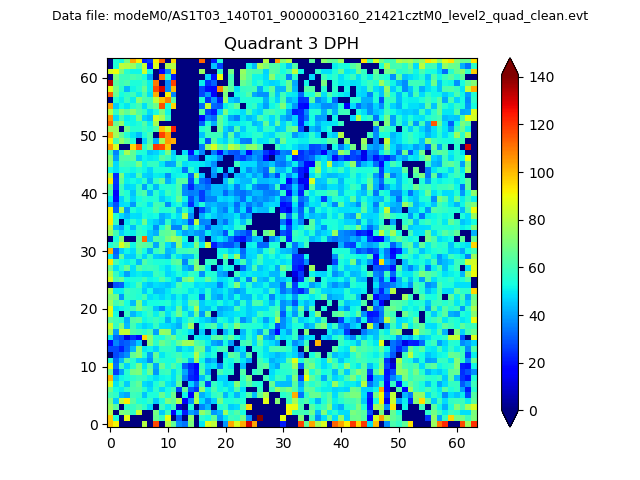 |
 |
Quadrant C |
| Plot type | Count rate plots | Images |
|---|---|---|
| Comparison with Poisson distribution Blue bars denote a histogram of data divided into 1 sec bins. Red curve is a Poisson curve with rate = median count rate of data. |
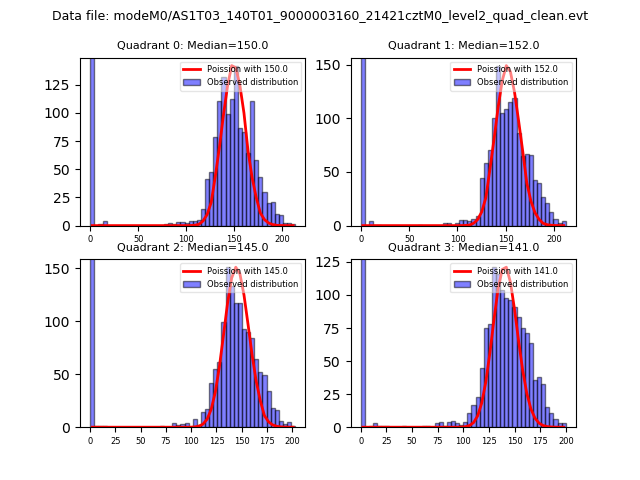 |
 |
| Quadrant-wise count rates Data is divided into 100 sec bins |
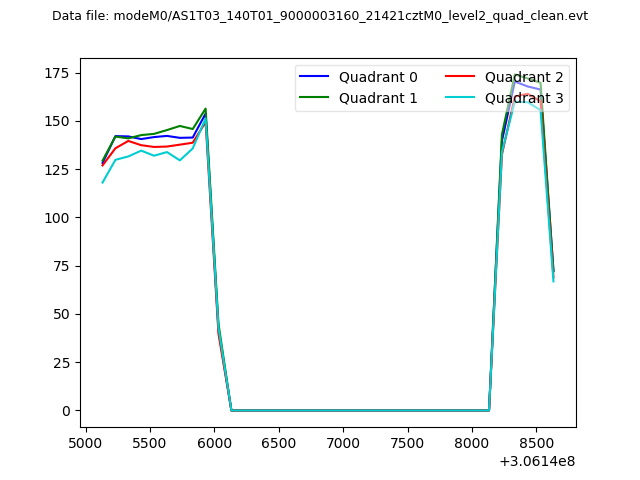 |
|
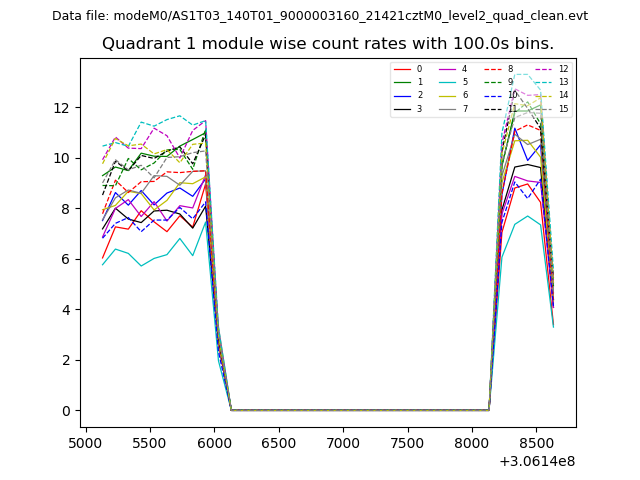
| Module-wise count rates for Quadrant A Data is divided into 100 sec bins |
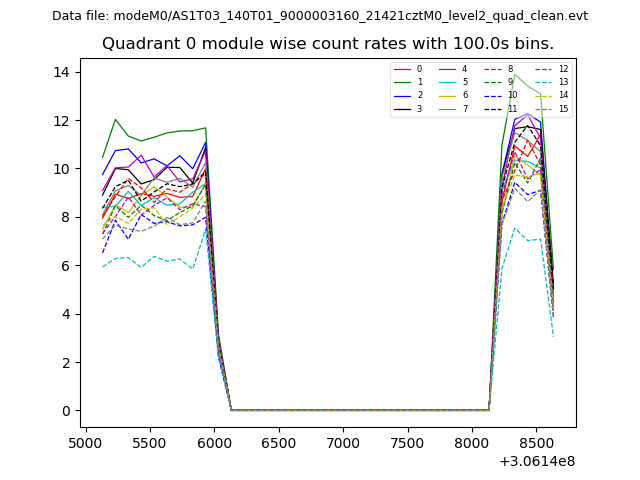 |
 |
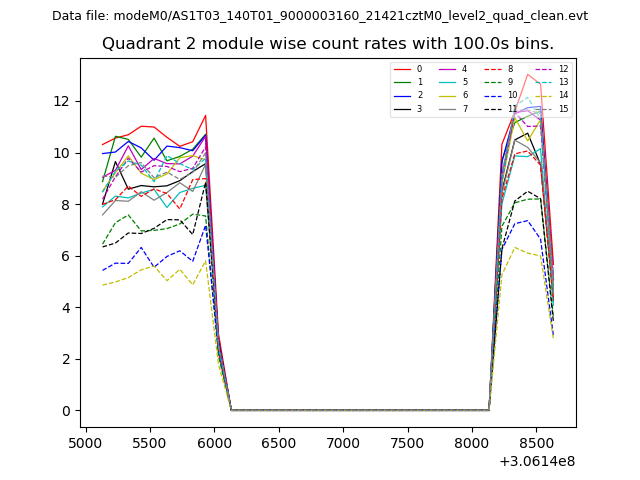
| Module-wise count rates for Quadrant B Data is divided into 100 sec bins |
 |
 |
| Module-wise count rates for Quadrant C Data is divided into 100 sec bins |
 |
 |
| Module-wise count rates for Quadrant D Data is divided into 100 sec bins |
 |
 |
| Parameter | Plot |
|---|---|
| CZT HV Monitor | 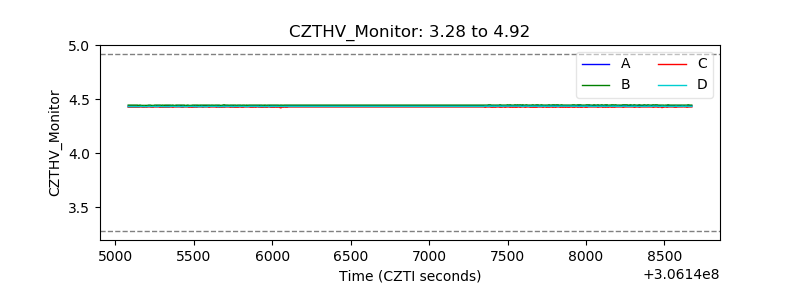 |
| D_VDD |  |
| Temperature 1 | 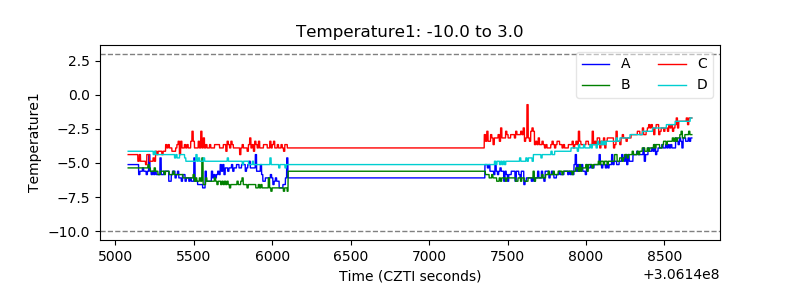 |
| Veto HV Monitor | 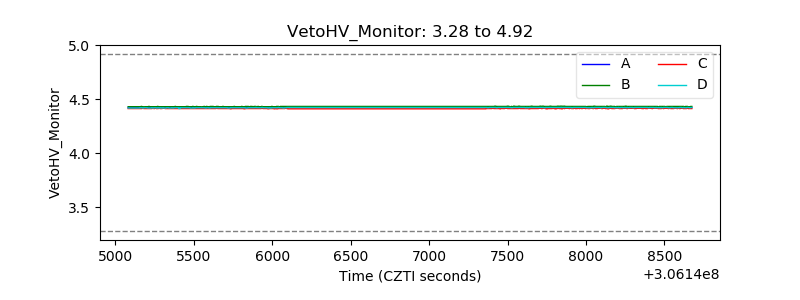 |
| Veto LLD |  |
| Alpha Counter | 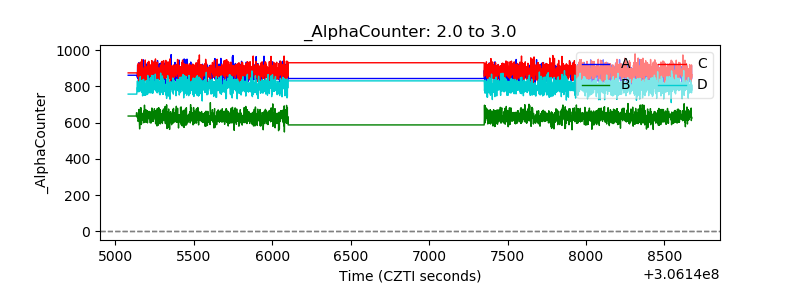 |
| _CPM_Rate | 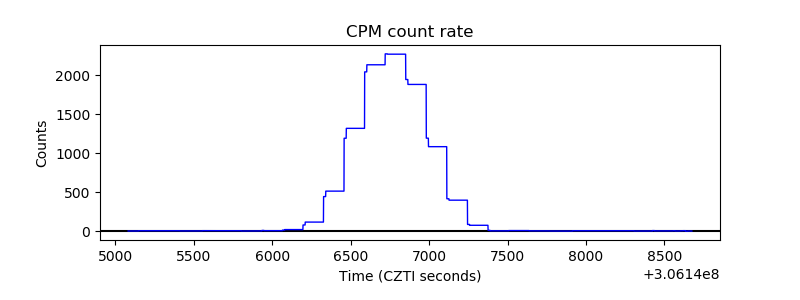 |
| CZT Counter | 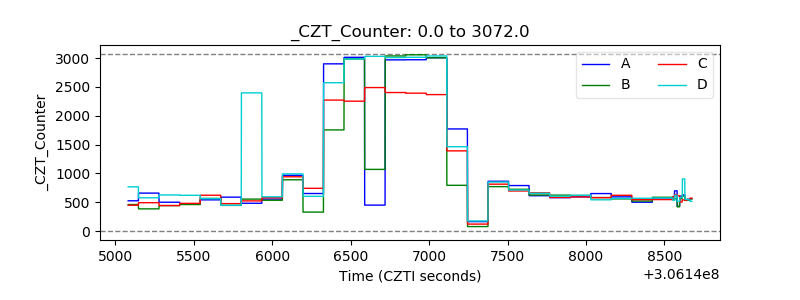 |
| +2.5 Volts monitor |  |
| +5 Volts monitor |  |
| _ROLL_ROT | 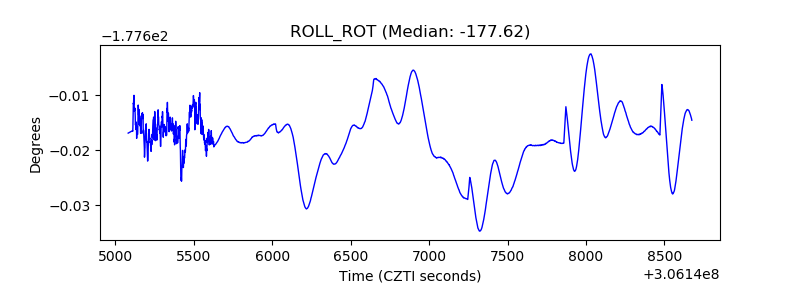 |
| _Roll_DEC | 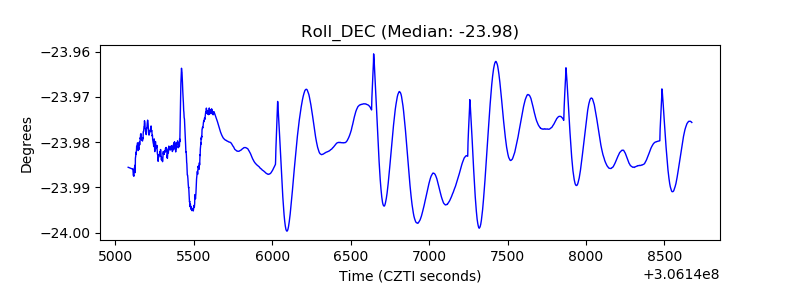 |
| _Roll_RA | 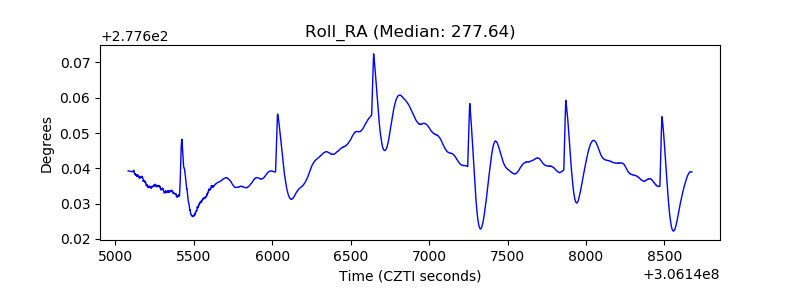 |
| Veto Counter | 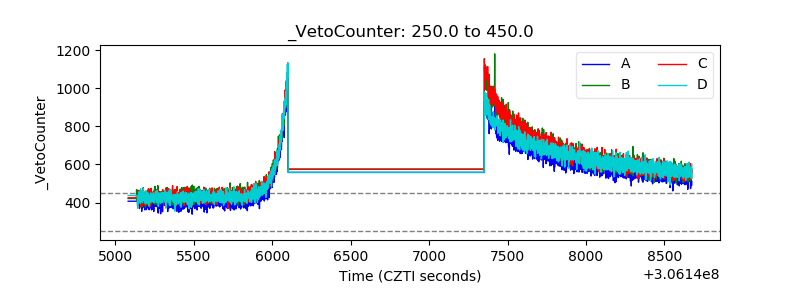 |