| Param | Original file | Final file |
|---|---|---|
| Filename | modeM0/AS1T03_140T01_9000003160_21422cztM0_level2.evt | modeM0/AS1T03_140T01_9000003160_21422cztM0_level2_quad_clean.evt |
| Size (bytes) | 499,832,640 | 103,921,920 |
| Size | 476.7 MB | 99.1 MB |
| Events in quadrant A | 3,588,216 | 692,052 |
| Events in quadrant B | 3,524,017 | 697,928 |
| Events in quadrant C | 3,453,444 | 669,715 |
| Events in quadrant D | 4,148,334 | 651,786 |
| Mode SS | |||
|---|---|---|---|
| Quadrant | BADHDUFLAG | Total packets | Discarded packets |
| A | 0 | 126 | 0 |
| B | 0 | 126 | 0 |
| C | 0 | 126 | 0 |
| D | 0 | 126 | 0 |
| Mode M0 | |||
|---|---|---|---|
| Quadrant | BADHDUFLAG | Total packets | Discarded packets |
| A | 0 | 14789 | 2 |
| B | 0 | 14509 | 2 |
| C | 0 | 14335 | 2 |
| D | 0 | 16410 | 2 |
| Mode M9 | |||
|---|---|---|---|
| Quadrant | BADHDUFLAG | Total packets | Discarded packets |
| A | 0 | 22 | 0 |
| B | 0 | 23 | 0 |
| C | 0 | 23 | 0 |
| D | 0 | 23 | 0 |
| Quadrant | Total seconds | Saturated seconds | Saturation percentage |
|---|---|---|---|
| A | 6249 | 84 | 1.344215% |
| B | 6249 | 88 | 1.408225% |
| C | 6249 | 135 | 2.160346% |
| D | 6249 | 163 | 2.608417% |
Noise dominated data is calculated using 1-second bins in cleaned event files. If a bin has >2000 counts, and if more than 50% of those come from <1% of pixels, then it is considered to be noise-dominated and hence unusable.
| Quadrant | # 1 sec bins | Bins with >0 counts | Bins with >2000 counts | High rate bins dominated by noise | Noise dominated (total time) | Noise dominated (detector-on time) | Marked lightcurve |
|---|---|---|---|---|---|---|---|
| A | 7574 | 6249 | 0 | 0 | 0.00% | 0.00% | 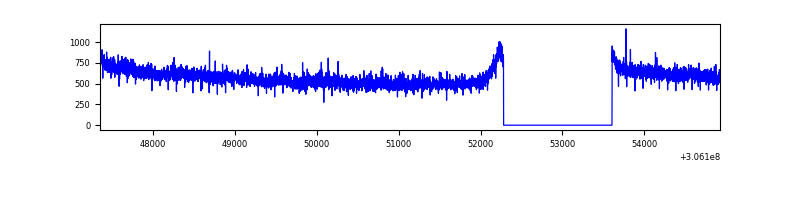 |
| B | 7574 | 6249 | 4 | 4 | 0.05% | 0.06% | 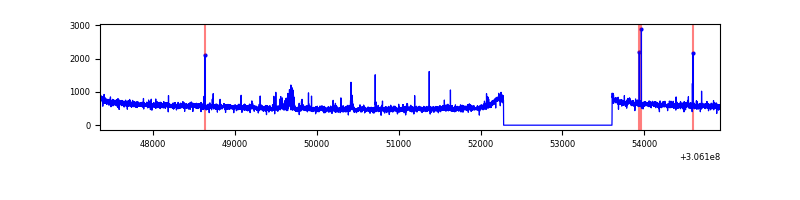 |
| C | 7574 | 6249 | 0 | 0 | 0.00% | 0.00% | 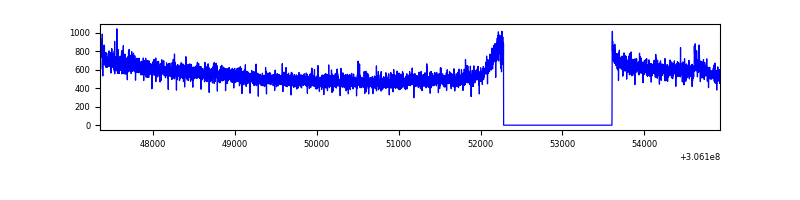 |
| D | 7574 | 6249 | 118 | 118 | 1.56% | 1.89% | 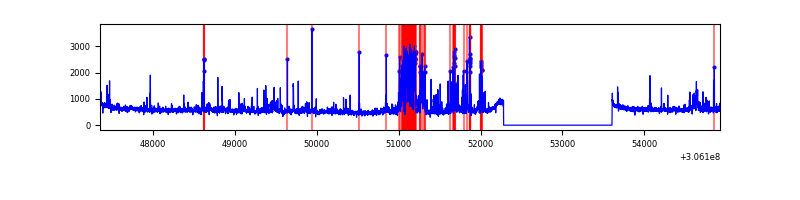 |
Top three noisy pixels from each quadrant. If the there are fewer than three noisy pixels in the level2.evt file, extra rows are filled as -1
| Pixel properties | Quadrant properties | ||||||
|---|---|---|---|---|---|---|---|
| Quadrant | DetID | PixID | Counts | Sigma | Mean | Median | Sigma |
| A | 5 | 168 | 116692 | 655.0 | 894 | 879 | 176.8 |
| A | 11 | 47 | 27829 | 152.42 | 894 | 879 | 176.8 |
| A | 13 | 254 | 8550 | 43.38 | 894 | 879 | 176.8 |
| B | 0 | 190 | 47041 | 284.75 | 877 | 860 | 162.2 |
| B | 0 | 230 | 21834 | 129.32 | 877 | 860 | 162.2 |
| B | 12 | 111 | 18639 | 109.62 | 877 | 860 | 162.2 |
| C | 14 | 238 | 136065 | 702.39 | 841 | 850 | 192.5 |
| C | 3 | 233 | 23874 | 119.6 | 841 | 850 | 192.5 |
| C | 10 | 91 | 15434 | 75.76 | 841 | 850 | 192.5 |
| D | 14 | 34 | 328645 | 1556.04 | 864 | 841 | 210.7 |
| D | 7 | 38 | 203171 | 960.43 | 864 | 841 | 210.7 |
| D | 1 | 52 | 91143 | 428.65 | 864 | 841 | 210.7 |
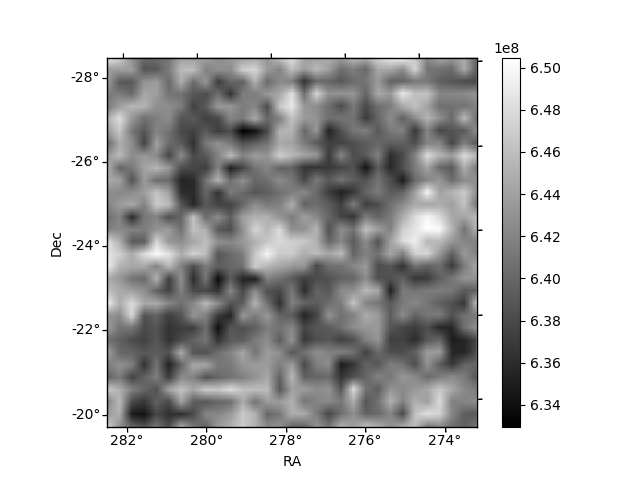
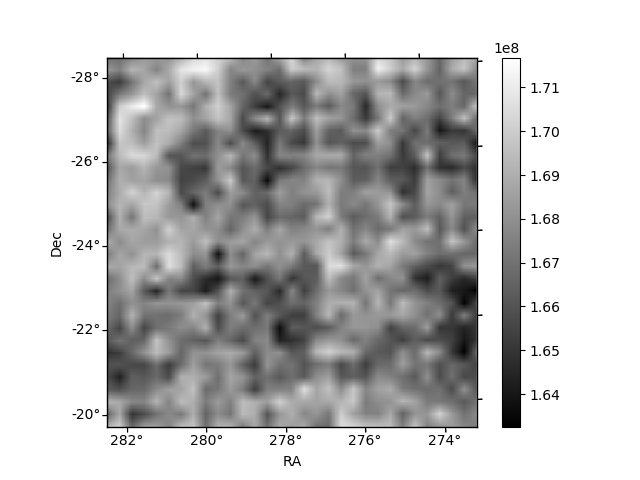
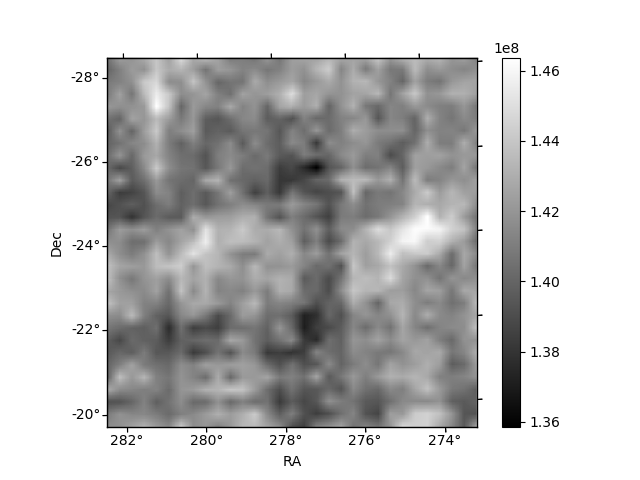
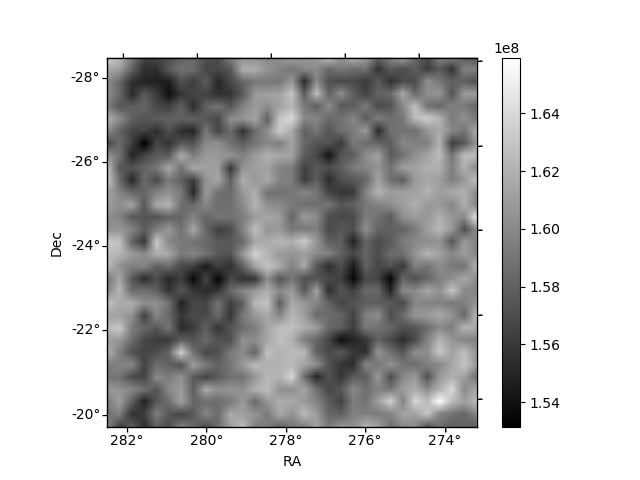
Histogram calculated using DETX and DETY for each event in the final _common_clean file
| Quadrant A | 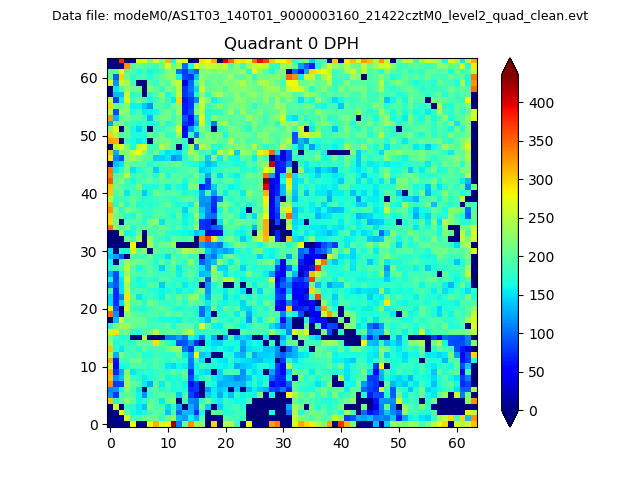 |
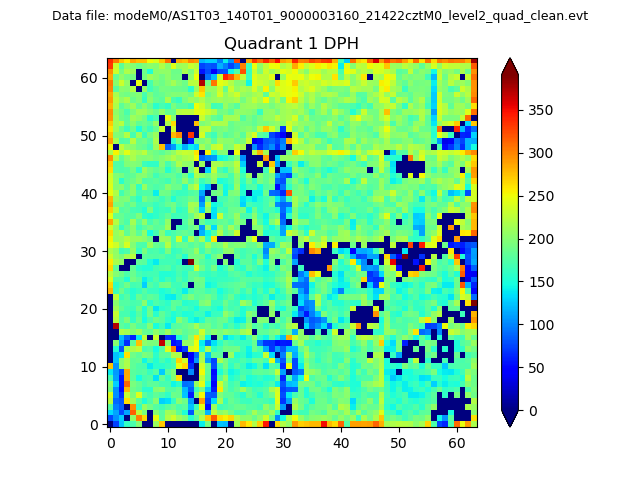 |
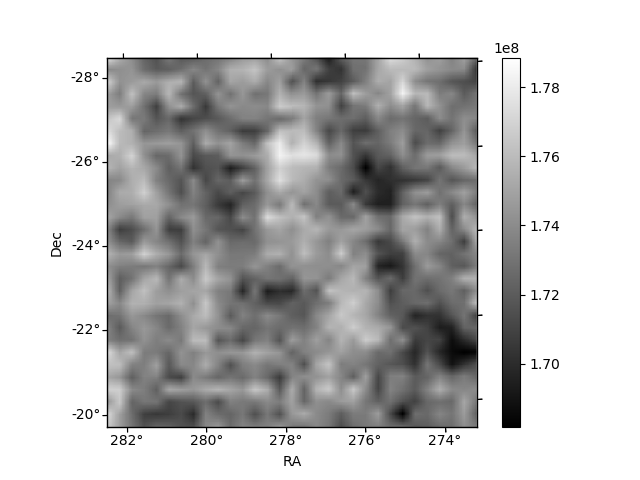
Quadrant B |
|---|---|---|---|
| Quadrant D | 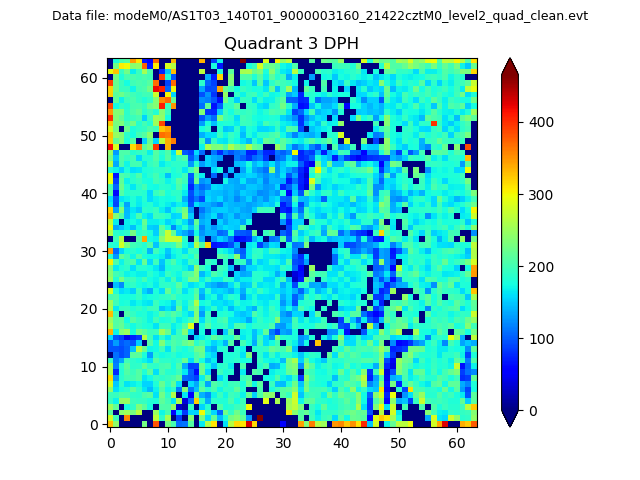 |
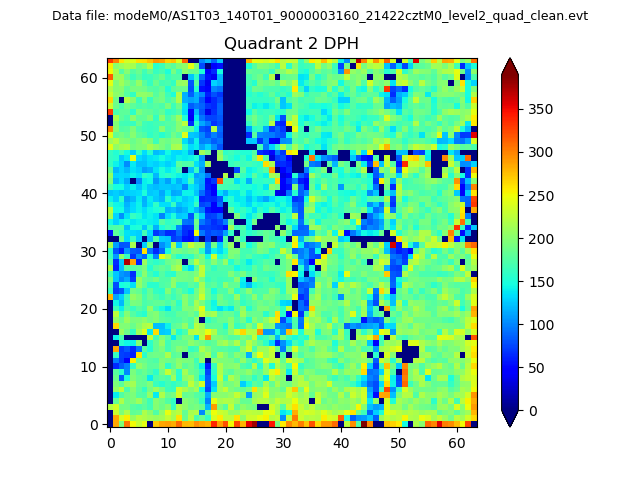 |
Quadrant C |
| Plot type | Count rate plots | Images |
|---|---|---|
| Comparison with Poisson distribution Blue bars denote a histogram of data divided into 1 sec bins. Red curve is a Poisson curve with rate = median count rate of data. |
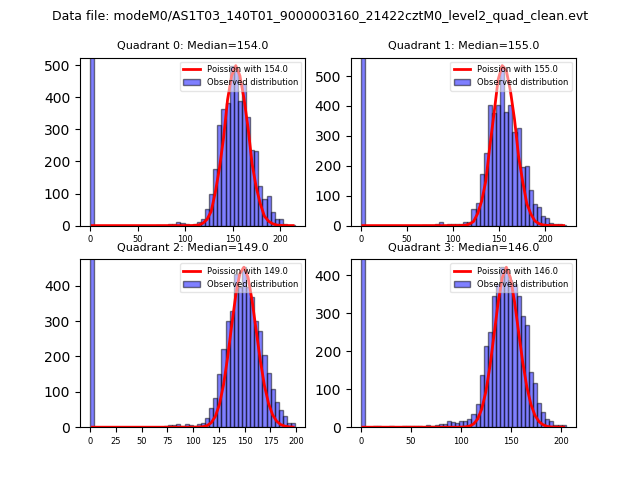 |
 |
| Quadrant-wise count rates Data is divided into 100 sec bins |
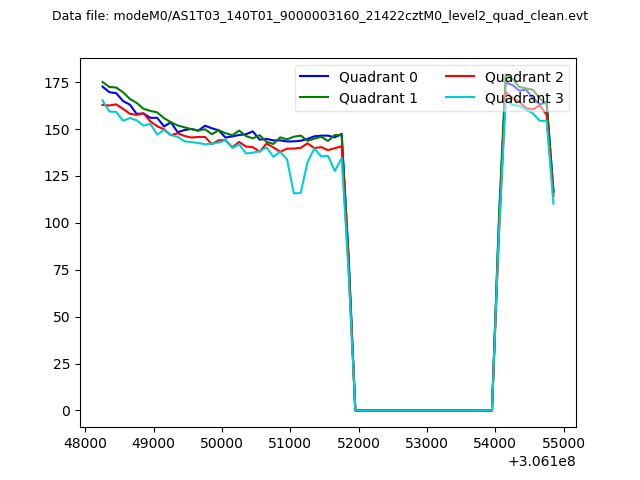 |
|
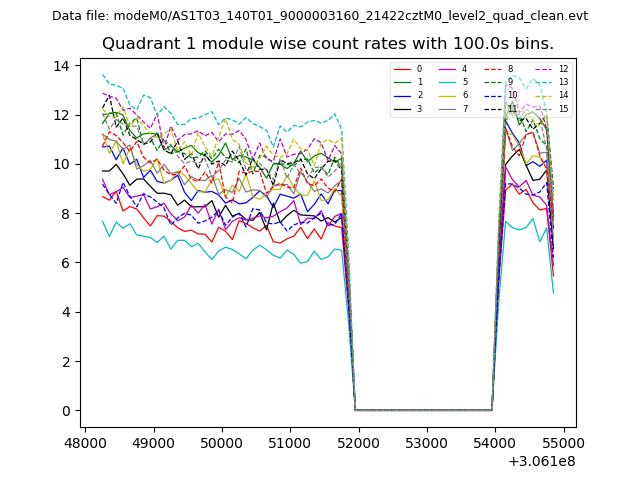
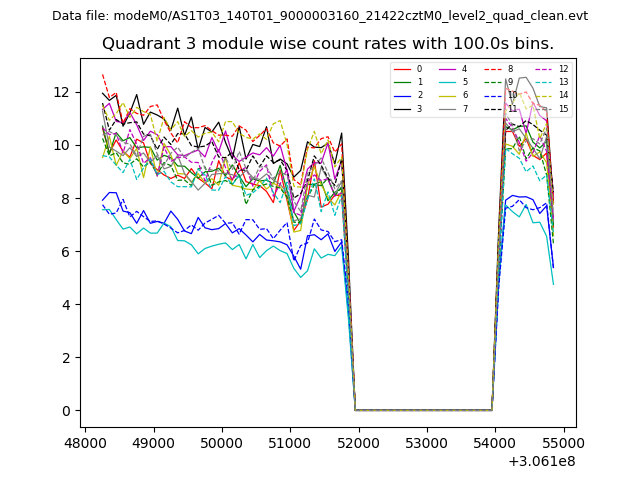
| Module-wise count rates for Quadrant A Data is divided into 100 sec bins |
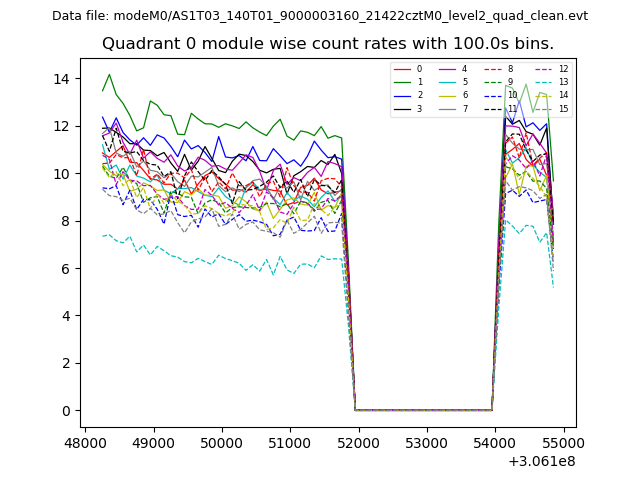 |
 |
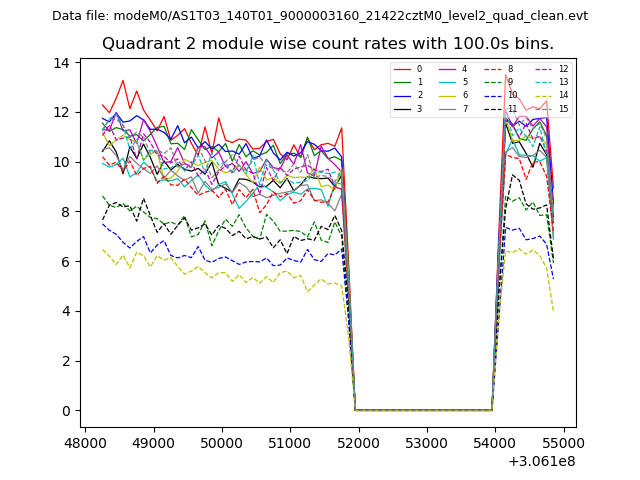
| Module-wise count rates for Quadrant B Data is divided into 100 sec bins |
 |
 |
| Module-wise count rates for Quadrant C Data is divided into 100 sec bins |
 |
 |
| Module-wise count rates for Quadrant D Data is divided into 100 sec bins |
 |
 |
| Parameter | Plot |
|---|---|
| CZT HV Monitor | 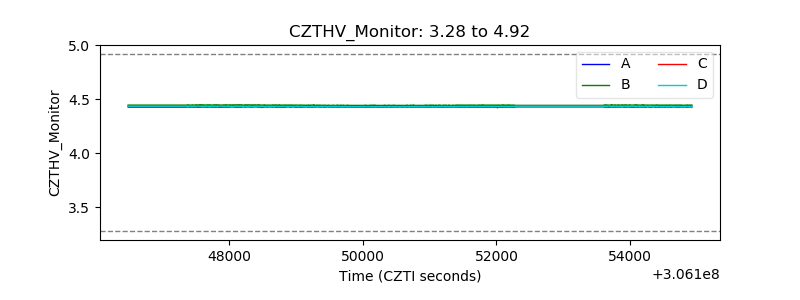 |
| D_VDD | 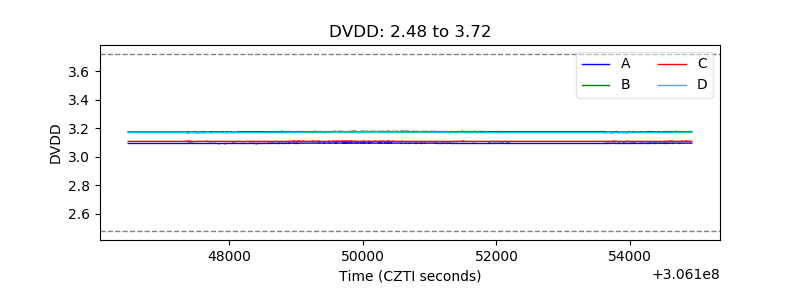 |
| Temperature 1 | 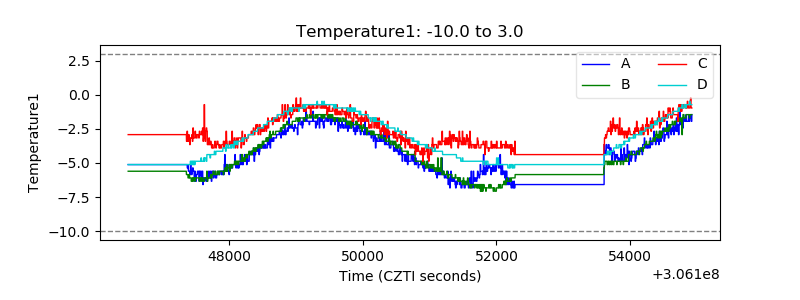 |
| Veto HV Monitor | 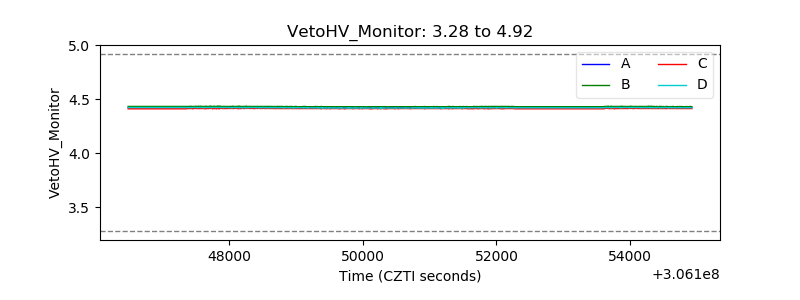 |
| Veto LLD | 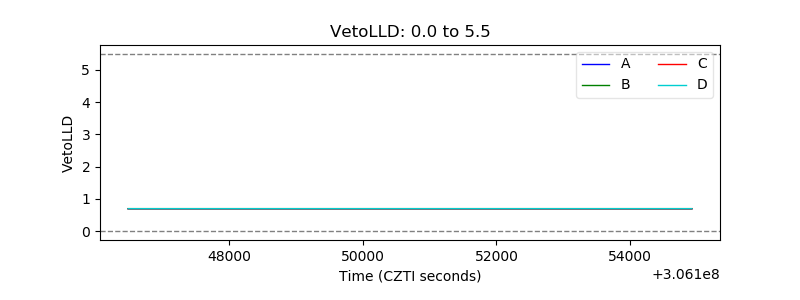 |
| Alpha Counter | 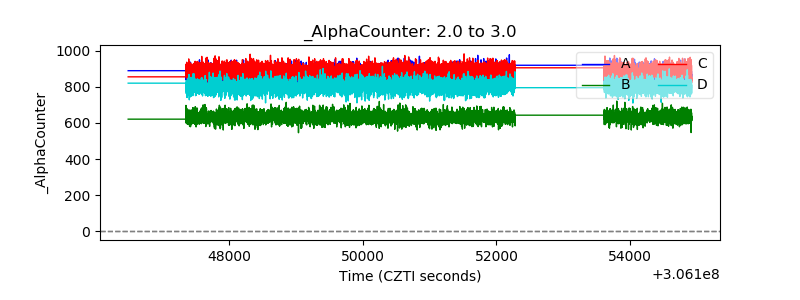 |
| _CPM_Rate | 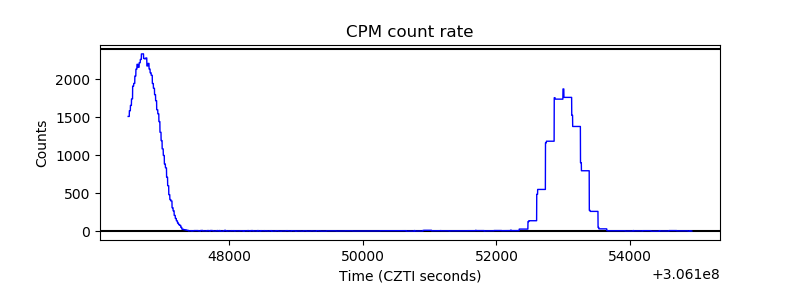 |
| CZT Counter | 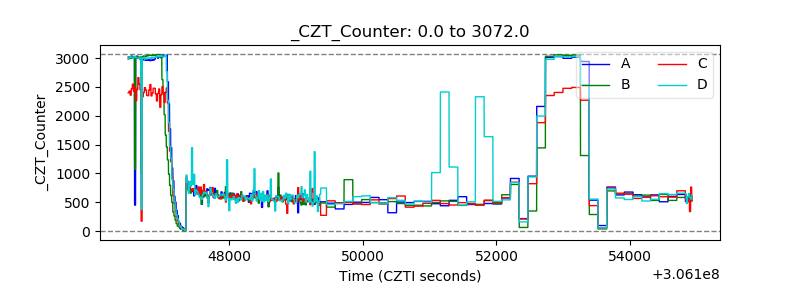 |
| +2.5 Volts monitor |  |
| +5 Volts monitor | 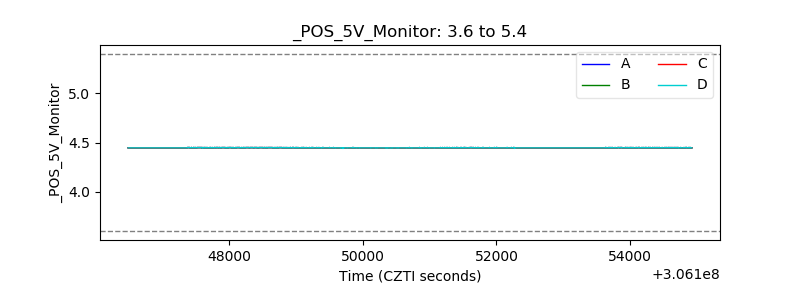 |
| _ROLL_ROT |  |
| _Roll_DEC | 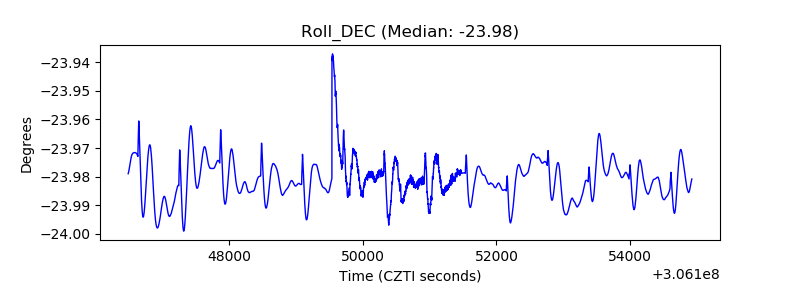 |
| _Roll_RA | 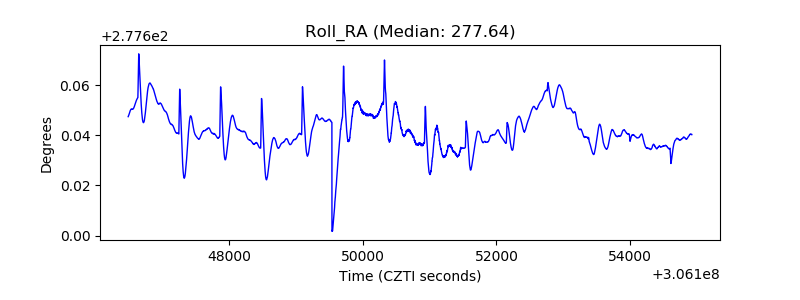 |
| Veto Counter | 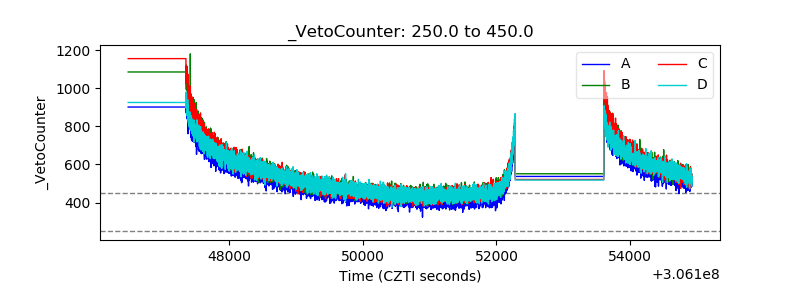 |