| Param | Original file | Final file |
|---|---|---|
| Filename | modeM0/AS1T03_140T01_9000003160_21423cztM0_level2.evt | modeM0/AS1T03_140T01_9000003160_21423cztM0_level2_quad_clean.evt |
| Size (bytes) | 463,633,920 | 111,240,000 |
| Size | 442.2 MB | 106.1 MB |
| Events in quadrant A | 3,294,686 | 755,993 |
| Events in quadrant B | 3,337,810 | 755,742 |
| Events in quadrant C | 3,259,736 | 723,427 |
| Events in quadrant D | 3,738,191 | 711,311 |
| Mode SS | |||
|---|---|---|---|
| Quadrant | BADHDUFLAG | Total packets | Discarded packets |
| A | 0 | 124 | 0 |
| B | 0 | 124 | 0 |
| C | 0 | 124 | 0 |
| D | 0 | 124 | 0 |
| Mode M0 | |||
|---|---|---|---|
| Quadrant | BADHDUFLAG | Total packets | Discarded packets |
| A | 0 | 13569 | 1 |
| B | 0 | 13734 | 1 |
| C | 0 | 13534 | 1 |
| D | 0 | 14951 | 1 |
| Mode M9 | |||
|---|---|---|---|
| Quadrant | BADHDUFLAG | Total packets | Discarded packets |
| A | 0 | 13 | 0 |
| B | 0 | 13 | 0 |
| C | 0 | 13 | 0 |
| D | 0 | 13 | 0 |
| Quadrant | Total seconds | Saturated seconds | Saturation percentage |
|---|---|---|---|
| A | 6048 | 66 | 1.091270% |
| B | 6049 | 82 | 1.355596% |
| C | 6049 | 88 | 1.454786% |
| D | 6049 | 69 | 1.140684% |
Noise dominated data is calculated using 1-second bins in cleaned event files. If a bin has >2000 counts, and if more than 50% of those come from <1% of pixels, then it is considered to be noise-dominated and hence unusable.
| Quadrant | # 1 sec bins | Bins with >0 counts | Bins with >2000 counts | High rate bins dominated by noise | Noise dominated (total time) | Noise dominated (detector-on time) | Marked lightcurve |
|---|---|---|---|---|---|---|---|
| A | 7368 | 6048 | 0 | 0 | 0.00% | 0.00% | 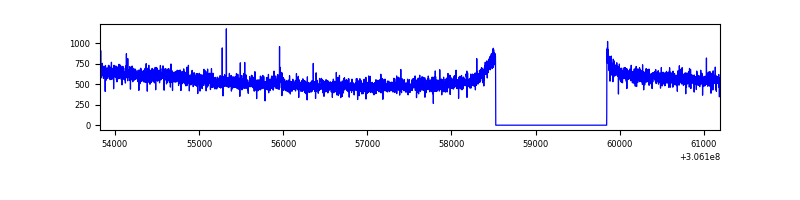 |
| B | 7369 | 6049 | 11 | 11 | 0.15% | 0.18% | 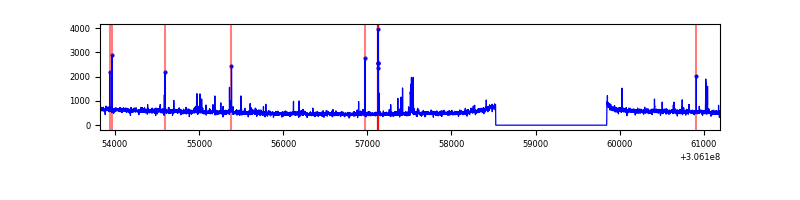 |
| C | 7369 | 6050 | 1 | 1 | 0.01% | 0.02% | 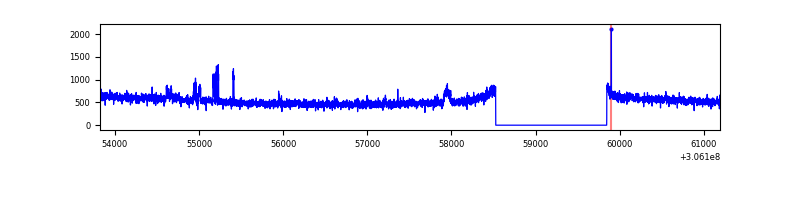 |
| D | 7369 | 6049 | 34 | 34 | 0.46% | 0.56% | 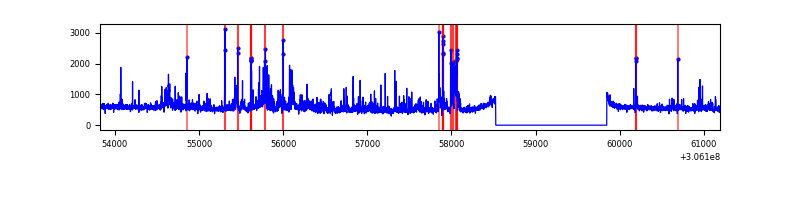 |
Top three noisy pixels from each quadrant. If the there are fewer than three noisy pixels in the level2.evt file, extra rows are filled as -1
| Pixel properties | Quadrant properties | ||||||
|---|---|---|---|---|---|---|---|
| Quadrant | DetID | PixID | Counts | Sigma | Mean | Median | Sigma |
| A | 5 | 168 | 91242 | 544.5 | 830 | 816 | 166.1 |
| A | 13 | 254 | 10046 | 55.58 | 830 | 816 | 166.1 |
| A | 0 | 226 | 7431 | 39.83 | 830 | 816 | 166.1 |
| B | 0 | 190 | 31529 | 199.87 | 814 | 796 | 153.8 |
| B | 0 | 228 | 31486 | 199.59 | 814 | 796 | 153.8 |
| B | 3 | 64 | 30642 | 194.1 | 814 | 796 | 153.8 |
| C | 14 | 238 | 124397 | 691.42 | 775 | 783 | 178.8 |
| C | 3 | 233 | 99033 | 549.55 | 775 | 783 | 178.8 |
| C | 10 | 91 | 9257 | 47.4 | 775 | 783 | 178.8 |
| D | 1 | 52 | 214805 | 1115.61 | 799 | 780 | 191.8 |
| D | 7 | 38 | 161396 | 837.22 | 799 | 780 | 191.8 |
| D | 12 | 235 | 101815 | 526.65 | 799 | 780 | 191.8 |
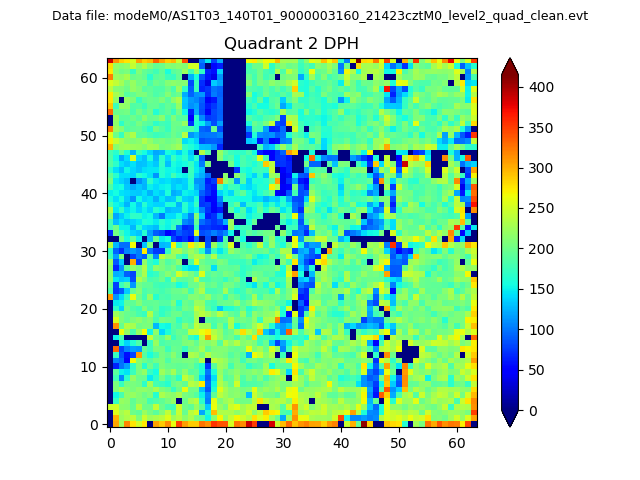
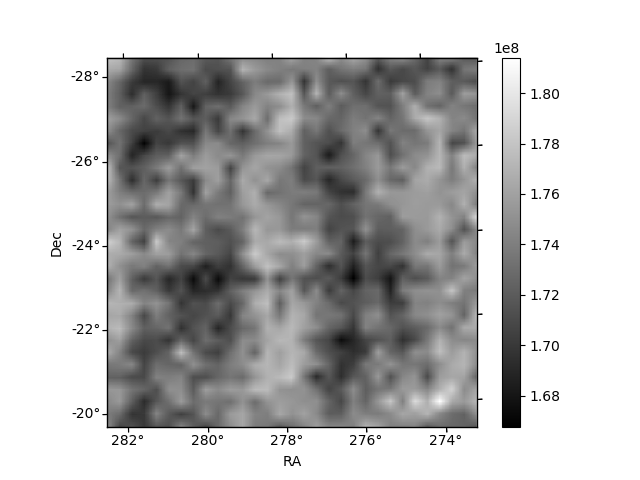
Histogram calculated using DETX and DETY for each event in the final _common_clean file
| Quadrant A | 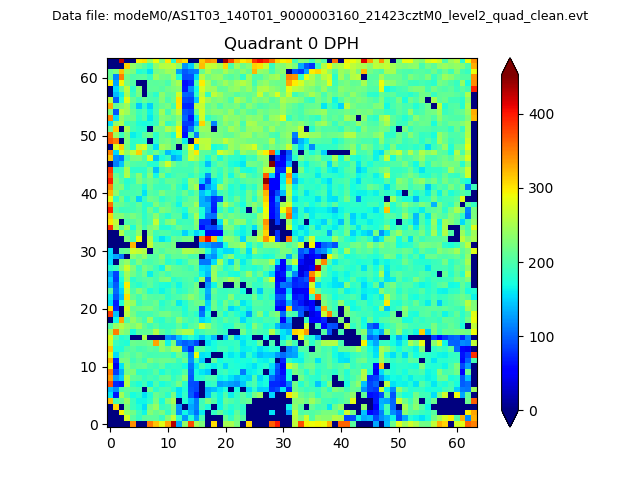 |
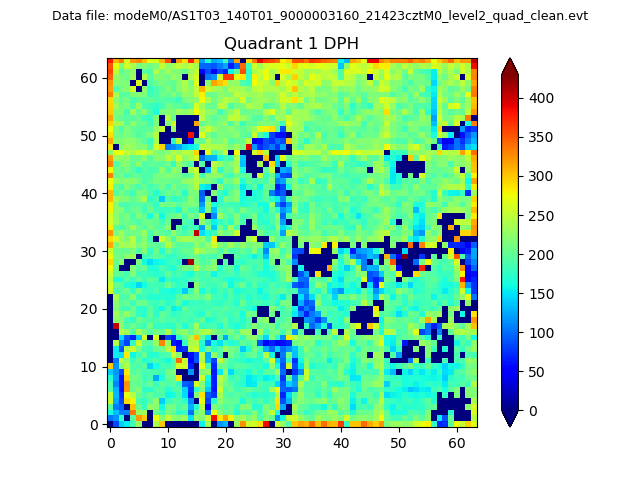 |
Quadrant B |
|---|---|---|---|
| Quadrant D | 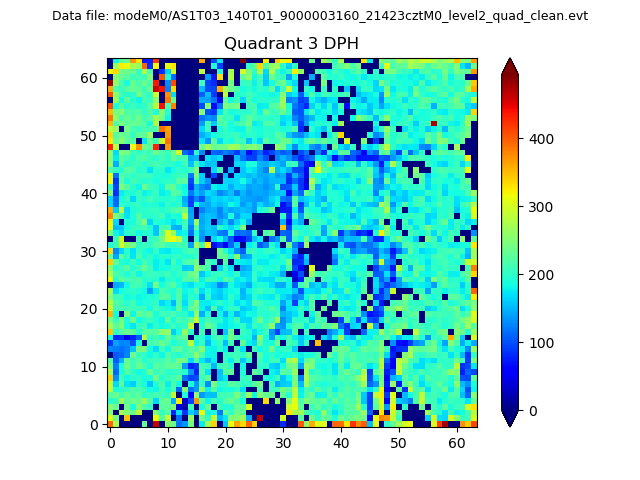 |
 |
Quadrant C |
| Plot type | Count rate plots | Images |
|---|---|---|
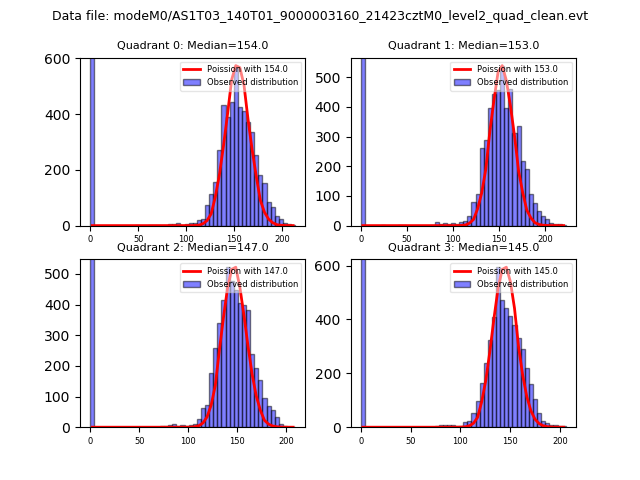
| Comparison with Poisson distribution Blue bars denote a histogram of data divided into 1 sec bins. Red curve is a Poisson curve with rate = median count rate of data. |
 |
 |
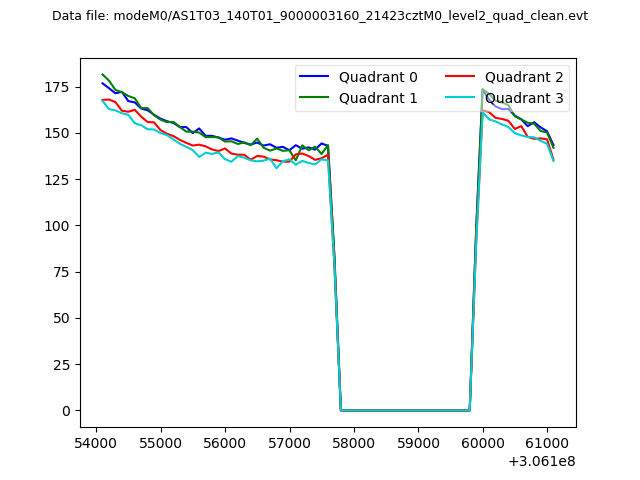
| Quadrant-wise count rates Data is divided into 100 sec bins |
 |
|
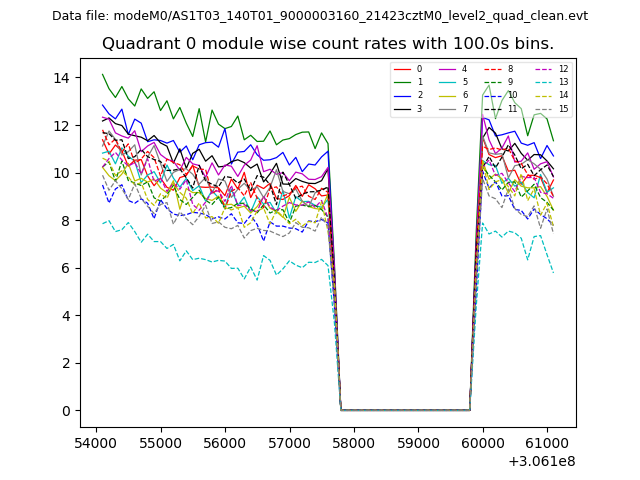
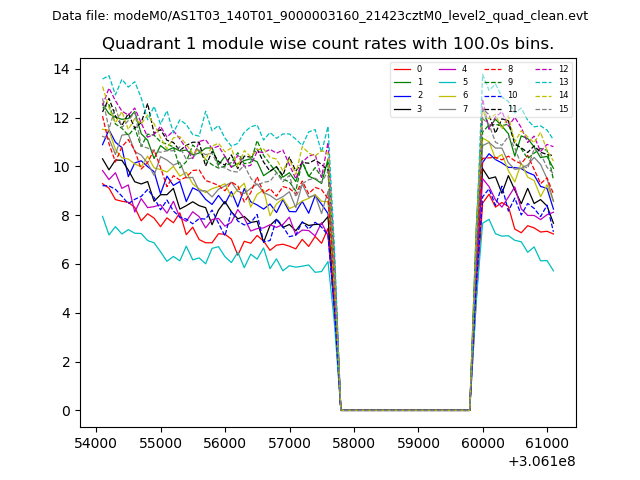
| Module-wise count rates for Quadrant A Data is divided into 100 sec bins |
 |
 |
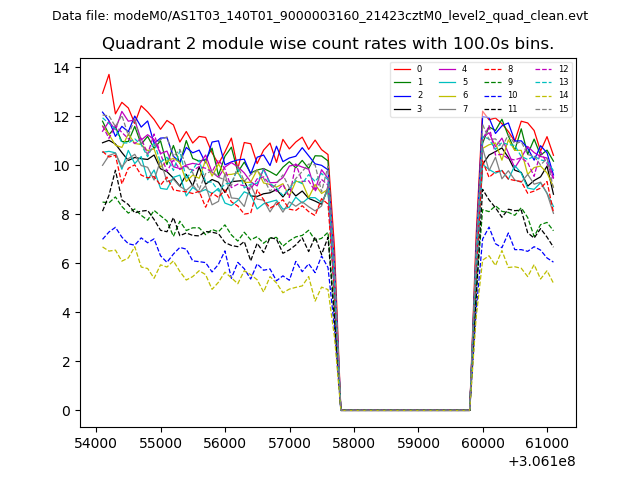
| Module-wise count rates for Quadrant B Data is divided into 100 sec bins |
 |
 |
| Module-wise count rates for Quadrant C Data is divided into 100 sec bins |
 |
 |
| Module-wise count rates for Quadrant D Data is divided into 100 sec bins |
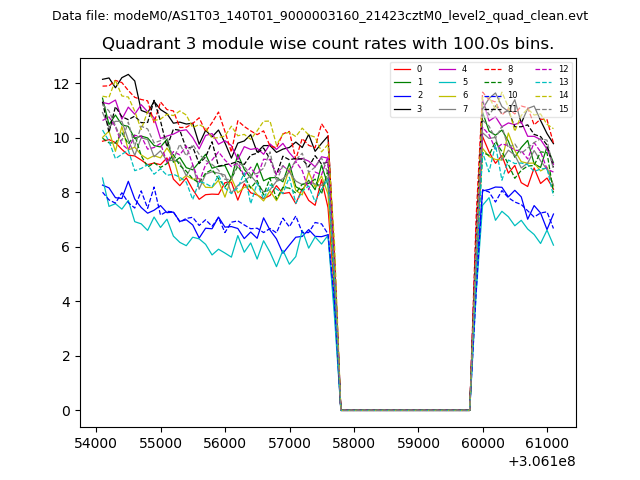 |
 |
| Parameter | Plot |
|---|---|
| CZT HV Monitor | 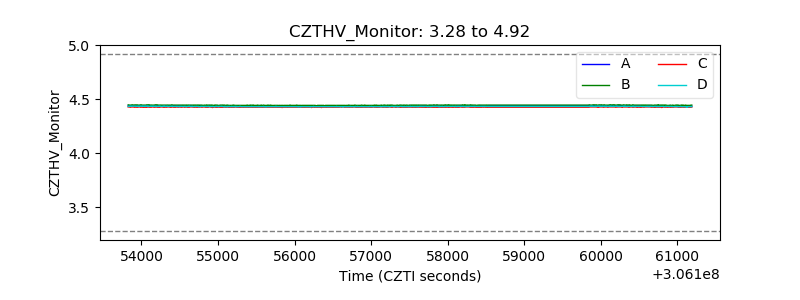 |
| D_VDD | 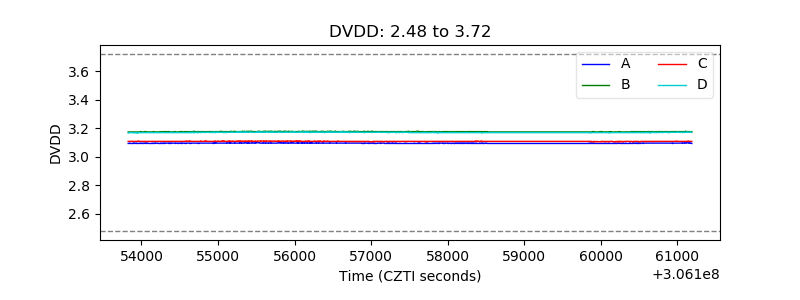 |
| Temperature 1 | 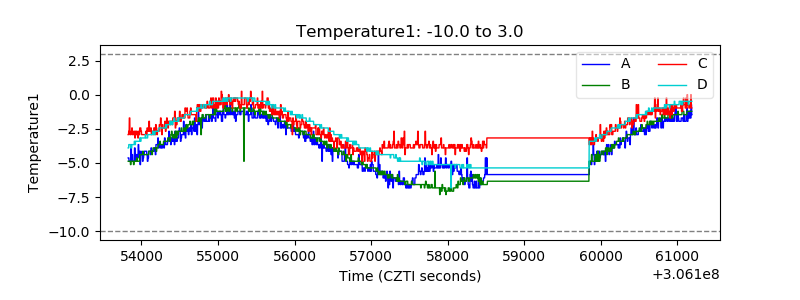 |
| Veto HV Monitor | 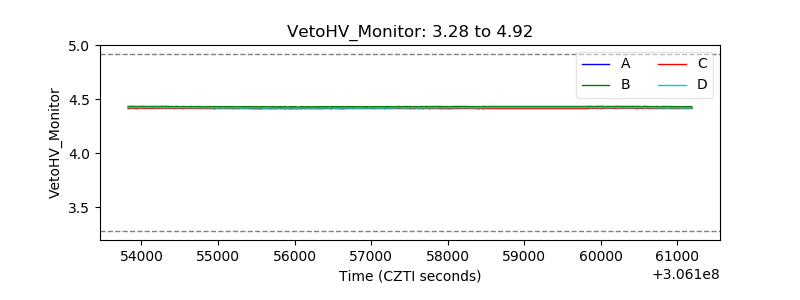 |
| Veto LLD | 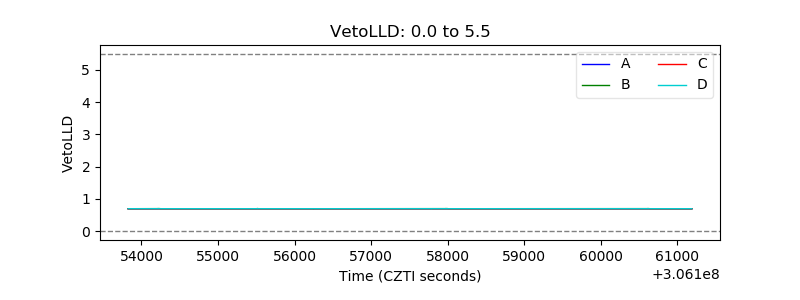 |
| Alpha Counter | 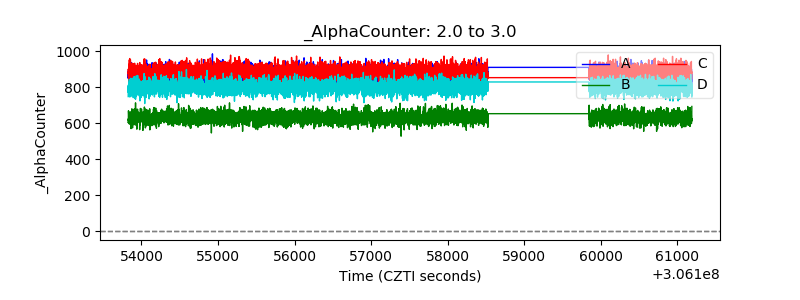 |
| _CPM_Rate | 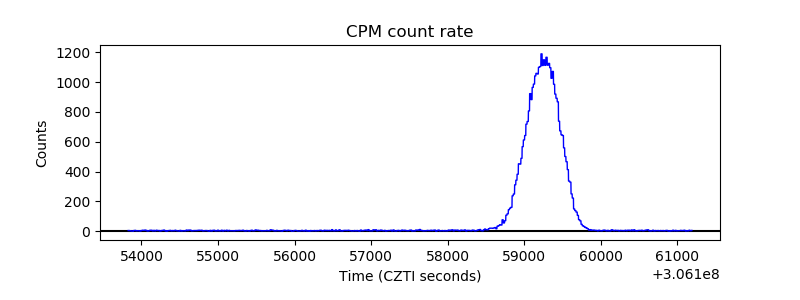 |
| CZT Counter | 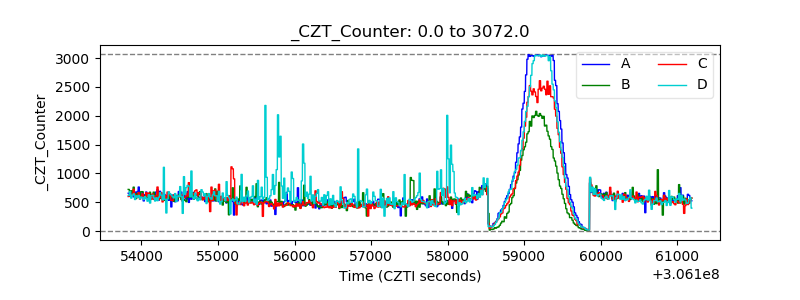 |
| +2.5 Volts monitor |  |
| +5 Volts monitor |  |
| _ROLL_ROT | 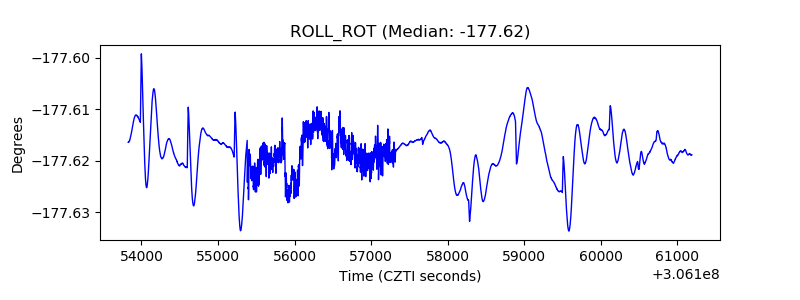 |
| _Roll_DEC |  |
| _Roll_RA | 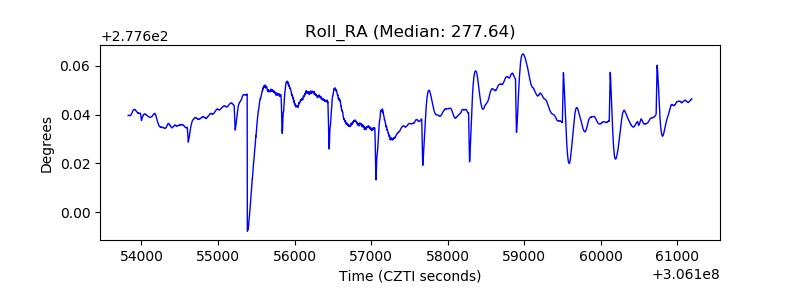 |
| Veto Counter | 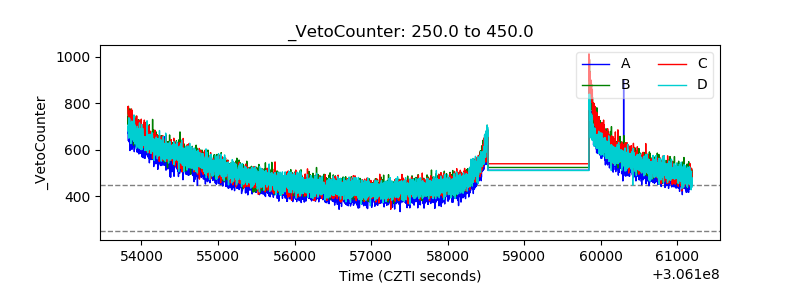 |