| Param | Original file | Final file |
|---|---|---|
| Filename | modeM0/AS1T03_140T01_9000003160_21424cztM0_level2.evt | modeM0/AS1T03_140T01_9000003160_21424cztM0_level2_quad_clean.evt |
| Size (bytes) | 505,244,160 | 114,068,160 |
| Size | 481.8 MB | 108.8 MB |
| Events in quadrant A | 3,504,783 | 767,220 |
| Events in quadrant B | 3,440,238 | 767,165 |
| Events in quadrant C | 3,667,002 | 735,560 |
| Events in quadrant D | 4,235,989 | 718,887 |
| Mode SS | |||
|---|---|---|---|
| Quadrant | BADHDUFLAG | Total packets | Discarded packets |
| A | 0 | 136 | 0 |
| B | 0 | 136 | 0 |
| C | 0 | 136 | 0 |
| D | 0 | 136 | 0 |
| Mode M0 | |||
|---|---|---|---|
| Quadrant | BADHDUFLAG | Total packets | Discarded packets |
| A | 0 | 14458 | 2 |
| B | 0 | 14379 | 2 |
| C | 0 | 15151 | 2 |
| D | 0 | 16882 | 2 |
| Mode M9 | |||
|---|---|---|---|
| Quadrant | BADHDUFLAG | Total packets | Discarded packets |
| A | 0 | 11 | 0 |
| B | 0 | 11 | 0 |
| C | 0 | 11 | 0 |
| D | 0 | 11 | 0 |
| Quadrant | Total seconds | Saturated seconds | Saturation percentage |
|---|---|---|---|
| A | 6682 | 90 | 1.346902% |
| B | 6683 | 81 | 1.212031% |
| C | 6682 | 112 | 1.676145% |
| D | 6682 | 144 | 2.155043% |
Noise dominated data is calculated using 1-second bins in cleaned event files. If a bin has >2000 counts, and if more than 50% of those come from <1% of pixels, then it is considered to be noise-dominated and hence unusable.
| Quadrant | # 1 sec bins | Bins with >0 counts | Bins with >2000 counts | High rate bins dominated by noise | Noise dominated (total time) | Noise dominated (detector-on time) | Marked lightcurve |
|---|---|---|---|---|---|---|---|
| A | 7827 | 6682 | 0 | 0 | 0.00% | 0.00% | 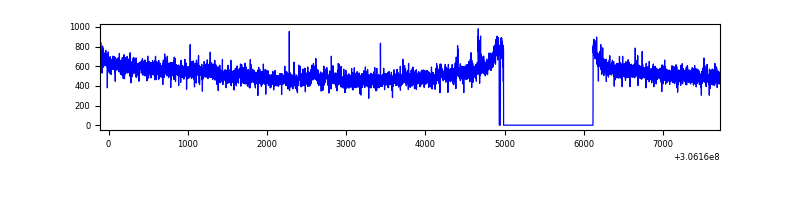 |
| B | 7828 | 6683 | 3 | 3 | 0.04% | 0.04% | 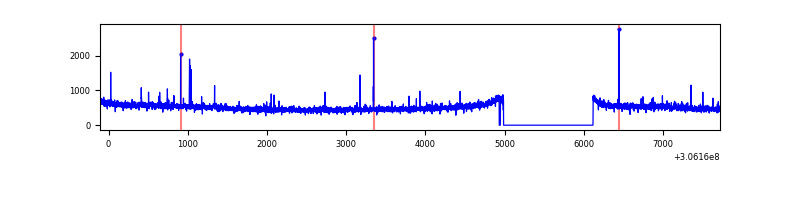 |
| C | 7827 | 6683 | 1 | 1 | 0.01% | 0.01% | 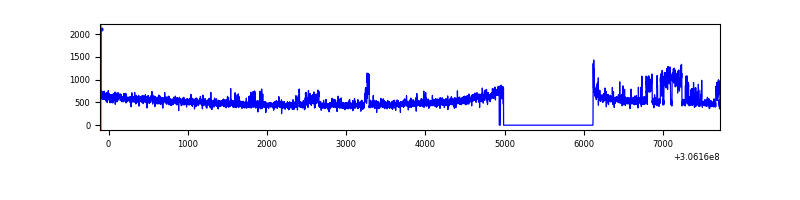 |
| D | 7827 | 6682 | 117 | 117 | 1.49% | 1.75% | 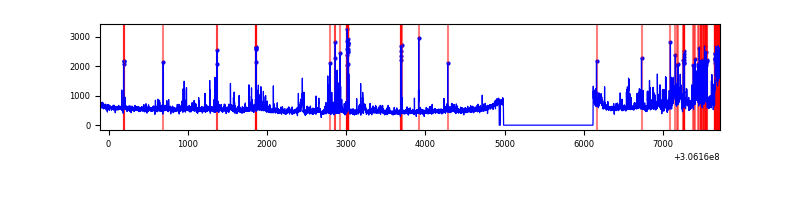 |
Top three noisy pixels from each quadrant. If the there are fewer than three noisy pixels in the level2.evt file, extra rows are filled as -1
| Pixel properties | Quadrant properties | ||||||
|---|---|---|---|---|---|---|---|
| Quadrant | DetID | PixID | Counts | Sigma | Mean | Median | Sigma |
| A | 5 | 168 | 113294 | 642.53 | 874 | 858 | 175.0 |
| A | 11 | 47 | 18354 | 99.98 | 874 | 858 | 175.0 |
| A | 13 | 254 | 10995 | 57.93 | 874 | 858 | 175.0 |
| B | 0 | 190 | 30574 | 183.75 | 859 | 840 | 161.8 |
| B | 0 | 230 | 19552 | 115.64 | 859 | 840 | 161.8 |
| B | 12 | 111 | 18653 | 110.08 | 859 | 840 | 161.8 |
| C | 3 | 233 | 312716 | 1657.44 | 820 | 827 | 188.2 |
| C | 14 | 238 | 129231 | 682.37 | 820 | 827 | 188.2 |
| C | 10 | 91 | 21297 | 108.78 | 820 | 827 | 188.2 |
| D | 1 | 52 | 369193 | 1820.09 | 842 | 819 | 202.4 |
| D | 14 | 35 | 179118 | 880.95 | 842 | 819 | 202.4 |
| D | 12 | 235 | 167564 | 823.87 | 842 | 819 | 202.4 |
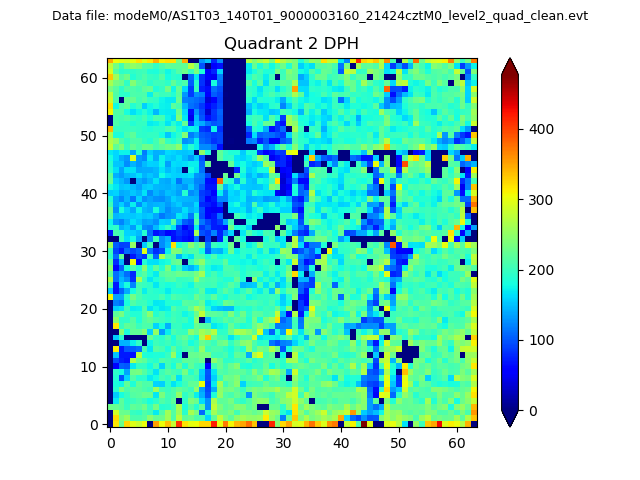
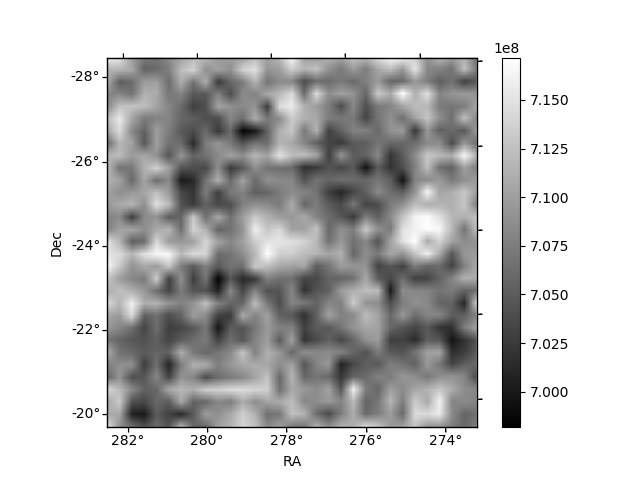
Histogram calculated using DETX and DETY for each event in the final _common_clean file
| Quadrant A | 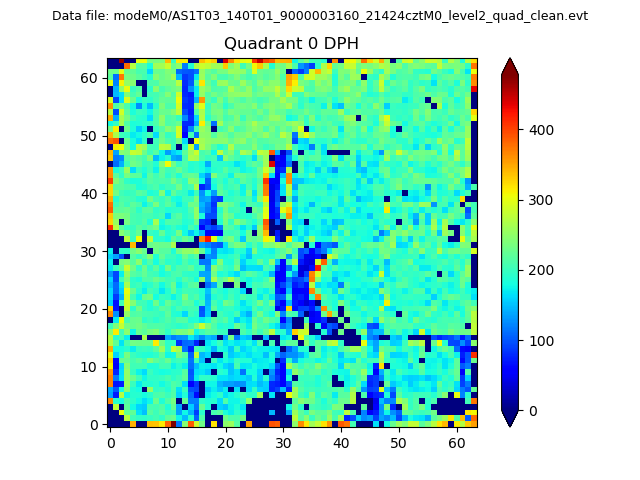 |
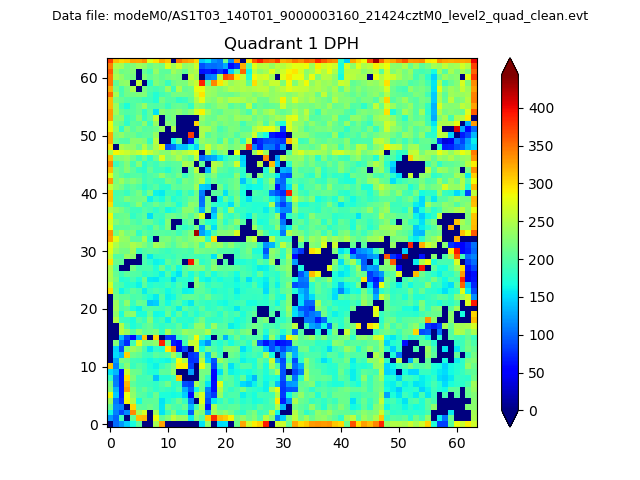 |
Quadrant B |
|---|---|---|---|
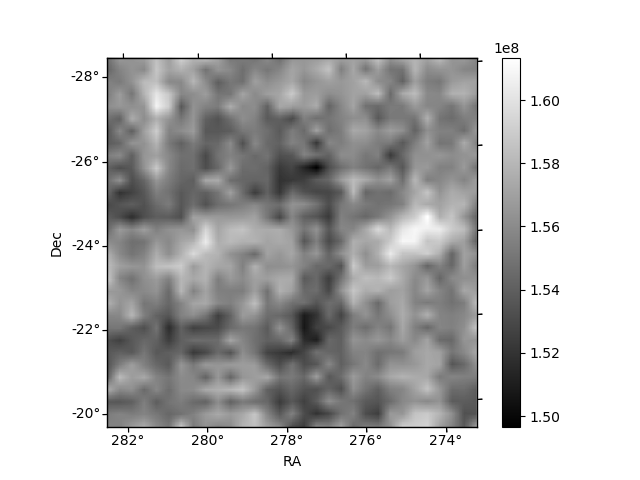
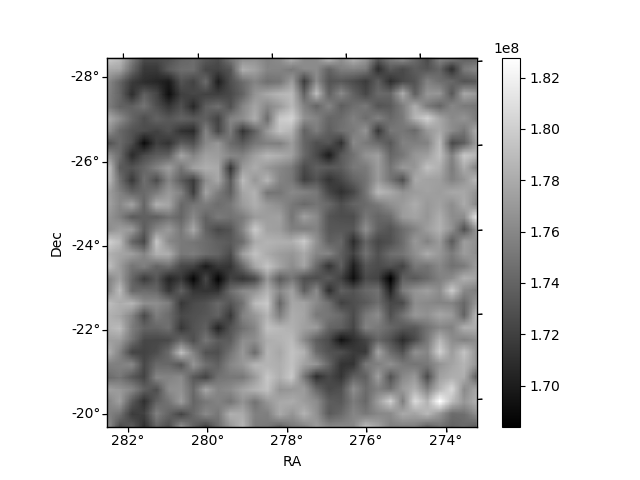
| Quadrant D | 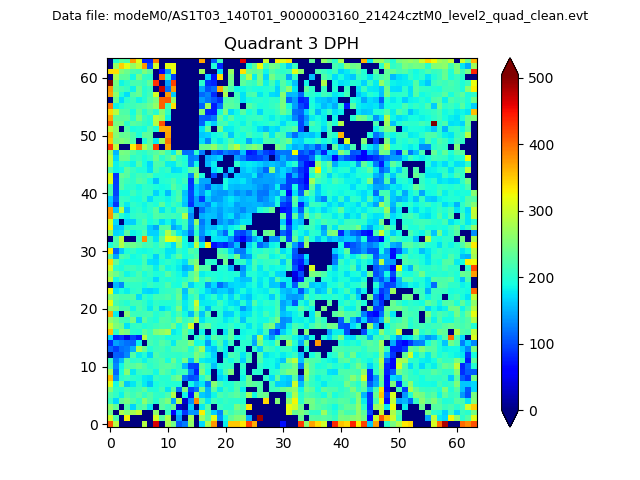 |
 |
Quadrant C |
| Plot type | Count rate plots | Images |
|---|---|---|
| Comparison with Poisson distribution Blue bars denote a histogram of data divided into 1 sec bins. Red curve is a Poisson curve with rate = median count rate of data. |
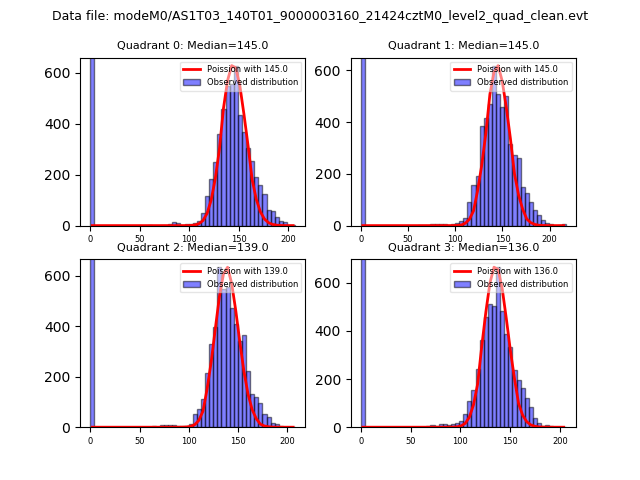 |
 |
| Quadrant-wise count rates Data is divided into 100 sec bins |
 |
|
| Module-wise count rates for Quadrant A Data is divided into 100 sec bins |
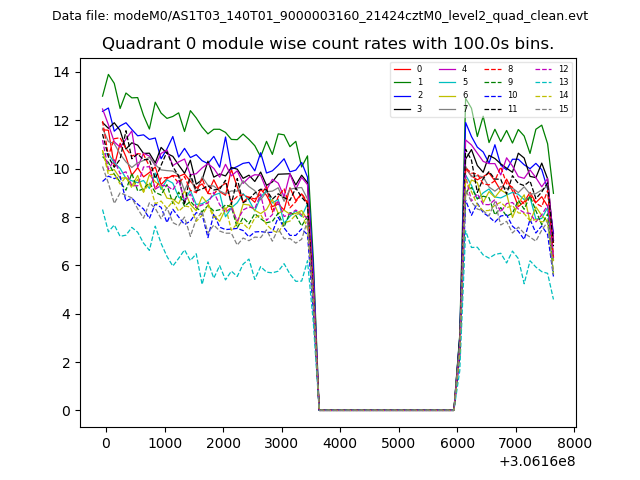 |
 |
| Module-wise count rates for Quadrant B Data is divided into 100 sec bins |
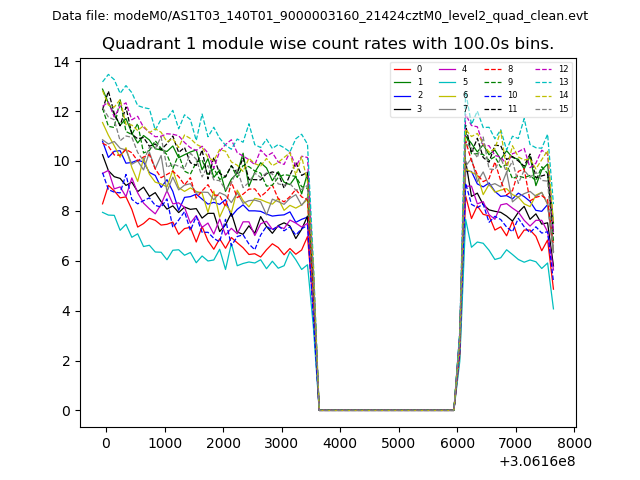 |
 |
| Module-wise count rates for Quadrant C Data is divided into 100 sec bins |
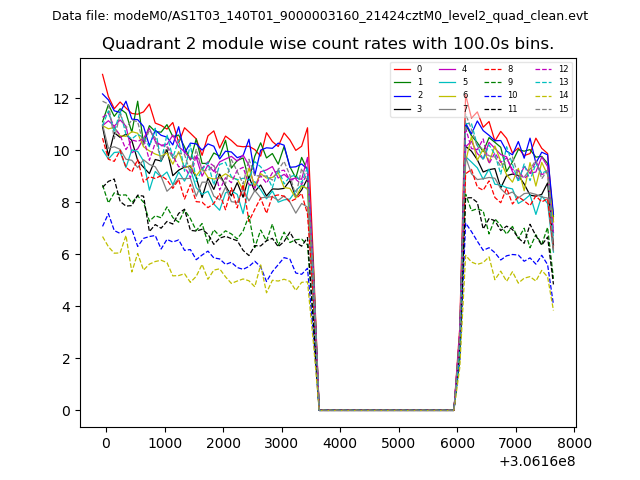 |
 |
| Module-wise count rates for Quadrant D Data is divided into 100 sec bins |
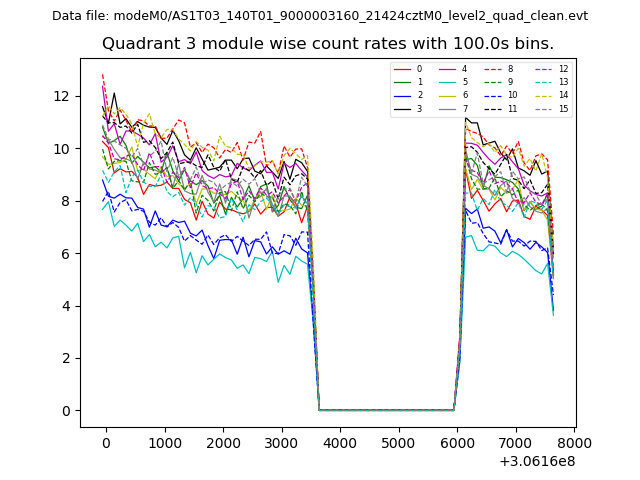 |
 |
| Parameter | Plot |
|---|---|
| CZT HV Monitor | 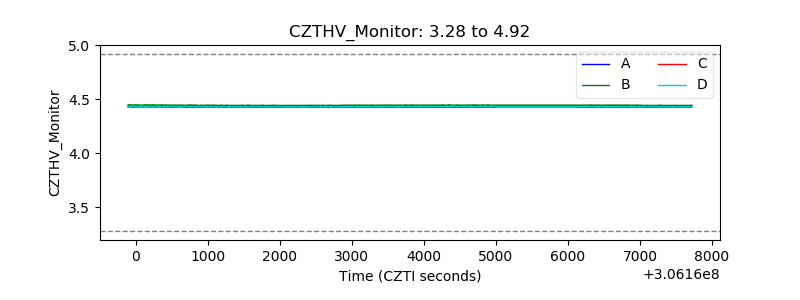 |
| D_VDD | 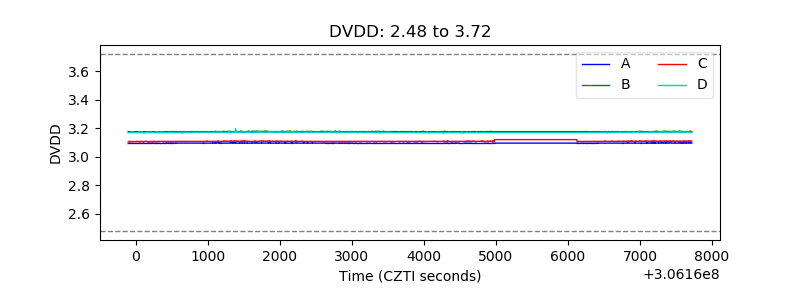 |
| Temperature 1 |  |
| Veto HV Monitor | 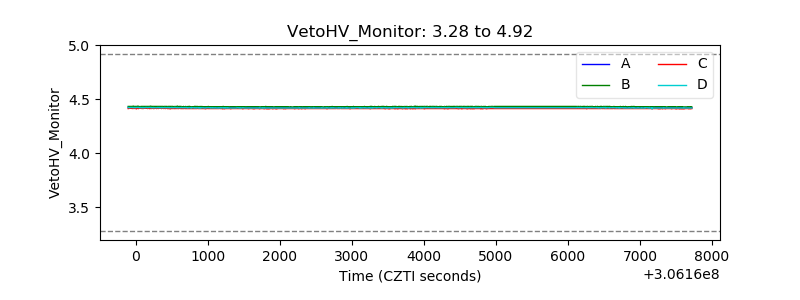 |
| Veto LLD | 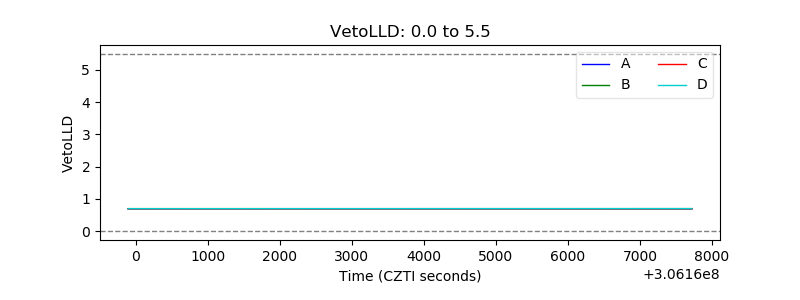 |
| Alpha Counter | 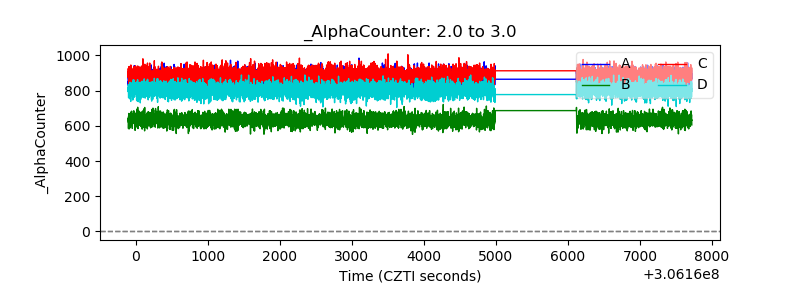 |
| _CPM_Rate | 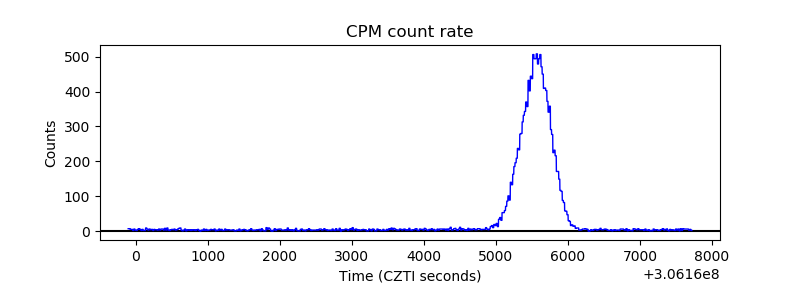 |
| CZT Counter | 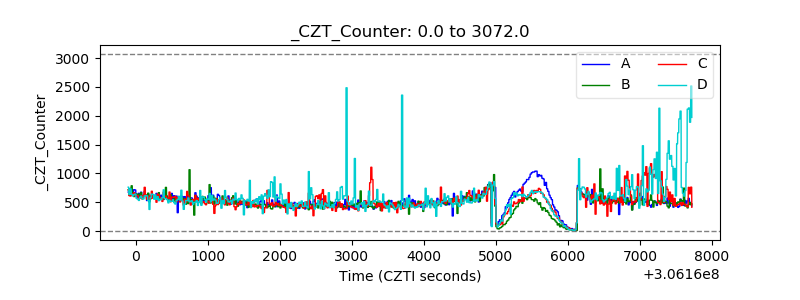 |
| +2.5 Volts monitor |  |
| +5 Volts monitor |  |
| _ROLL_ROT | 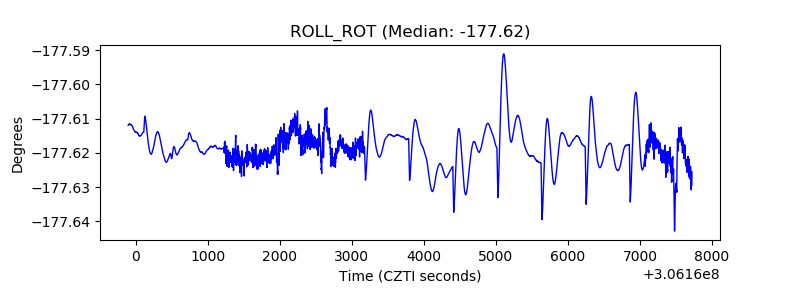 |
| _Roll_DEC | 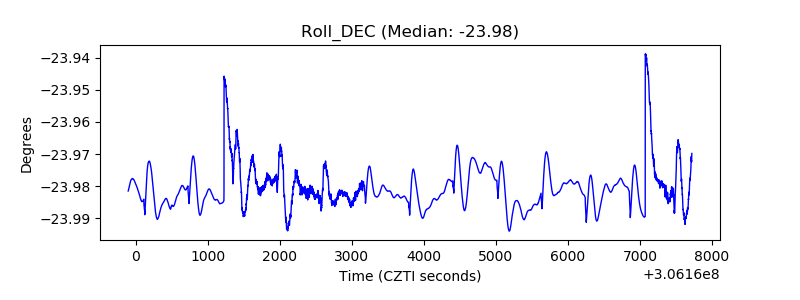 |
| _Roll_RA | 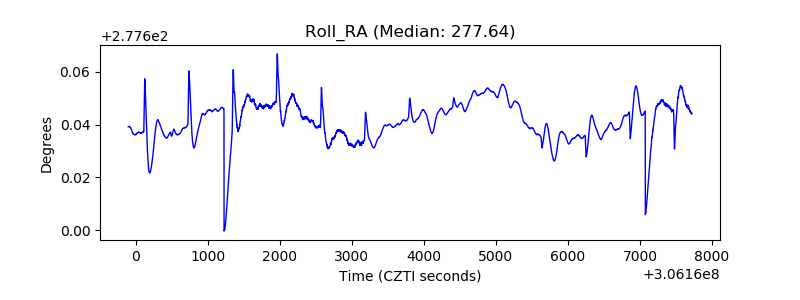 |
| Veto Counter | 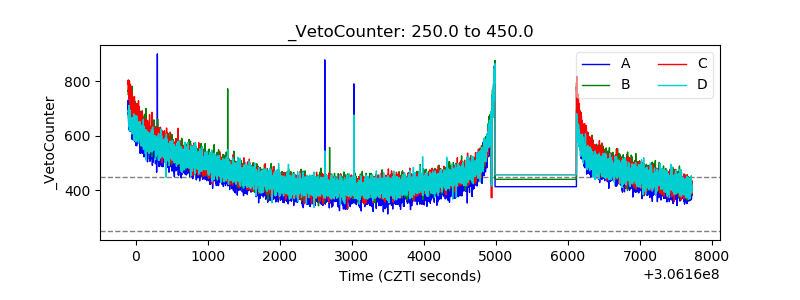 |