| Param | Original file | Final file |
|---|---|---|
| Filename | modeM0/AS1T03_140T01_9000003160_21425cztM0_level2.evt | modeM0/AS1T03_140T01_9000003160_21425cztM0_level2_quad_clean.evt |
| Size (bytes) | 2,019,692,160 | 425,220,480 |
| Size | 1.9 GB | 405.5 MB |
| Events in quadrant A | 13,888,751 | 2,840,988 |
| Events in quadrant B | 13,668,338 | 2,846,163 |
| Events in quadrant C | 13,827,854 | 2,740,962 |
| Events in quadrant D | 18,024,317 | 2,659,976 |
| Mode SS | |||
|---|---|---|---|
| Quadrant | BADHDUFLAG | Total packets | Discarded packets |
| A | 0 | 532 | 0 |
| B | 0 | 532 | 0 |
| C | 0 | 532 | 0 |
| D | 0 | 532 | 0 |
| Mode M0 | |||
|---|---|---|---|
| Quadrant | BADHDUFLAG | Total packets | Discarded packets |
| A | 0 | 57103 | 9 |
| B | 0 | 56836 | 7 |
| C | 0 | 57541 | 6 |
| D | 0 | 70532 | 6 |
| Mode M9 | |||
|---|---|---|---|
| Quadrant | BADHDUFLAG | Total packets | Discarded packets |
| A | 0 | 58 | 0 |
| B | 0 | 58 | 0 |
| C | 0 | 58 | 0 |
| D | 0 | 58 | 0 |
| Quadrant | Total seconds | Saturated seconds | Saturation percentage |
|---|---|---|---|
| A | 26062 | 388 | 1.488758% |
| B | 26062 | 417 | 1.600031% |
| C | 26062 | 494 | 1.895480% |
| D | 26063 | 787 | 3.019606% |
Noise dominated data is calculated using 1-second bins in cleaned event files. If a bin has >2000 counts, and if more than 50% of those come from <1% of pixels, then it is considered to be noise-dominated and hence unusable.
| Quadrant | # 1 sec bins | Bins with >0 counts | Bins with >2000 counts | High rate bins dominated by noise | Noise dominated (total time) | Noise dominated (detector-on time) | Marked lightcurve |
|---|---|---|---|---|---|---|---|
| A | 31893 | 26063 | 0 | 0 | 0.00% | 0.00% | 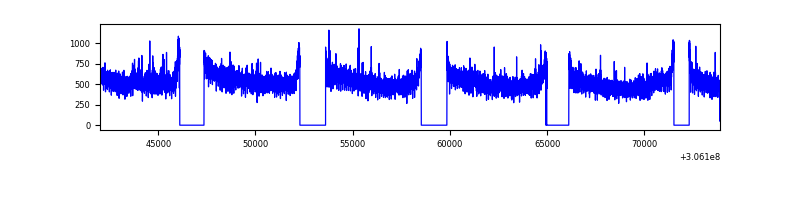 |
| B | 31893 | 26063 | 16 | 16 | 0.05% | 0.06% | 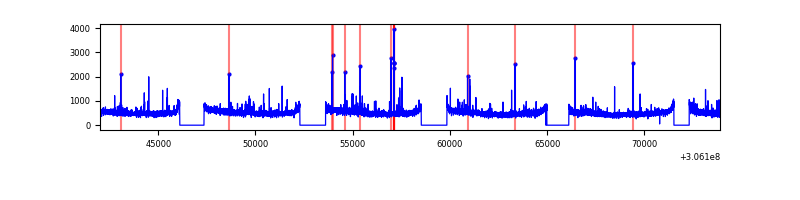 |
| C | 31893 | 26066 | 1 | 1 | 0.00% | 0.00% | 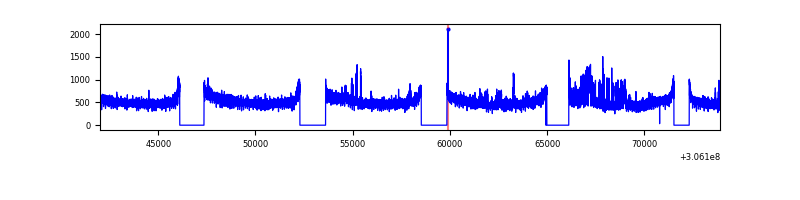 |
| D | 31893 | 26064 | 671 | 671 | 2.10% | 2.57% | 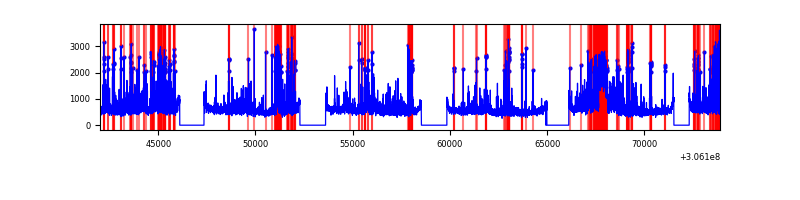 |
Top three noisy pixels from each quadrant. If the there are fewer than three noisy pixels in the level2.evt file, extra rows are filled as -1
| Pixel properties | Quadrant properties | ||||||
|---|---|---|---|---|---|---|---|
| Quadrant | DetID | PixID | Counts | Sigma | Mean | Median | Sigma |
| A | 5 | 168 | 500543 | 730.83 | 3441 | 3374 | 680.3 |
| A | 11 | 47 | 127299 | 182.17 | 3441 | 3374 | 680.3 |
| A | 13 | 254 | 40837 | 55.07 | 3441 | 3374 | 680.3 |
| B | 0 | 190 | 141495 | 218.39 | 3393 | 3318 | 632.7 |
| B | 0 | 230 | 111067 | 170.3 | 3393 | 3318 | 632.7 |
| B | 12 | 111 | 73509 | 110.94 | 3393 | 3318 | 632.7 |
| C | 3 | 233 | 630230 | 841.03 | 3242 | 3269 | 745.5 |
| C | 14 | 238 | 514547 | 685.85 | 3242 | 3269 | 745.5 |
| C | 10 | 91 | 48322 | 60.44 | 3242 | 3269 | 745.5 |
| D | 1 | 52 | 1759907 | 2211.84 | 3314 | 3232 | 794.2 |
| D | 1 | 20 | 845236 | 1060.17 | 3314 | 3232 | 794.2 |
| D | 7 | 38 | 753271 | 944.38 | 3314 | 3232 | 794.2 |
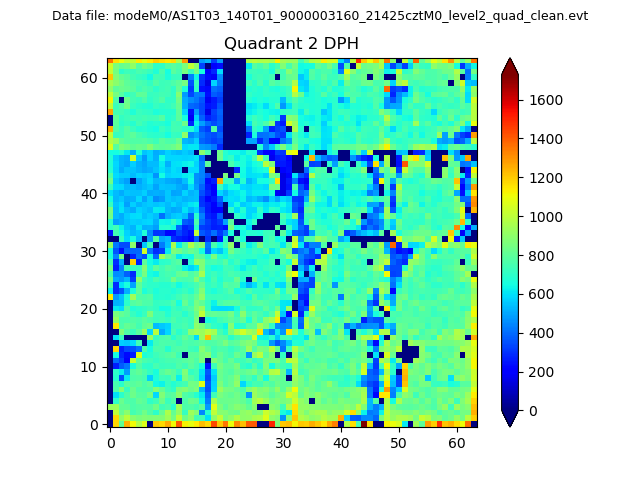
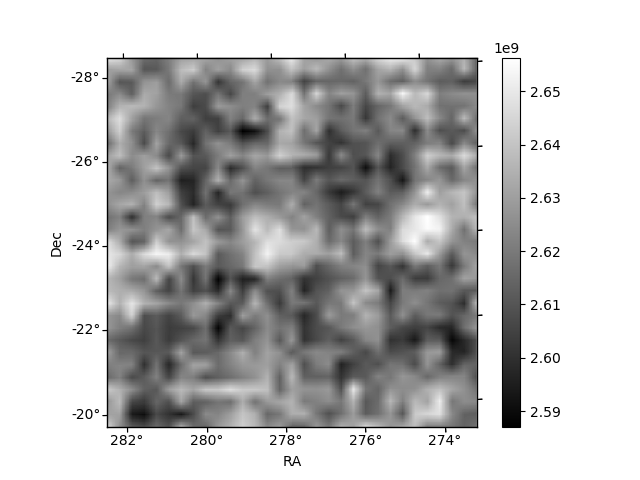
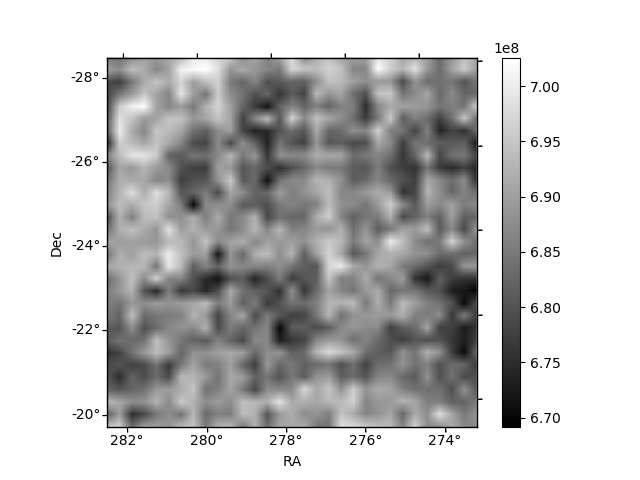
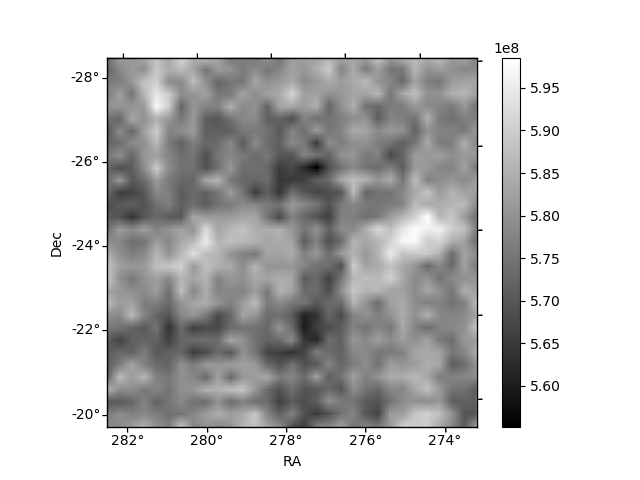
Histogram calculated using DETX and DETY for each event in the final _common_clean file
| Quadrant A | 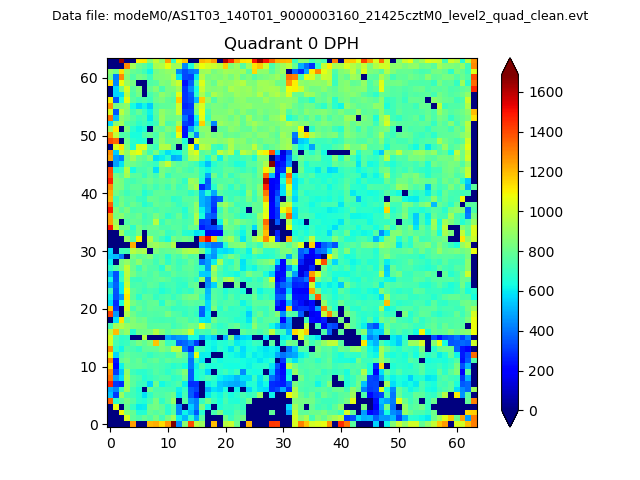 |
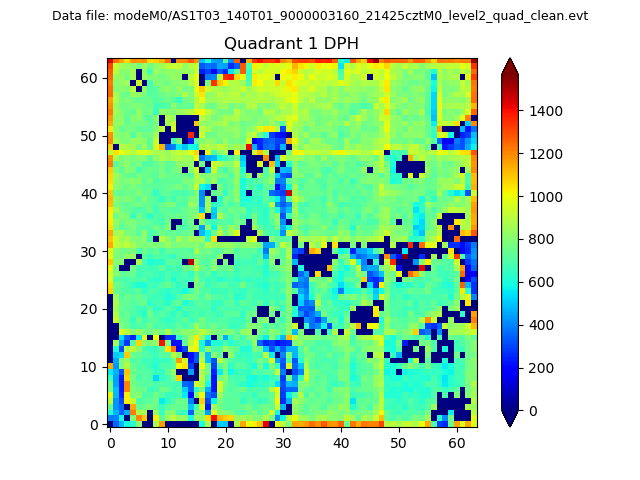 |
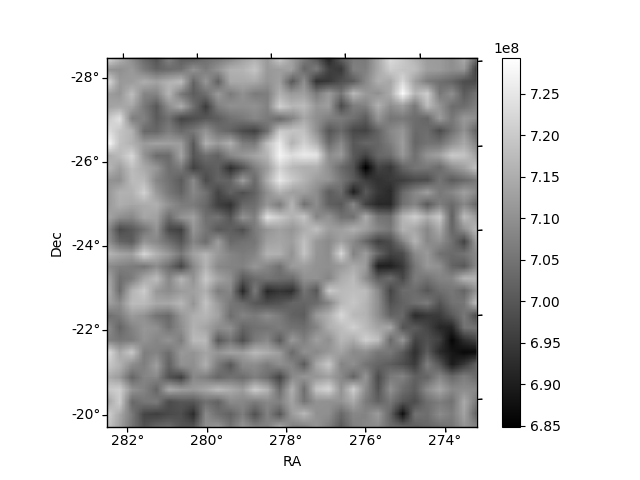
Quadrant B |
|---|---|---|---|
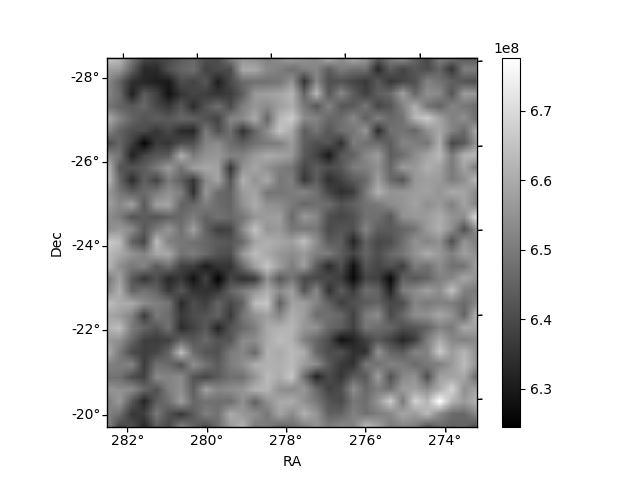
| Quadrant D | 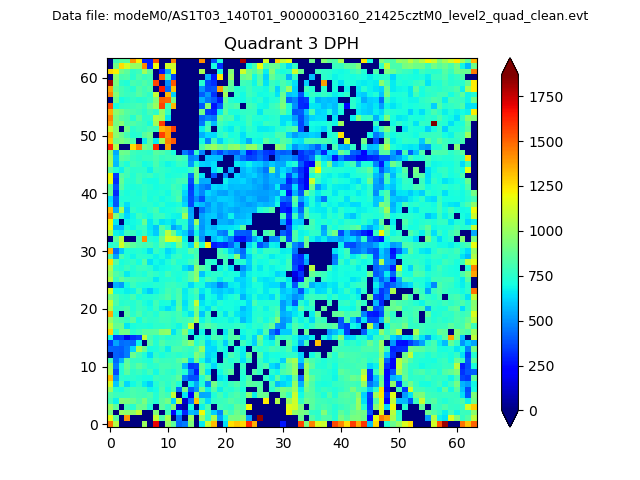 |
 |
Quadrant C |
| Plot type | Count rate plots | Images |
|---|---|---|
| Comparison with Poisson distribution Blue bars denote a histogram of data divided into 1 sec bins. Red curve is a Poisson curve with rate = median count rate of data. |
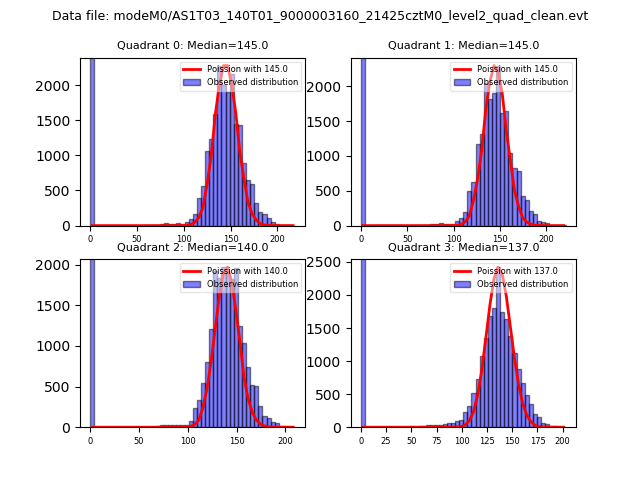 |
 |
| Quadrant-wise count rates Data is divided into 100 sec bins |
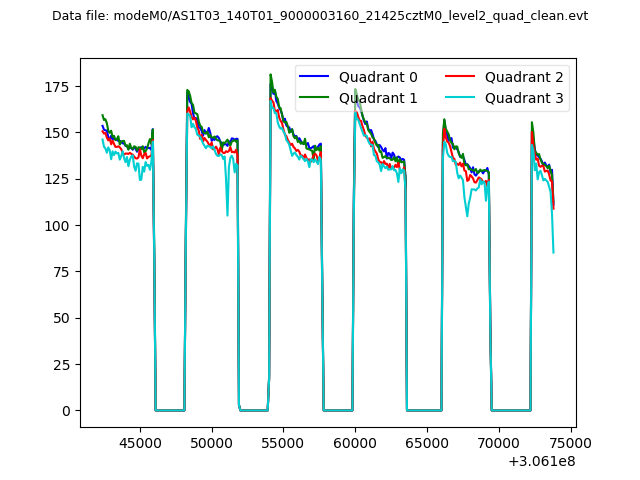 |
|
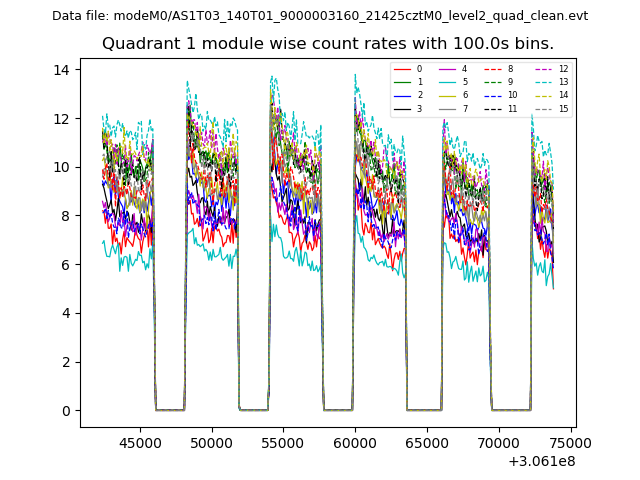
| Module-wise count rates for Quadrant A Data is divided into 100 sec bins |
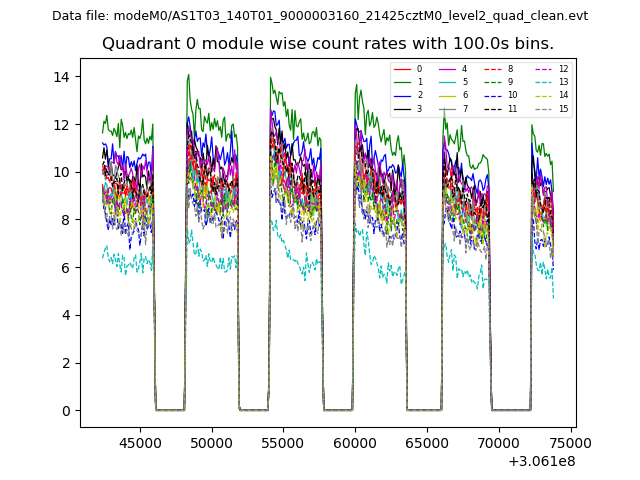 |
 |
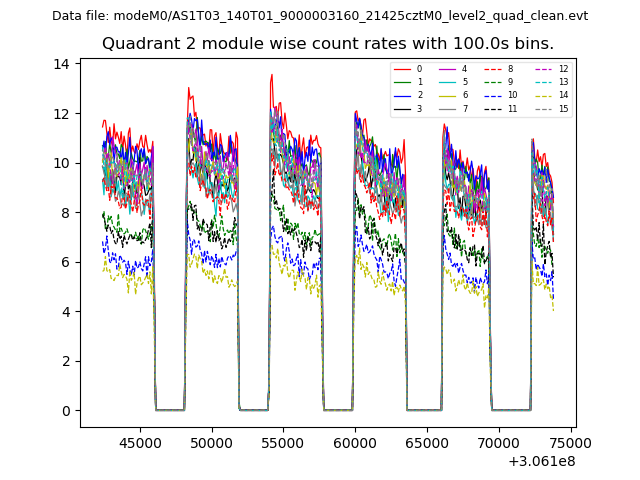
| Module-wise count rates for Quadrant B Data is divided into 100 sec bins |
 |
 |
| Module-wise count rates for Quadrant C Data is divided into 100 sec bins |
 |
 |
| Module-wise count rates for Quadrant D Data is divided into 100 sec bins |
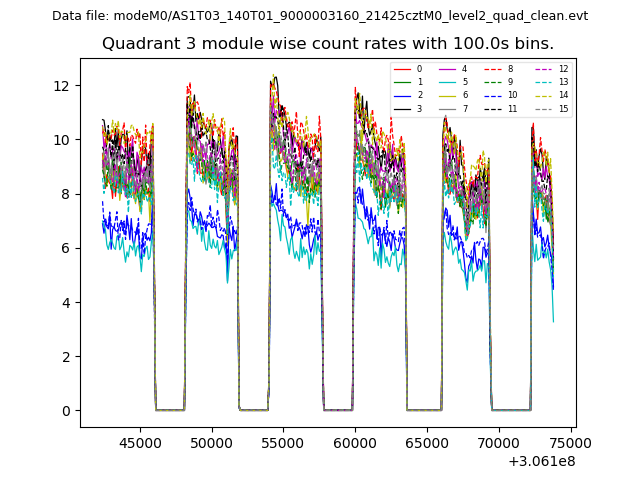 |
 |
| Parameter | Plot |
|---|---|
| CZT HV Monitor | 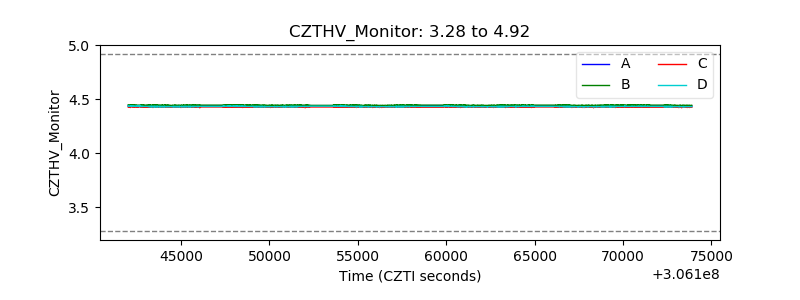 |
| D_VDD | 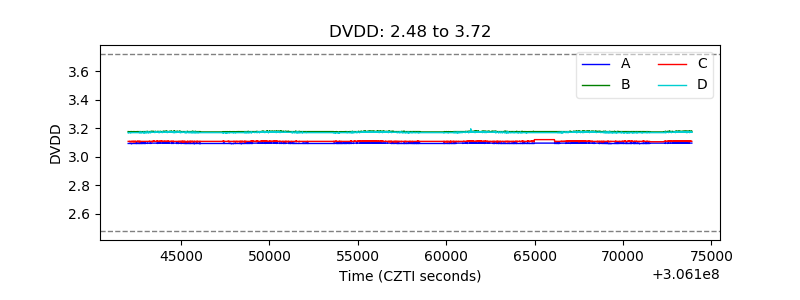 |
| Temperature 1 | 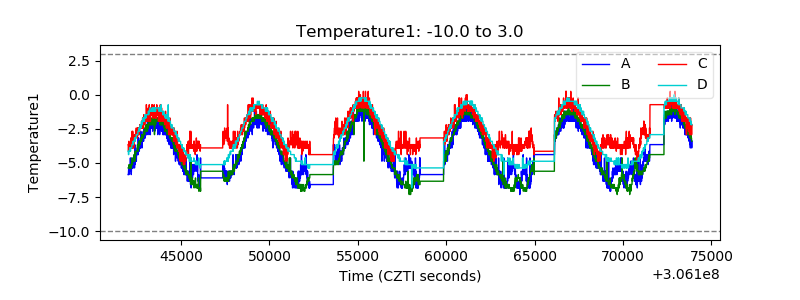 |
| Veto HV Monitor | 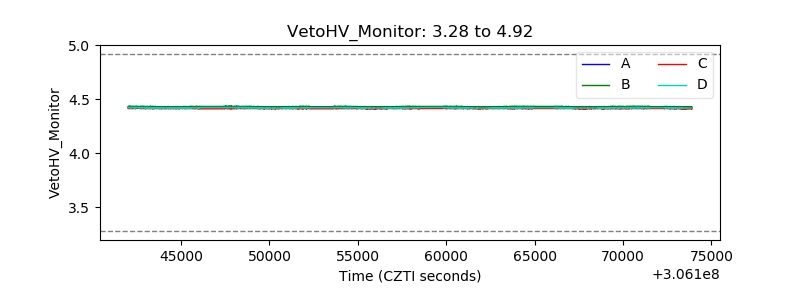 |
| Veto LLD | 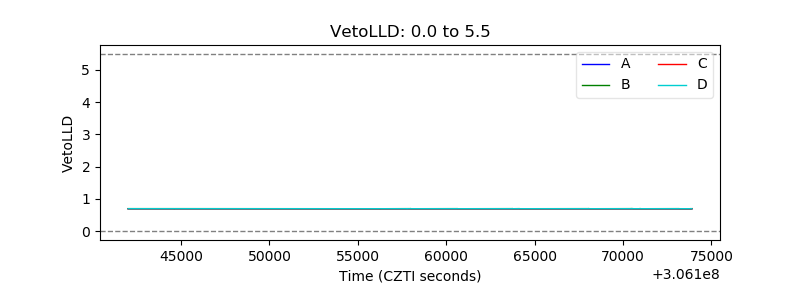 |
| Alpha Counter | 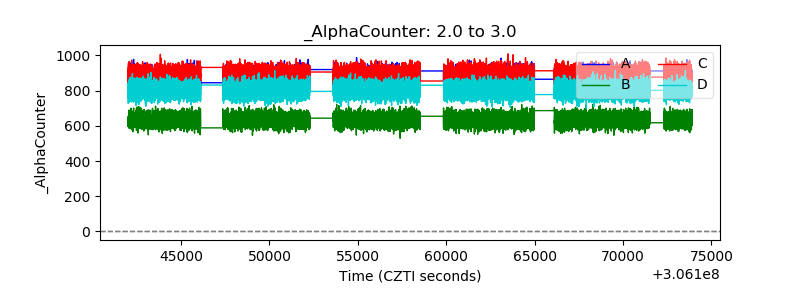 |
| _CPM_Rate | 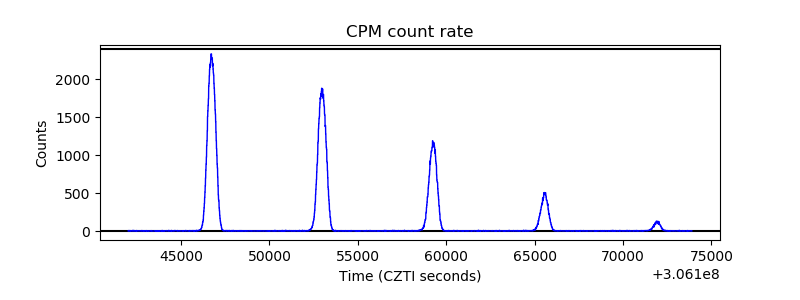 |
| CZT Counter | 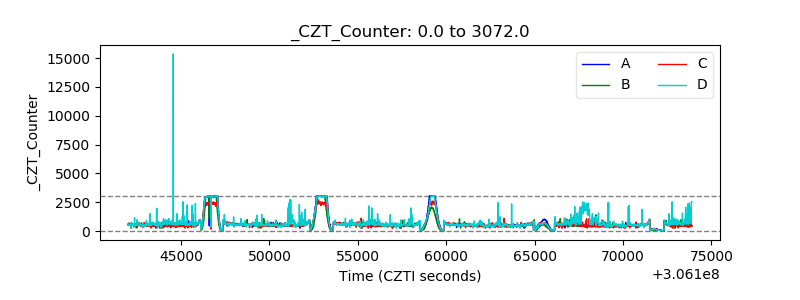 |
| +2.5 Volts monitor |  |
| +5 Volts monitor |  |
| _ROLL_ROT | 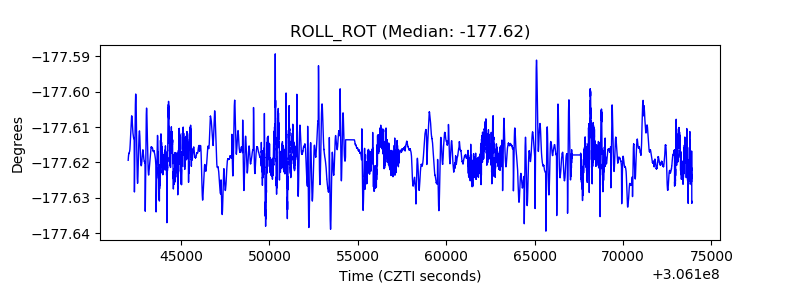 |
| _Roll_DEC | 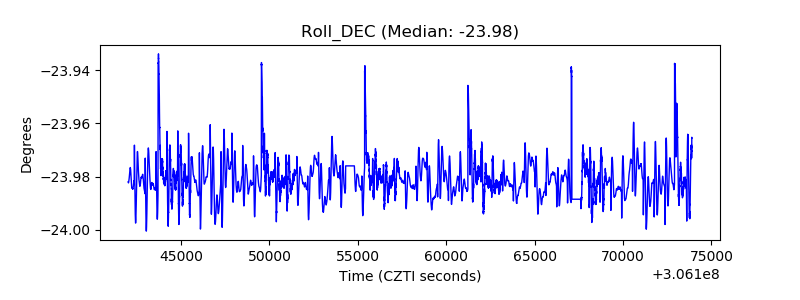 |
| _Roll_RA | 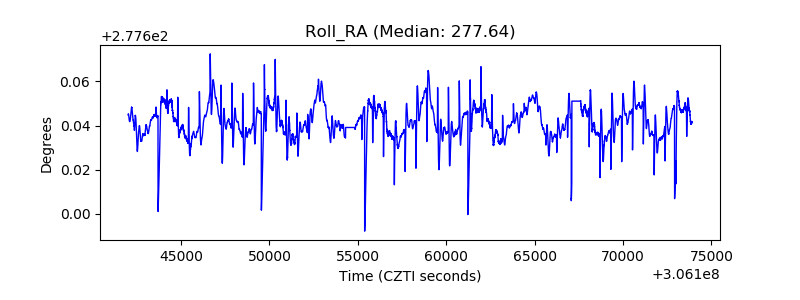 |
| Veto Counter | 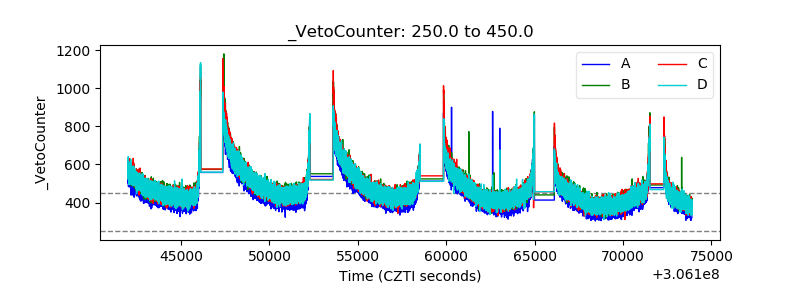 |