| Param | Original file | Final file |
|---|---|---|
| Filename | modeM0/AS1T03_140T01_9000003160_21426cztM0_level2.evt | modeM0/AS1T03_140T01_9000003160_21426cztM0_level2_quad_clean.evt |
| Size (bytes) | 535,870,080 | 101,632,320 |
| Size | 511.0 MB | 96.9 MB |
| Events in quadrant A | 3,527,232 | 658,874 |
| Events in quadrant B | 3,598,060 | 664,366 |
| Events in quadrant C | 3,445,809 | 643,312 |
| Events in quadrant D | 5,168,442 | 609,010 |
| Mode SS | |||
|---|---|---|---|
| Quadrant | BADHDUFLAG | Total packets | Discarded packets |
| A | 0 | 148 | 0 |
| B | 0 | 148 | 0 |
| C | 0 | 148 | 0 |
| D | 0 | 148 | 0 |
| Mode M0 | |||
|---|---|---|---|
| Quadrant | BADHDUFLAG | Total packets | Discarded packets |
| A | 0 | 15031 | 2 |
| B | 0 | 15290 | 3 |
| C | 0 | 14956 | 2 |
| D | 0 | 20194 | 2 |
| Mode M9 | |||
|---|---|---|---|
| Quadrant | BADHDUFLAG | Total packets | Discarded packets |
| A | 0 | 4 | 0 |
| B | 0 | 4 | 0 |
| C | 0 | 4 | 0 |
| D | 0 | 4 | 0 |
| Quadrant | Total seconds | Saturated seconds | Saturation percentage |
|---|---|---|---|
| A | 7208 | 31 | 0.430078% |
| B | 7207 | 48 | 0.666019% |
| C | 7207 | 48 | 0.666019% |
| D | 7207 | 280 | 3.885112% |
Noise dominated data is calculated using 1-second bins in cleaned event files. If a bin has >2000 counts, and if more than 50% of those come from <1% of pixels, then it is considered to be noise-dominated and hence unusable.
| Quadrant | # 1 sec bins | Bins with >0 counts | Bins with >2000 counts | High rate bins dominated by noise | Noise dominated (total time) | Noise dominated (detector-on time) | Marked lightcurve |
|---|---|---|---|---|---|---|---|
| A | 7678 | 7209 | 0 | 0 | 0.00% | 0.00% | 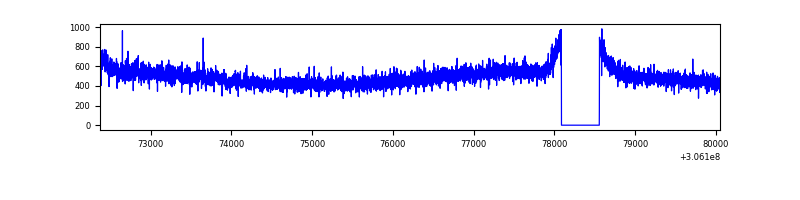 |
| B | 7677 | 7207 | 9 | 9 | 0.12% | 0.12% | 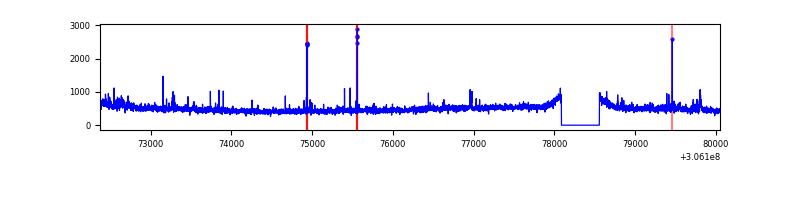 |
| C | 7677 | 7208 | 0 | 0 | 0.00% | 0.00% | 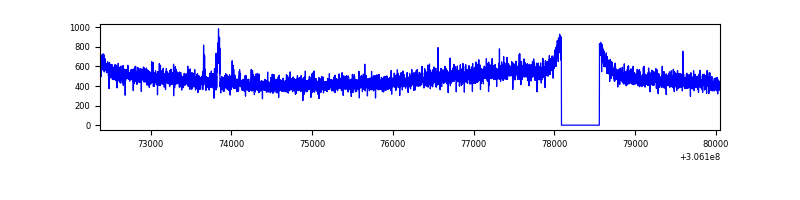 |
| D | 7677 | 7208 | 288 | 288 | 3.75% | 4.00% |  |
Top three noisy pixels from each quadrant. If the there are fewer than three noisy pixels in the level2.evt file, extra rows are filled as -1
| Pixel properties | Quadrant properties | ||||||
|---|---|---|---|---|---|---|---|
| Quadrant | DetID | PixID | Counts | Sigma | Mean | Median | Sigma |
| A | 5 | 168 | 104465 | 583.39 | 885 | 866 | 177.6 |
| A | 13 | 254 | 11035 | 57.26 | 885 | 866 | 177.6 |
| A | 11 | 47 | 10039 | 51.65 | 885 | 866 | 177.6 |
| B | 0 | 230 | 64089 | 374.92 | 879 | 857 | 168.7 |
| B | 0 | 228 | 29999 | 172.79 | 879 | 857 | 168.7 |
| B | 3 | 64 | 27332 | 156.98 | 879 | 857 | 168.7 |
| C | 14 | 238 | 131569 | 667.12 | 841 | 846 | 196.0 |
| C | 3 | 233 | 27774 | 137.42 | 841 | 846 | 196.0 |
| C | 0 | 236 | 9607 | 44.71 | 841 | 846 | 196.0 |
| D | 1 | 20 | 718432 | 3565.76 | 843 | 819 | 201.3 |
| D | 1 | 52 | 358333 | 1776.46 | 843 | 819 | 201.3 |
| D | 7 | 38 | 323361 | 1602.68 | 843 | 819 | 201.3 |
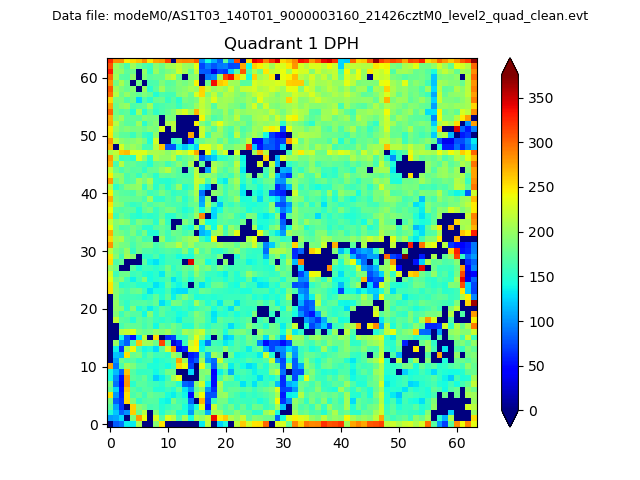
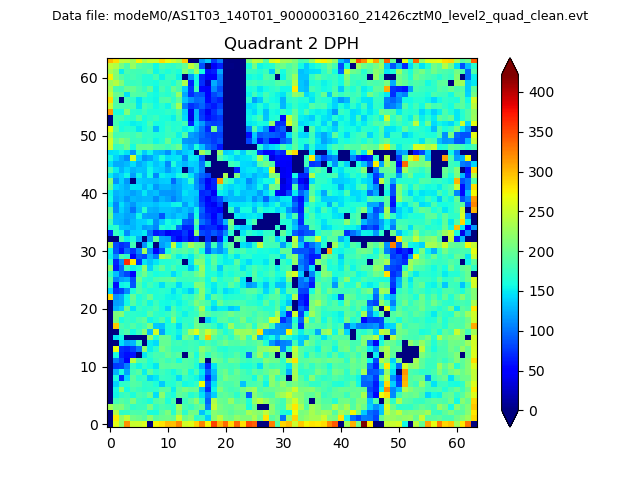
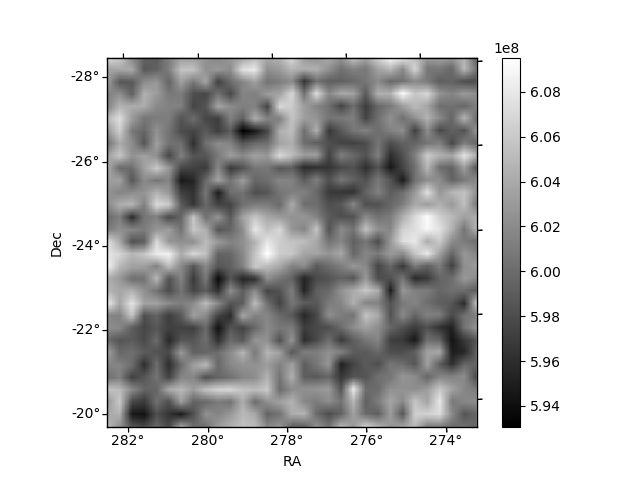
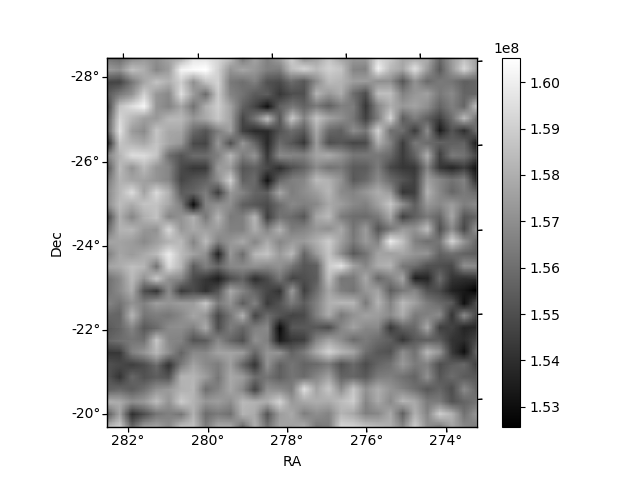
Histogram calculated using DETX and DETY for each event in the final _common_clean file
| Quadrant A | 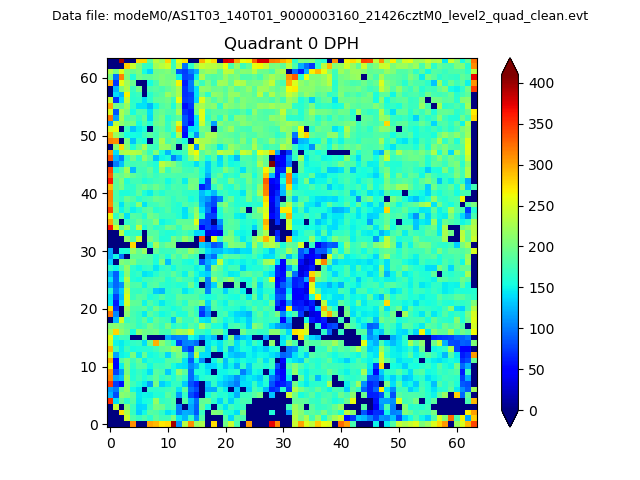 |
 |
Quadrant B |
|---|---|---|---|
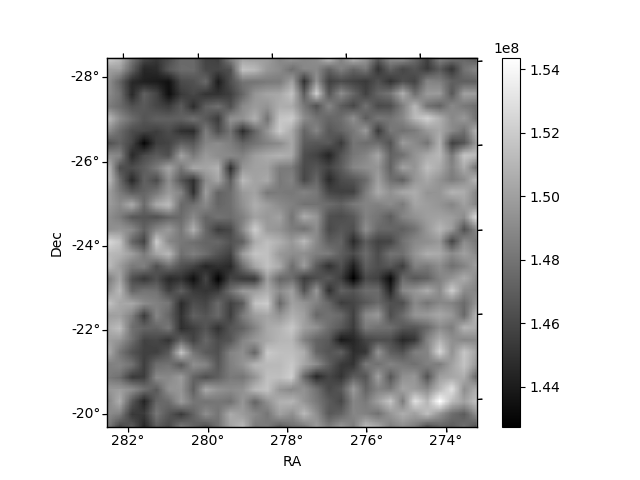
| Quadrant D | 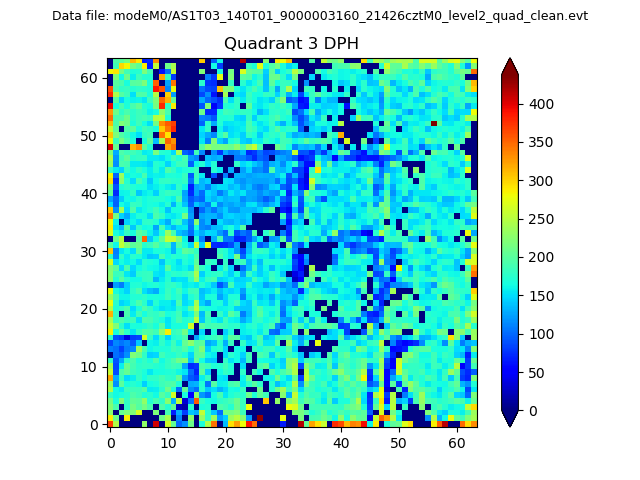 |
 |
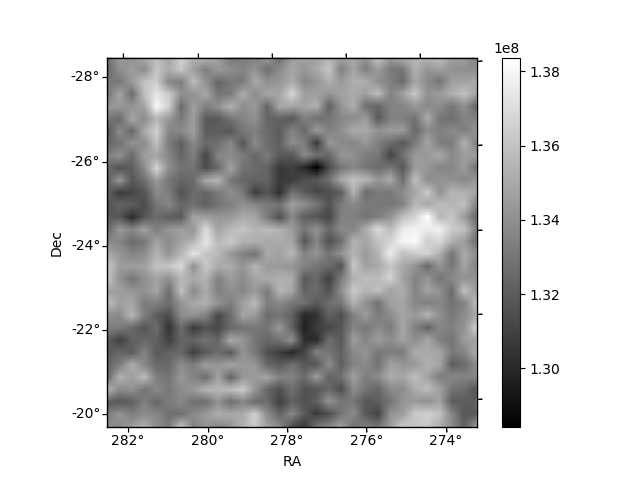
Quadrant C |
| Plot type | Count rate plots | Images |
|---|---|---|
| Comparison with Poisson distribution Blue bars denote a histogram of data divided into 1 sec bins. Red curve is a Poisson curve with rate = median count rate of data. |
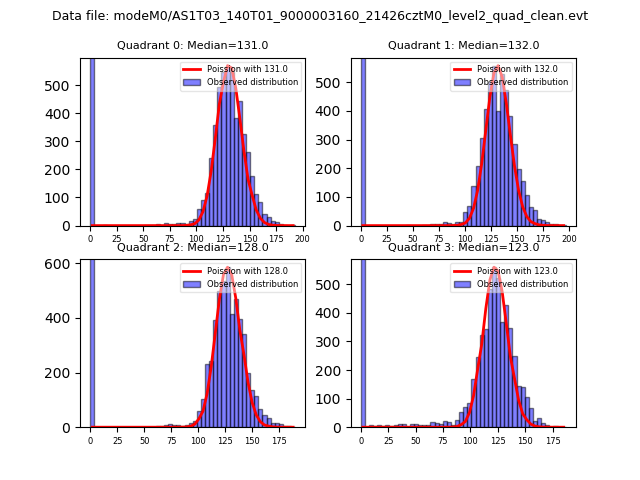 |
 |
| Quadrant-wise count rates Data is divided into 100 sec bins |
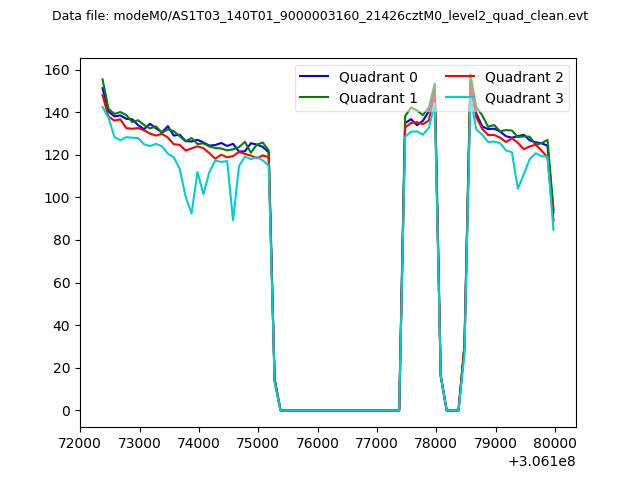 |
|
| Module-wise count rates for Quadrant A Data is divided into 100 sec bins |
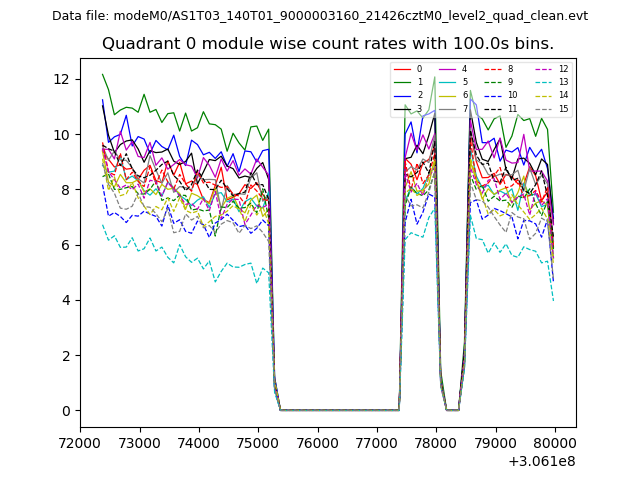 |
 |
| Module-wise count rates for Quadrant B Data is divided into 100 sec bins |
 |
 |
| Module-wise count rates for Quadrant C Data is divided into 100 sec bins |
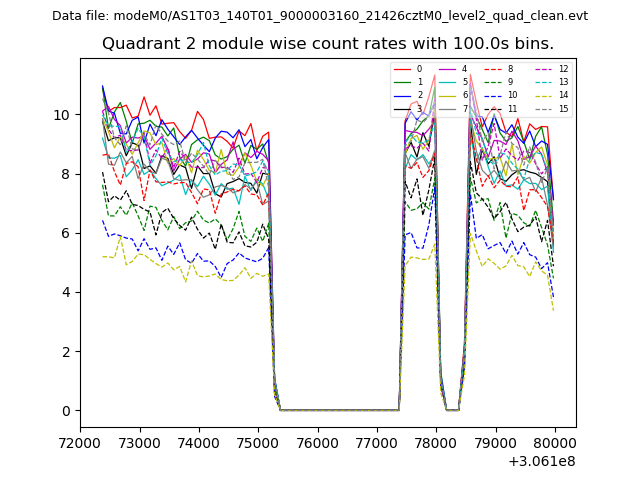 |
 |
| Module-wise count rates for Quadrant D Data is divided into 100 sec bins |
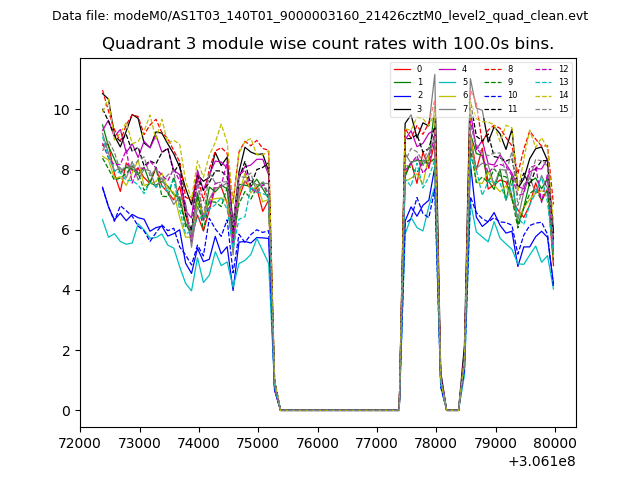 |
 |
| Parameter | Plot |
|---|---|
| CZT HV Monitor | 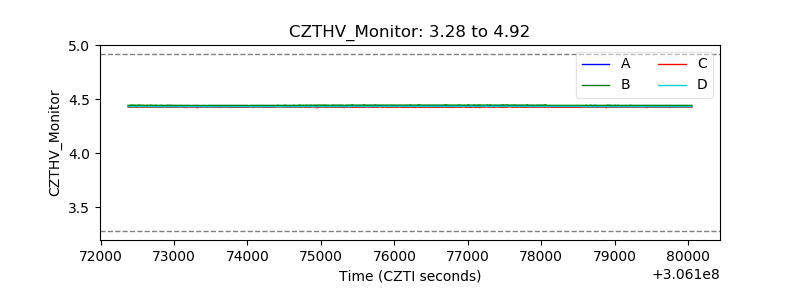 |
| D_VDD | 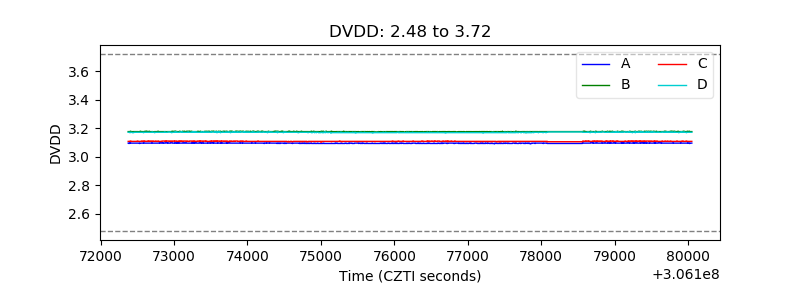 |
| Temperature 1 | 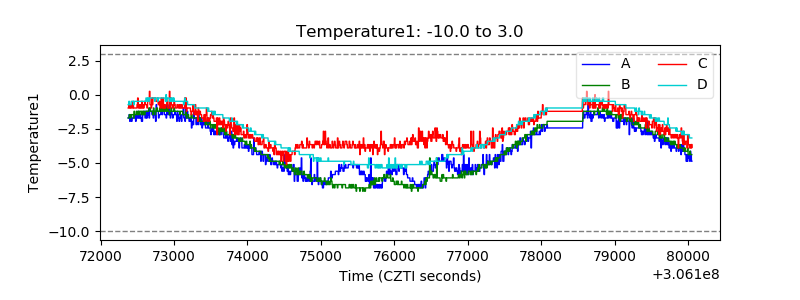 |
| Veto HV Monitor | 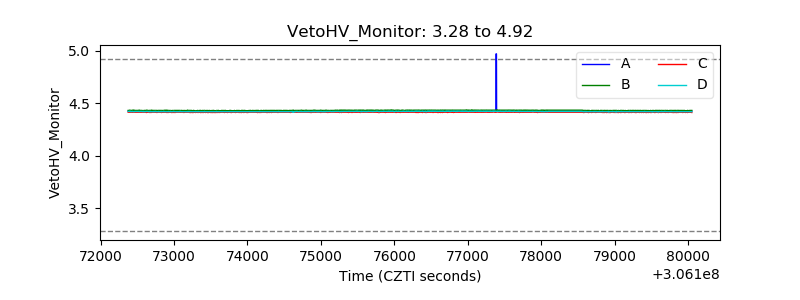 |
| Veto LLD | 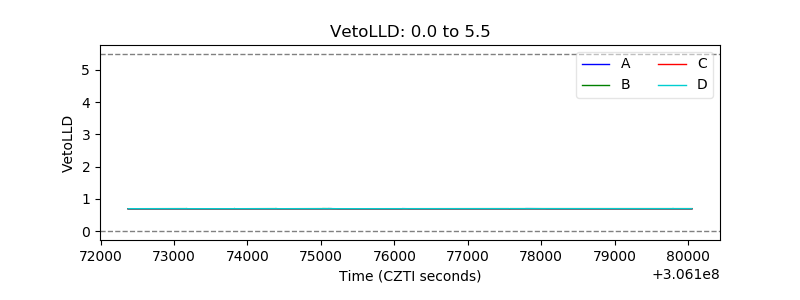 |
| Alpha Counter | 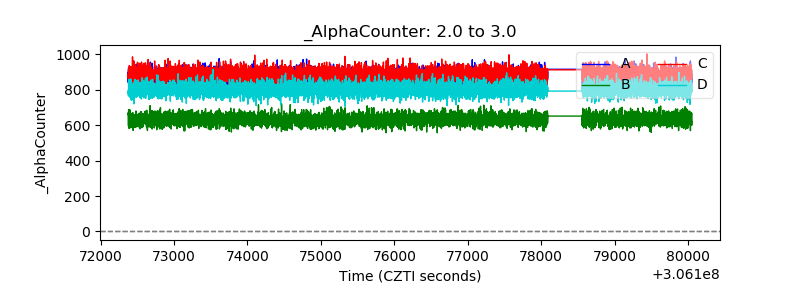 |
| _CPM_Rate | 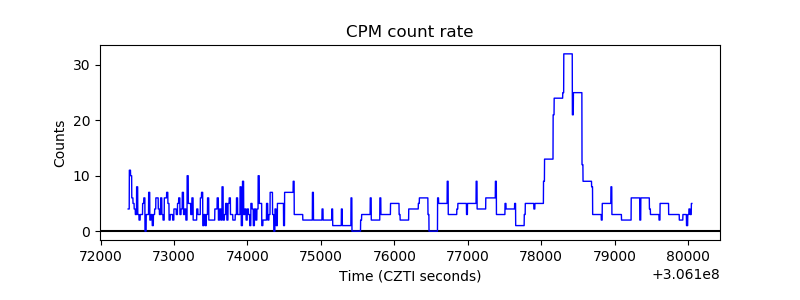 |
| CZT Counter | 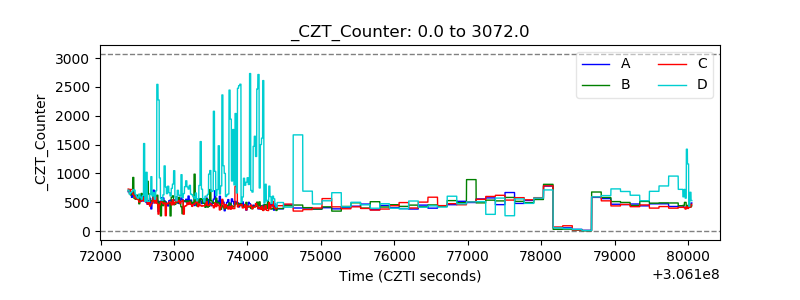 |
| +2.5 Volts monitor |  |
| +5 Volts monitor |  |
| _ROLL_ROT |  |
| _Roll_DEC | 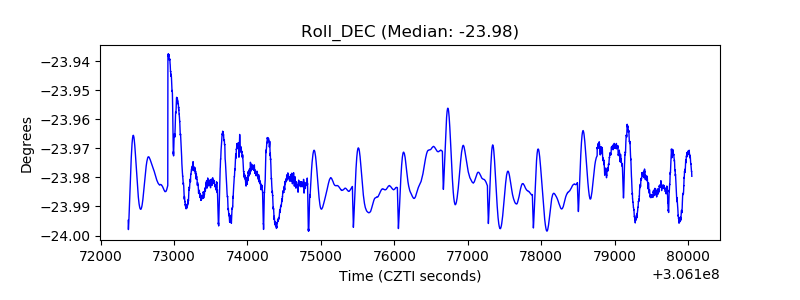 |
| _Roll_RA | 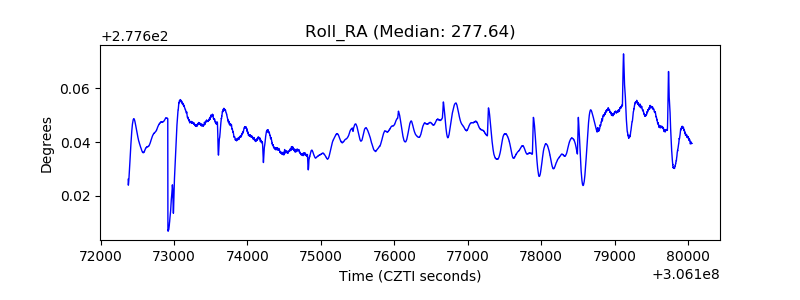 |
| Veto Counter | 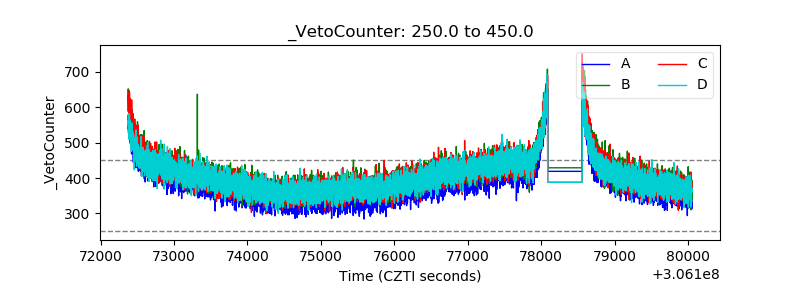 |