| Param | Original file | Final file |
|---|---|---|
| Filename | modeM0/AS1T03_140T01_9000003160_21427cztM0_level2.evt | modeM0/AS1T03_140T01_9000003160_21427cztM0_level2_quad_clean.evt |
| Size (bytes) | 578,041,920 | 105,261,120 |
| Size | 551.3 MB | 100.4 MB |
| Events in quadrant A | 3,572,490 | 684,019 |
| Events in quadrant B | 3,653,765 | 692,840 |
| Events in quadrant C | 3,533,320 | 669,569 |
| Events in quadrant D | 6,240,773 | 622,174 |
| Mode SS | |||
|---|---|---|---|
| Quadrant | BADHDUFLAG | Total packets | Discarded packets |
| A | 0 | 156 | 0 |
| B | 0 | 156 | 0 |
| C | 0 | 156 | 0 |
| D | 0 | 156 | 0 |
| Mode M0 | |||
|---|---|---|---|
| Quadrant | BADHDUFLAG | Total packets | Discarded packets |
| A | 0 | 15591 | 2 |
| B | 0 | 15697 | 2 |
| C | 0 | 15402 | 2 |
| D | 0 | 23624 | 3 |
| Mode M9 | |||
|---|---|---|---|
| Quadrant | BADHDUFLAG | Total packets | Discarded packets |
| A | 0 | 7 | 0 |
| B | 0 | 7 | 0 |
| C | 0 | 7 | 0 |
| D | 0 | 7 | 0 |
| Quadrant | Total seconds | Saturated seconds | Saturation percentage |
|---|---|---|---|
| A | 7449 | 43 | 0.577259% |
| B | 7449 | 66 | 0.886025% |
| C | 7449 | 64 | 0.859176% |
| D | 7449 | 707 | 9.491207% |
Noise dominated data is calculated using 1-second bins in cleaned event files. If a bin has >2000 counts, and if more than 50% of those come from <1% of pixels, then it is considered to be noise-dominated and hence unusable.
| Quadrant | # 1 sec bins | Bins with >0 counts | Bins with >2000 counts | High rate bins dominated by noise | Noise dominated (total time) | Noise dominated (detector-on time) | Marked lightcurve |
|---|---|---|---|---|---|---|---|
| A | 8264 | 7451 | 0 | 0 | 0.00% | 0.00% | 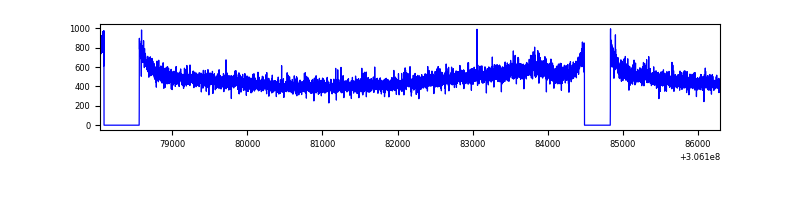 |
| B | 8264 | 7450 | 3 | 3 | 0.04% | 0.04% | 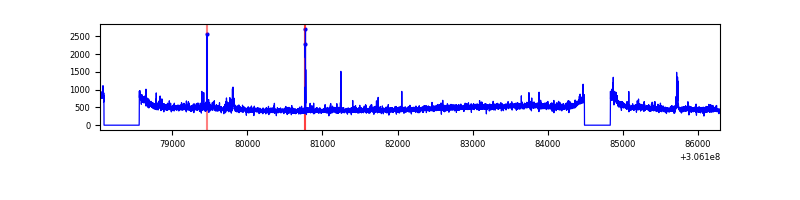 |
| C | 8264 | 7451 | 0 | 0 | 0.00% | 0.00% | 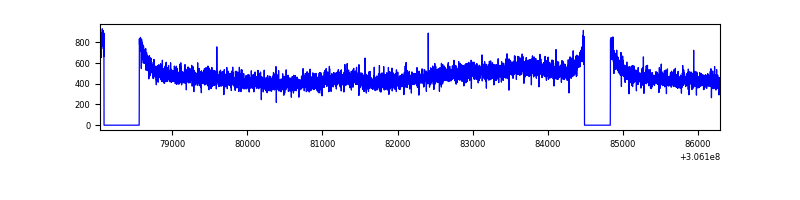 |
| D | 8264 | 7451 | 592 | 592 | 7.16% | 7.95% | 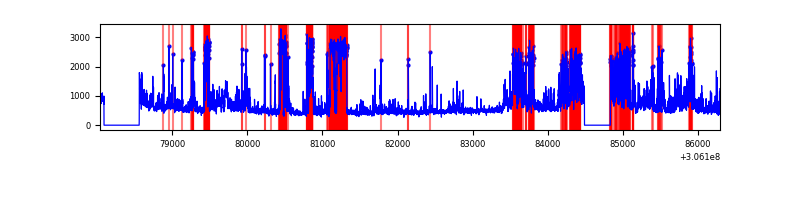 |
Top three noisy pixels from each quadrant. If the there are fewer than three noisy pixels in the level2.evt file, extra rows are filled as -1
| Pixel properties | Quadrant properties | ||||||
|---|---|---|---|---|---|---|---|
| Quadrant | DetID | PixID | Counts | Sigma | Mean | Median | Sigma |
| A | 11 | 47 | 40576 | 215.57 | 909 | 888 | 184.1 |
| A | 3 | 1 | 16008 | 82.13 | 909 | 888 | 184.1 |
| A | 13 | 254 | 12012 | 60.42 | 909 | 888 | 184.1 |
| B | 0 | 230 | 49288 | 277.04 | 904 | 880 | 174.7 |
| B | 0 | 228 | 23174 | 127.59 | 904 | 880 | 174.7 |
| B | 5 | 172 | 21615 | 118.67 | 904 | 880 | 174.7 |
| C | 14 | 238 | 137216 | 668.38 | 864 | 869 | 204.0 |
| C | 8 | 222 | 21236 | 99.84 | 864 | 869 | 204.0 |
| C | 13 | 61 | 6198 | 26.12 | 864 | 869 | 204.0 |
| D | 12 | 235 | 1042415 | 5043.03 | 852 | 828 | 206.5 |
| D | 13 | 153 | 848839 | 4105.8 | 852 | 828 | 206.5 |
| D | 1 | 52 | 403302 | 1948.65 | 852 | 828 | 206.5 |
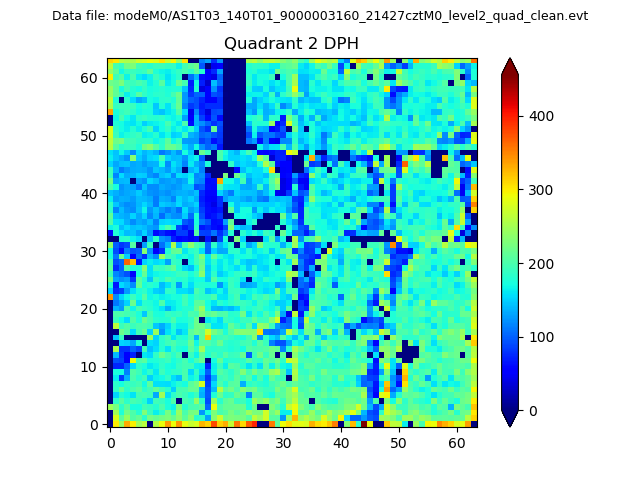
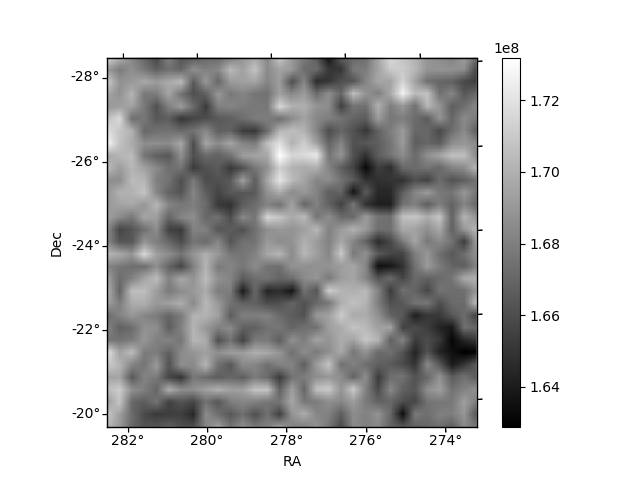
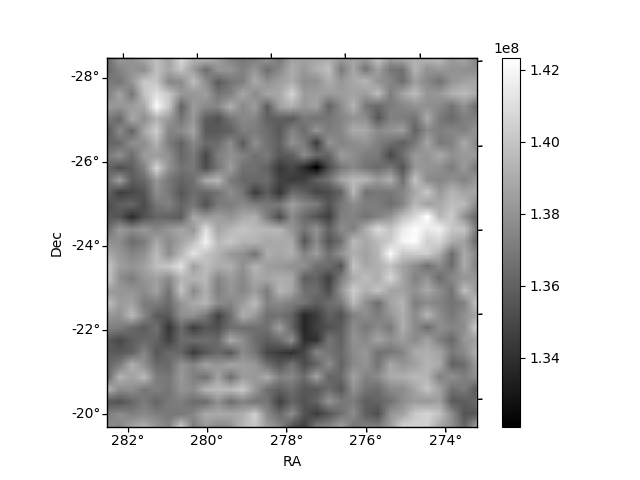
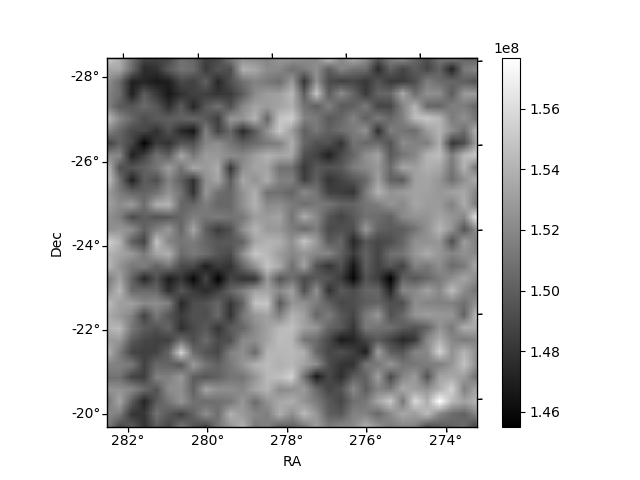
Histogram calculated using DETX and DETY for each event in the final _common_clean file
| Quadrant A | 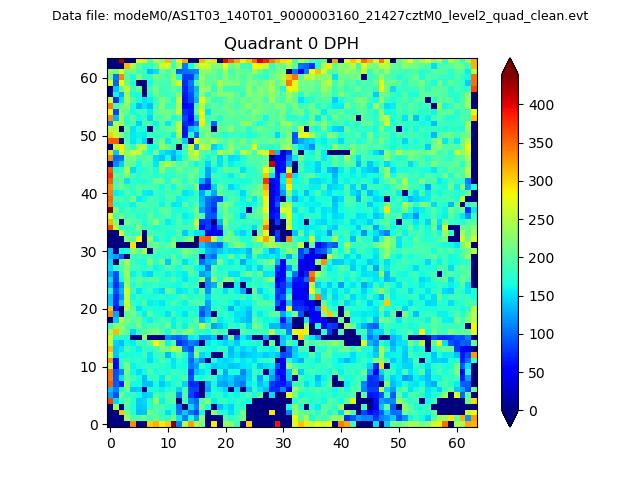 |
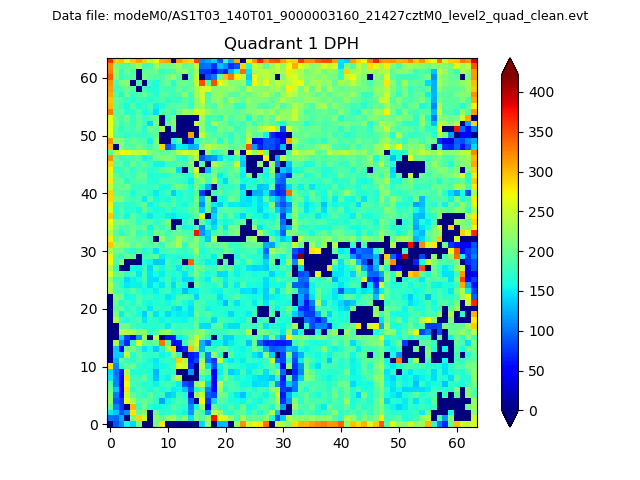 |
Quadrant B |
|---|---|---|---|
| Quadrant D | 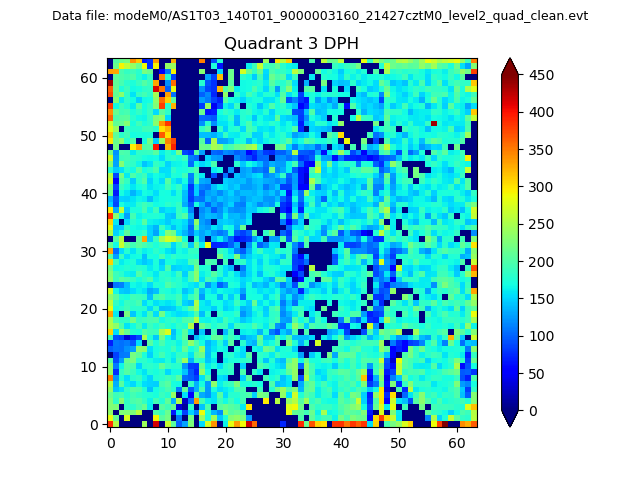 |
 |
Quadrant C |
| Plot type | Count rate plots | Images |
|---|---|---|
| Comparison with Poisson distribution Blue bars denote a histogram of data divided into 1 sec bins. Red curve is a Poisson curve with rate = median count rate of data. |
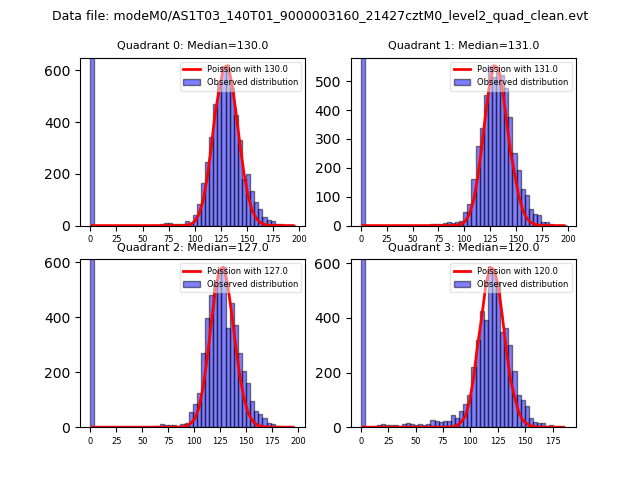 |
 |
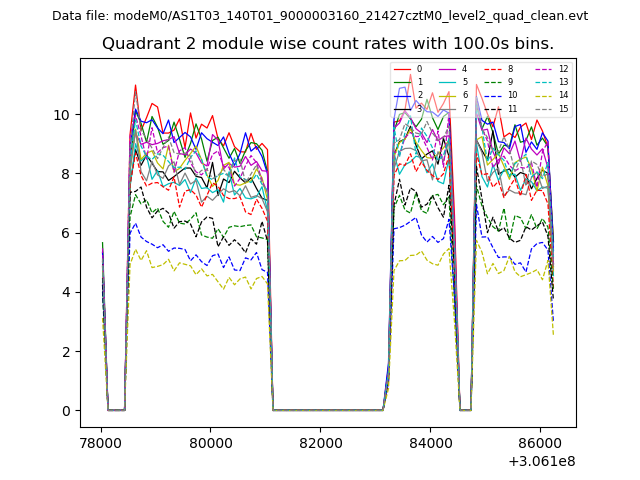
| Quadrant-wise count rates Data is divided into 100 sec bins |
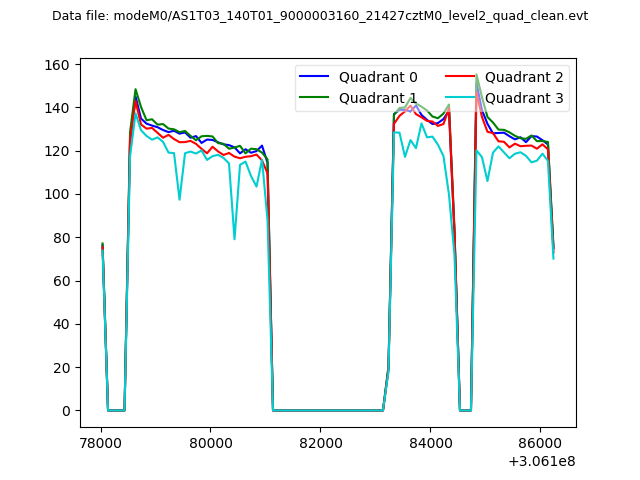 |
|
| Module-wise count rates for Quadrant A Data is divided into 100 sec bins |
 |
 |
| Module-wise count rates for Quadrant B Data is divided into 100 sec bins |
 |
 |
| Module-wise count rates for Quadrant C Data is divided into 100 sec bins |
 |
 |
| Module-wise count rates for Quadrant D Data is divided into 100 sec bins |
 |
 |
| Parameter | Plot |
|---|---|
| CZT HV Monitor | 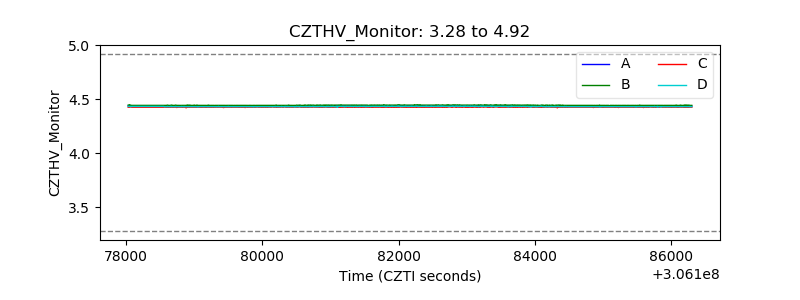 |
| D_VDD | 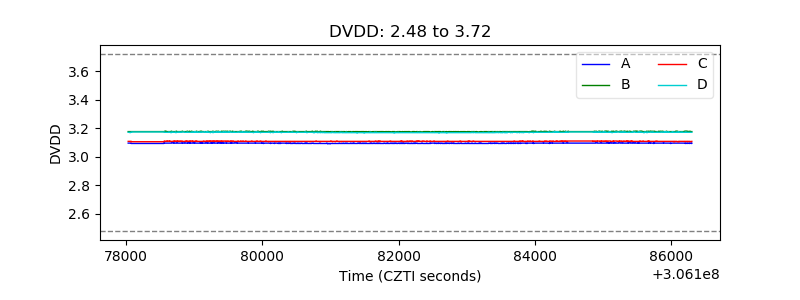 |
| Temperature 1 | 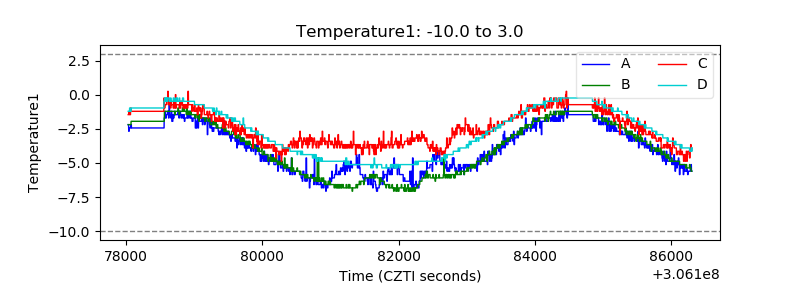 |
| Veto HV Monitor | 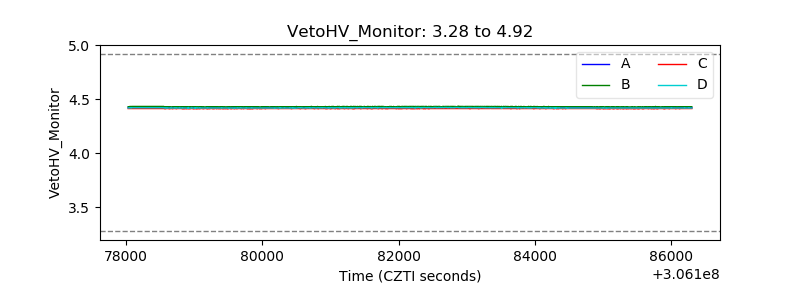 |
| Veto LLD |  |
| Alpha Counter | 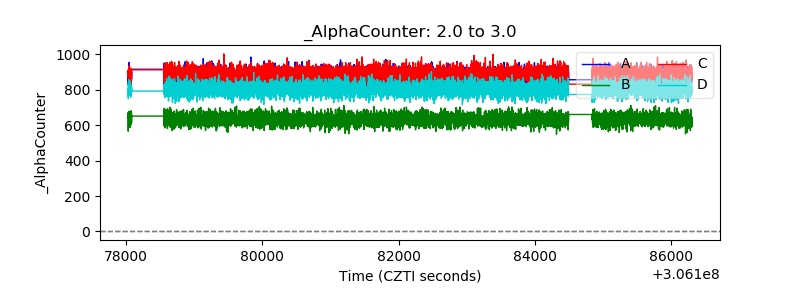 |
| _CPM_Rate | 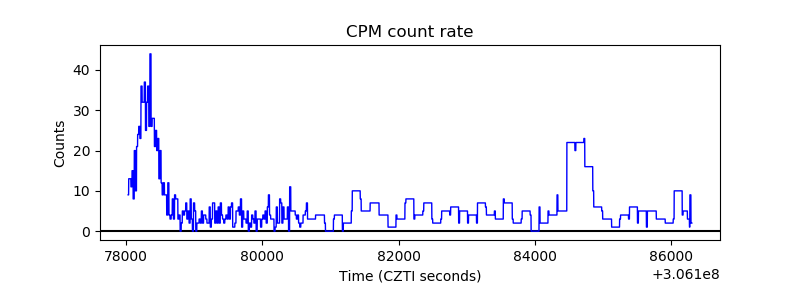 |
| CZT Counter | 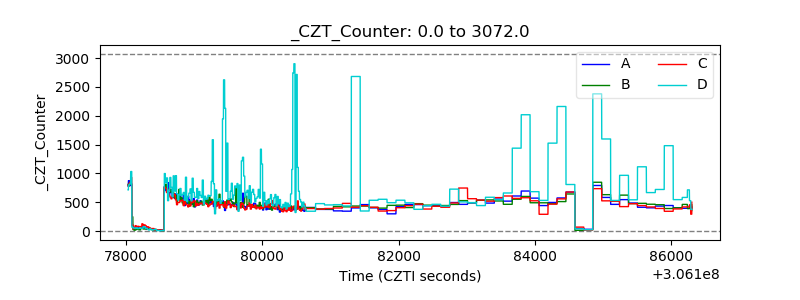 |
| +2.5 Volts monitor |  |
| +5 Volts monitor |  |
| _ROLL_ROT |  |
| _Roll_DEC | 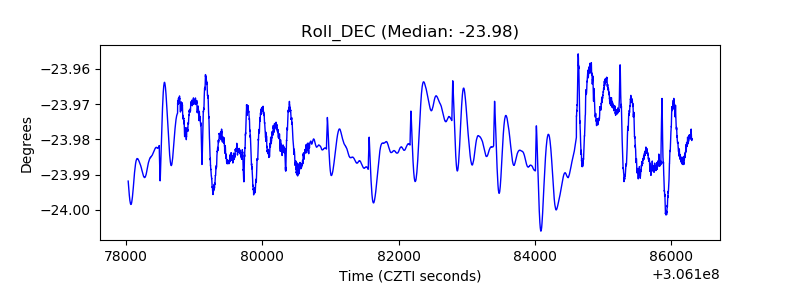 |
| _Roll_RA | 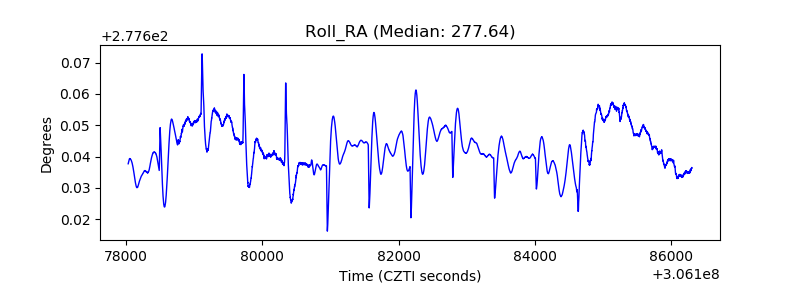 |
| Veto Counter |  |