| Param | Original file | Final file |
|---|---|---|
| Filename | modeM0/AS1T03_140T01_9000003160_21431cztM0_level2.evt | modeM0/AS1T03_140T01_9000003160_21431cztM0_level2_quad_clean.evt |
| Size (bytes) | 1,197,109,440 | 198,132,480 |
| Size | 1.1 GB | 189.0 MB |
| Events in quadrant A | 7,962,744 | 1,227,371 |
| Events in quadrant B | 8,256,939 | 1,242,745 |
| Events in quadrant C | 8,007,762 | 1,201,258 |
| Events in quadrant D | 10,864,409 | 1,143,556 |
| Mode SS | |||
|---|---|---|---|
| Quadrant | BADHDUFLAG | Total packets | Discarded packets |
| A | 0 | 370 | 16 |
| B | 0 | 367 | 17 |
| C | 0 | 370 | 16 |
| D | 0 | 371 | 17 |
| Mode M0 | |||
|---|---|---|---|
| Quadrant | BADHDUFLAG | Total packets | Discarded packets |
| A | 0 | 36589 | 1604 |
| B | 0 | 37162 | 1612 |
| C | 0 | 36585 | 1603 |
| D | 0 | 46703 | 2556 |
| Mode M9 | |||
|---|---|---|---|
| Quadrant | BADHDUFLAG | Total packets | Discarded packets |
| A | 0 | 27 | 0 |
| B | 0 | 27 | 0 |
| C | 0 | 28 | 1 |
| D | 0 | 27 | 0 |
| Quadrant | Total seconds | Saturated seconds | Saturation percentage |
|---|---|---|---|
| A | 17196 | 89 | 0.517562% |
| B | 17213 | 115 | 0.668100% |
| C | 17199 | 147 | 0.854701% |
| D | 17157 | 405 | 2.360553% |
Noise dominated data is calculated using 1-second bins in cleaned event files. If a bin has >2000 counts, and if more than 50% of those come from <1% of pixels, then it is considered to be noise-dominated and hence unusable.
| Quadrant | # 1 sec bins | Bins with >0 counts | Bins with >2000 counts | High rate bins dominated by noise | Noise dominated (total time) | Noise dominated (detector-on time) | Marked lightcurve |
|---|---|---|---|---|---|---|---|
| A | 21375 | 17256 | 0 | 0 | 0.00% | 0.00% | 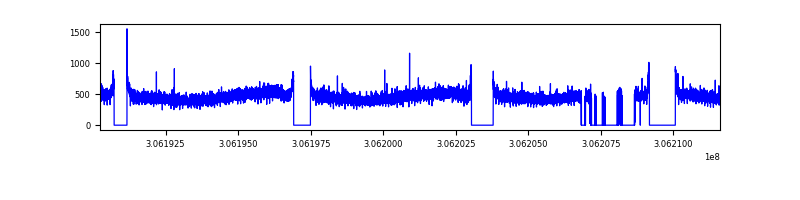 |
| B | 21375 | 17291 | 11 | 11 | 0.05% | 0.06% | 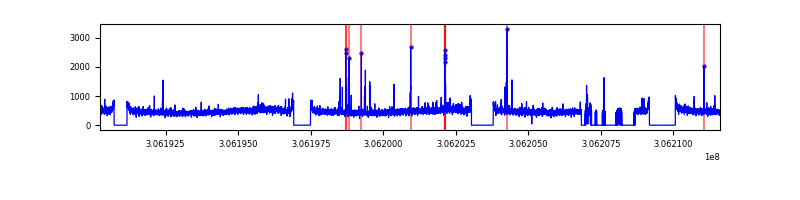 |
| C | 21375 | 17260 | 0 | 0 | 0.00% | 0.00% | 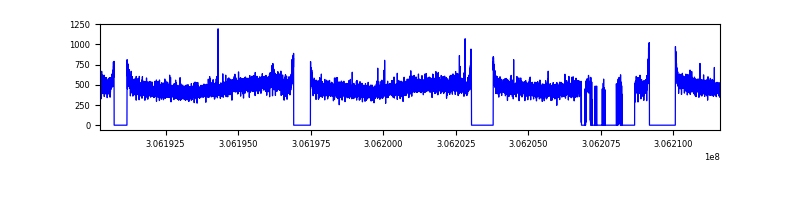 |
| D | 21375 | 17212 | 302 | 302 | 1.41% | 1.75% | 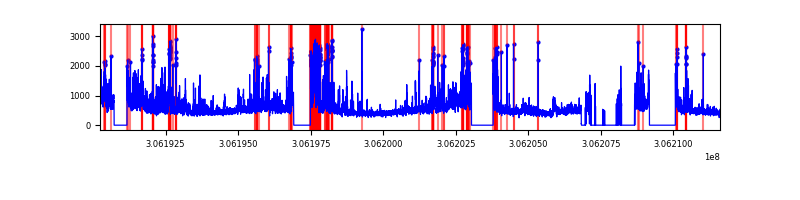 |
Top three noisy pixels from each quadrant. If the there are fewer than three noisy pixels in the level2.evt file, extra rows are filled as -1
| Pixel properties | Quadrant properties | ||||||
|---|---|---|---|---|---|---|---|
| Quadrant | DetID | PixID | Counts | Sigma | Mean | Median | Sigma |
| A | 11 | 47 | 41347 | 95.72 | 2053 | 2011 | 411.0 |
| A | 13 | 254 | 27241 | 61.39 | 2053 | 2011 | 411.0 |
| A | 0 | 226 | 17561 | 37.84 | 2053 | 2011 | 411.0 |
| B | 3 | 64 | 77644 | 191.9 | 2058 | 2007 | 394.1 |
| B | 0 | 230 | 54927 | 134.27 | 2058 | 2007 | 394.1 |
| B | 12 | 111 | 47794 | 116.17 | 2058 | 2007 | 394.1 |
| C | 14 | 238 | 307933 | 660.71 | 1971 | 1984 | 463.1 |
| C | 3 | 233 | 16764 | 31.92 | 1971 | 1984 | 463.1 |
| C | 13 | 61 | 13625 | 25.14 | 1971 | 1984 | 463.1 |
| D | 12 | 235 | 1202198 | 2507.11 | 1970 | 1910 | 478.8 |
| D | 7 | 38 | 961903 | 2005.19 | 1970 | 1910 | 478.8 |
| D | 1 | 52 | 412088 | 856.76 | 1970 | 1910 | 478.8 |
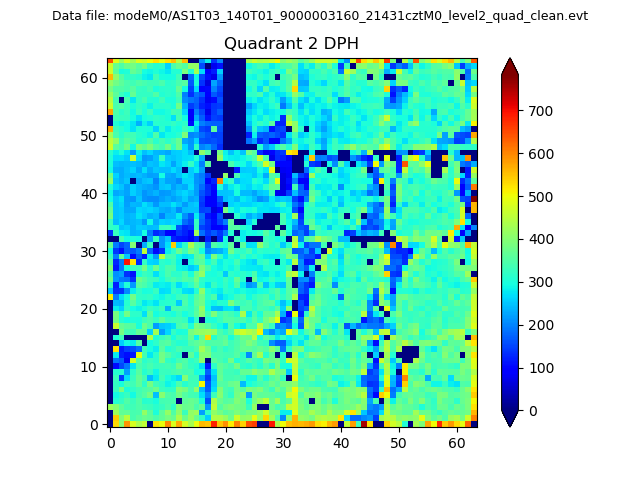
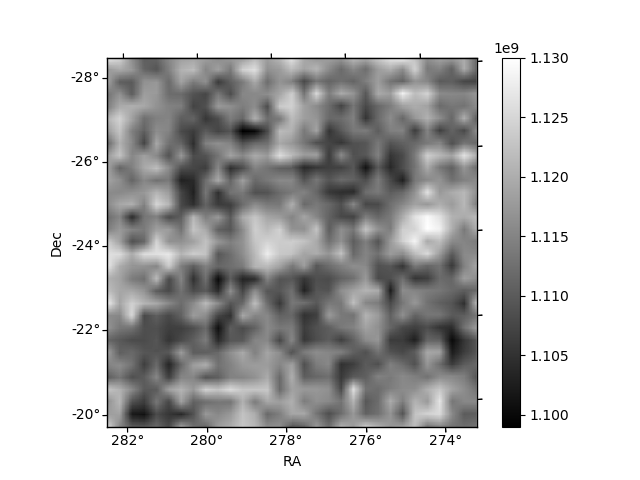
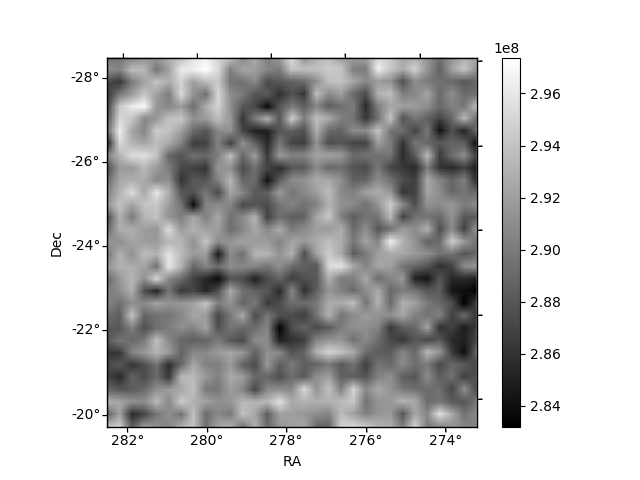
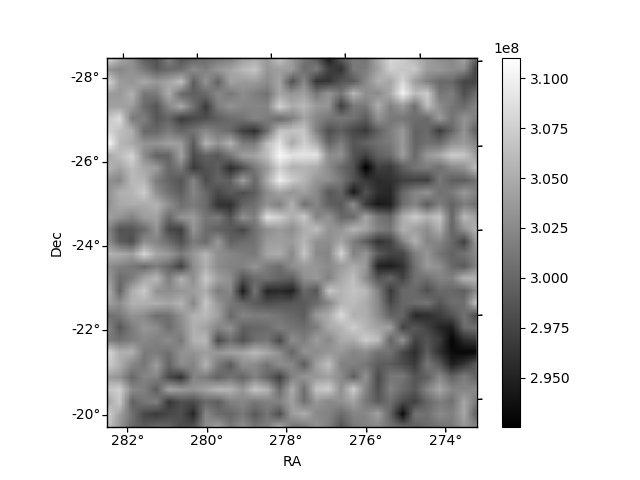
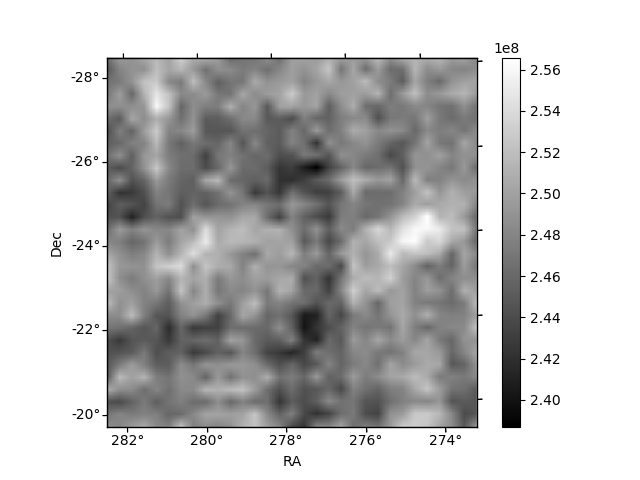
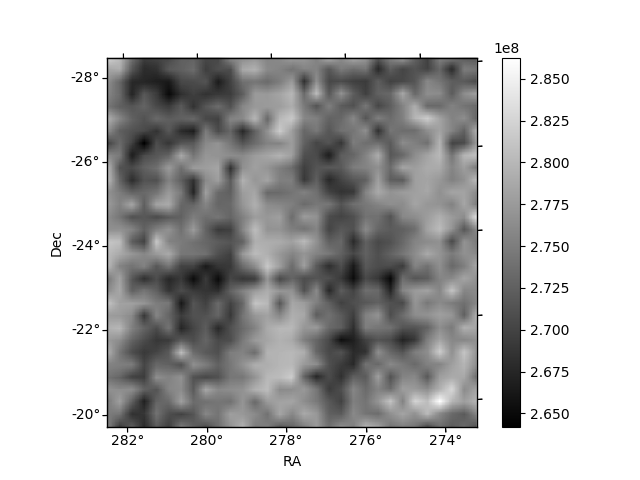
Histogram calculated using DETX and DETY for each event in the final _common_clean file
| Quadrant A | 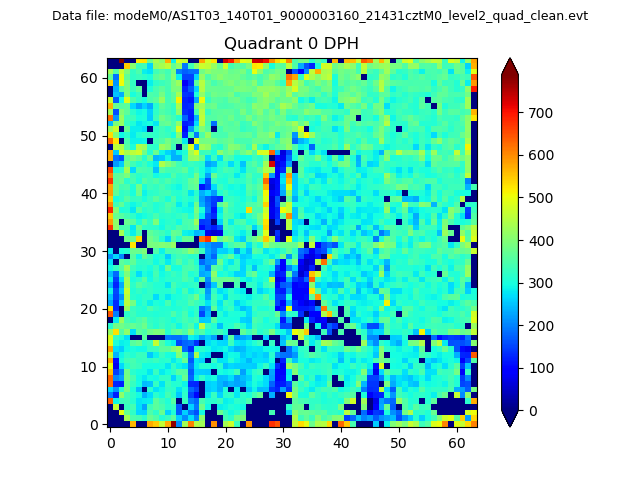 |
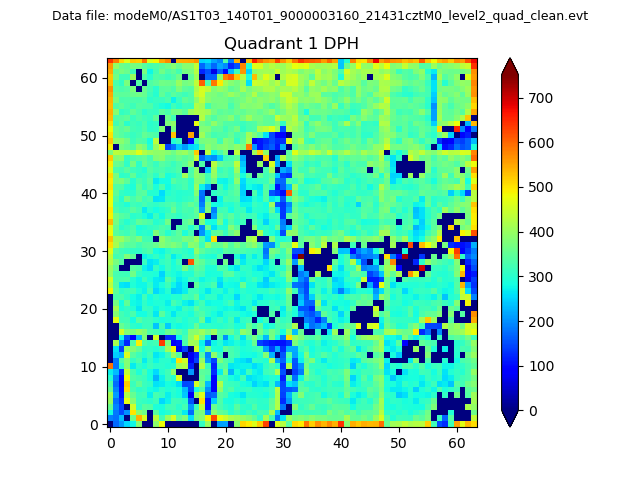 |
Quadrant B |
|---|---|---|---|
| Quadrant D | 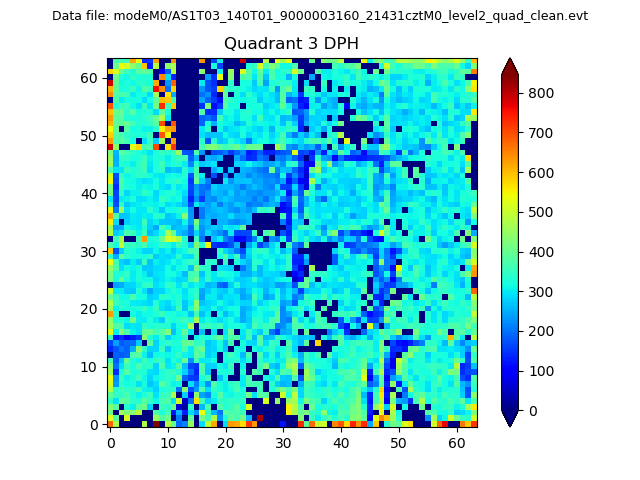 |
 |
Quadrant C |
| Plot type | Count rate plots | Images |
|---|---|---|
| Comparison with Poisson distribution Blue bars denote a histogram of data divided into 1 sec bins. Red curve is a Poisson curve with rate = median count rate of data. |
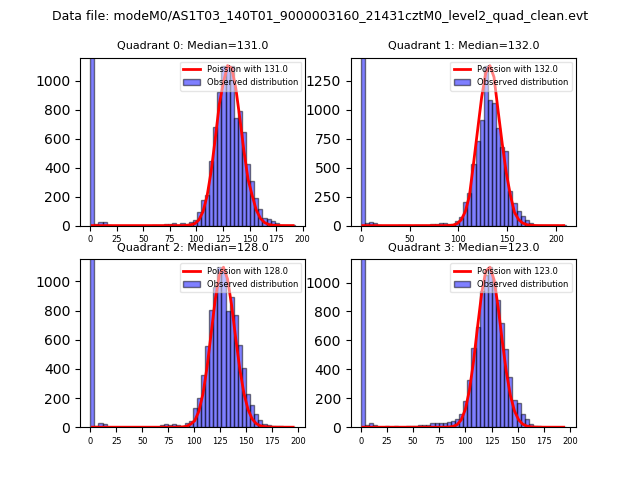 |
 |
| Quadrant-wise count rates Data is divided into 100 sec bins |
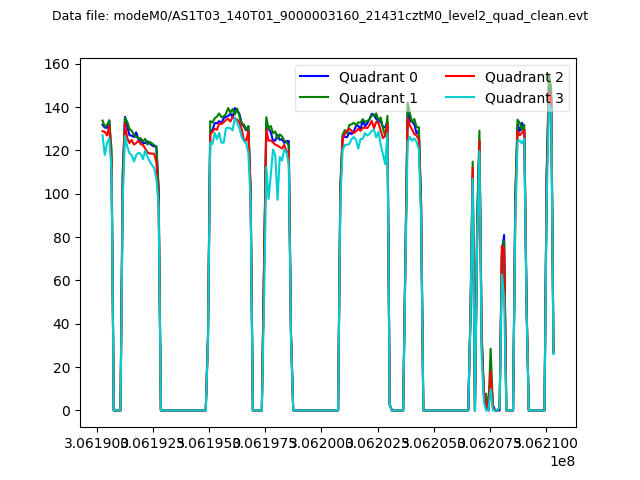 |
|
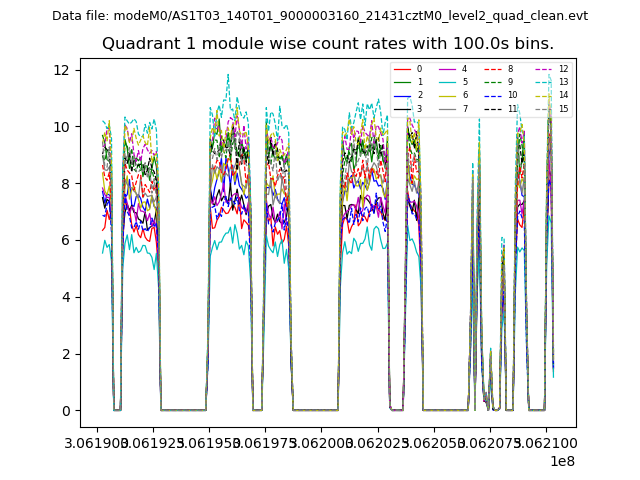
| Module-wise count rates for Quadrant A Data is divided into 100 sec bins |
 |
 |
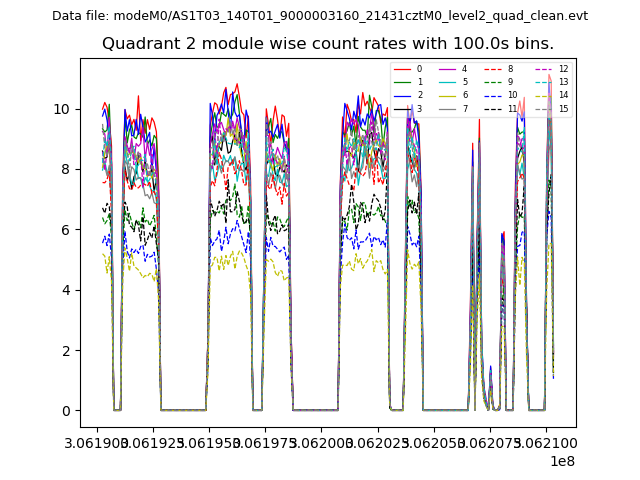
| Module-wise count rates for Quadrant B Data is divided into 100 sec bins |
 |
 |
| Module-wise count rates for Quadrant C Data is divided into 100 sec bins |
 |
 |
| Module-wise count rates for Quadrant D Data is divided into 100 sec bins |
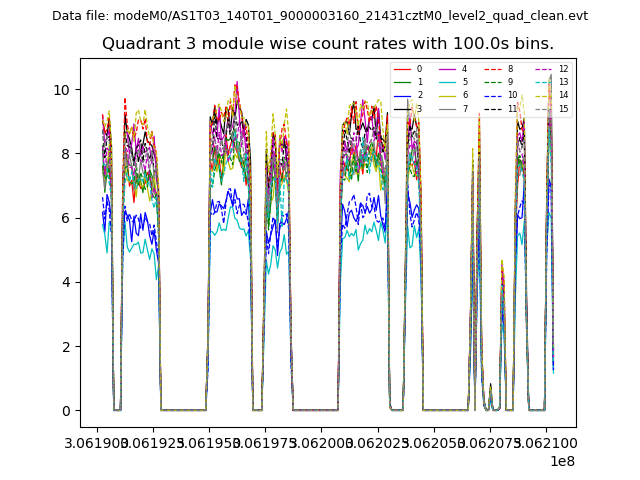 |
 |
| Parameter | Plot |
|---|---|
| CZT HV Monitor | 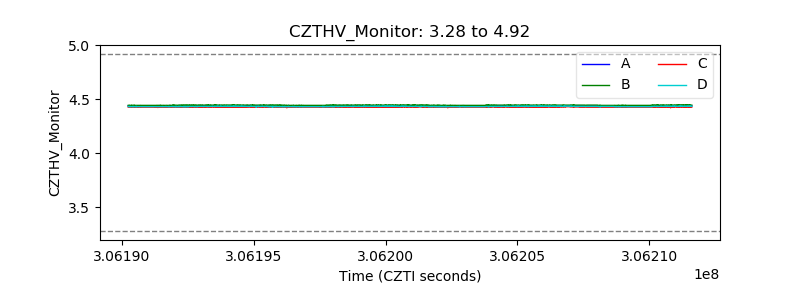 |
| D_VDD | 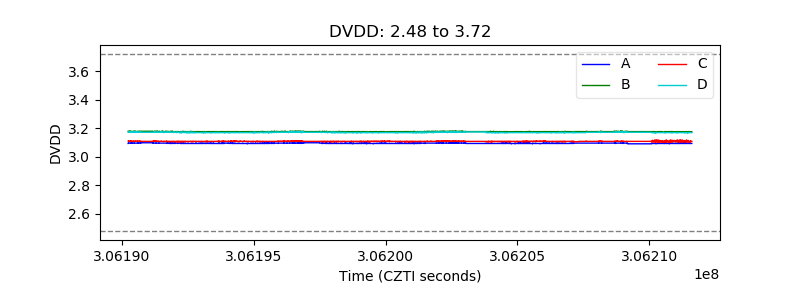 |
| Temperature 1 | 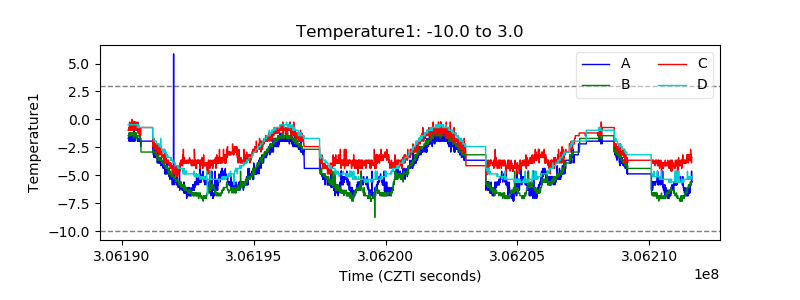 |
| Veto HV Monitor | 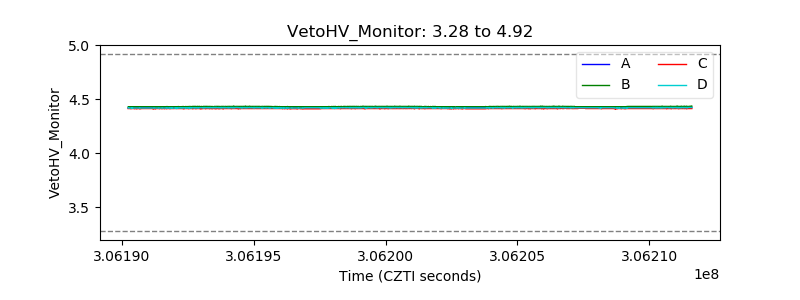 |
| Veto LLD |  |
| Alpha Counter | 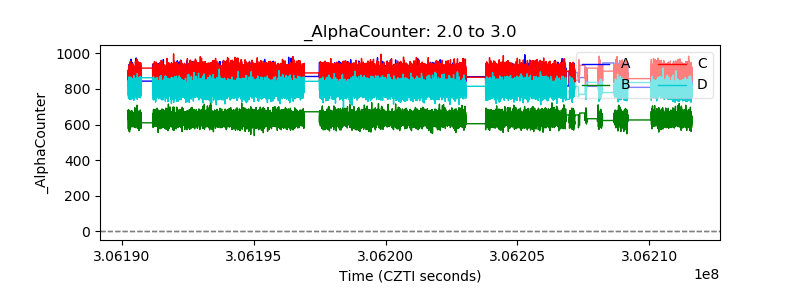 |
| _CPM_Rate | 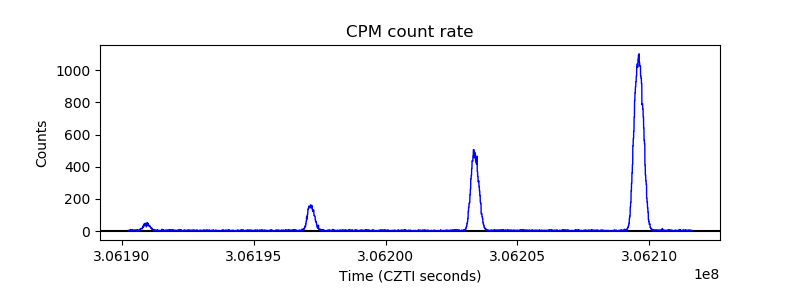 |
| CZT Counter | 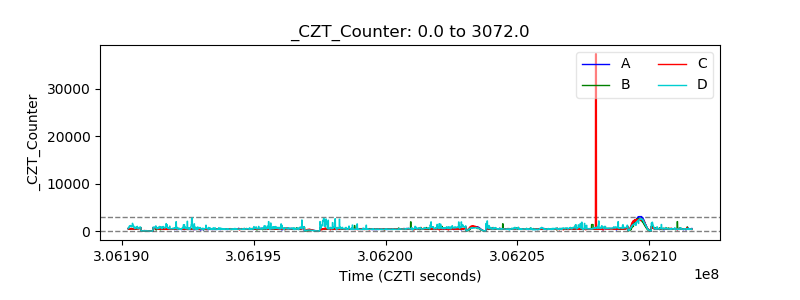 |
| +2.5 Volts monitor |  |
| +5 Volts monitor | 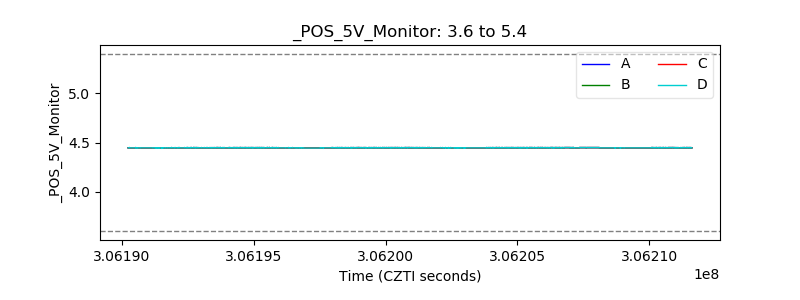 |
| _ROLL_ROT | 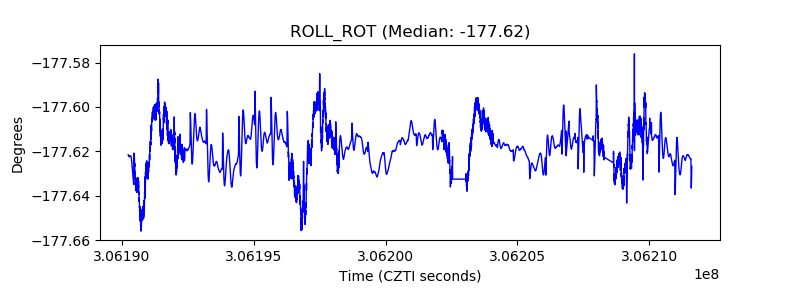 |
| _Roll_DEC | 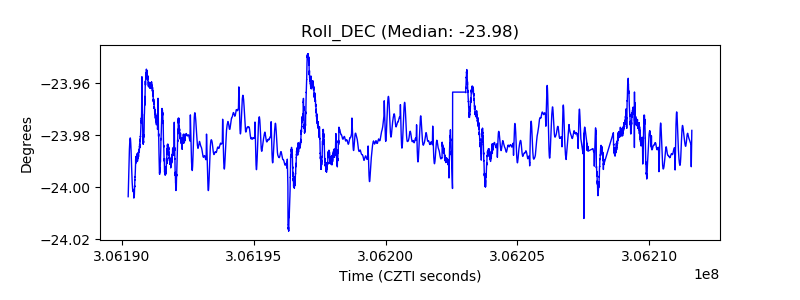 |
| _Roll_RA | 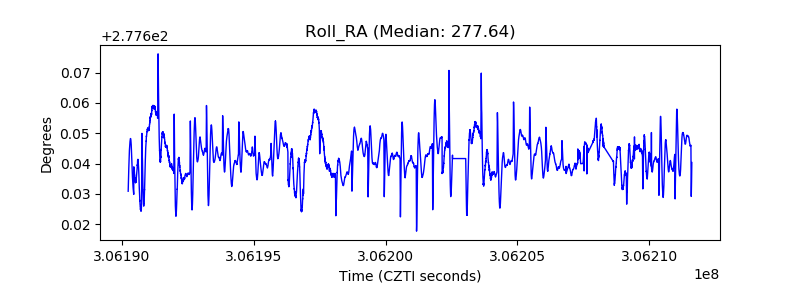 |
| Veto Counter |  |