| Param | Original file | Final file |
|---|---|---|
| Filename | modeM0/AS1T03_140T01_9000003160_21432cztM0_level2.evt | modeM0/AS1T03_140T01_9000003160_21432cztM0_level2_quad_clean.evt |
| Size (bytes) | 439,914,240 | 61,076,160 |
| Size | 419.5 MB | 58.2 MB |
| Events in quadrant A | 3,020,350 | 358,852 |
| Events in quadrant B | 3,074,845 | 363,361 |
| Events in quadrant C | 3,015,807 | 352,728 |
| Events in quadrant D | 3,788,100 | 338,983 |
| Mode SS | |||
|---|---|---|---|
| Quadrant | BADHDUFLAG | Total packets | Discarded packets |
| A | 0 | 128 | 0 |
| B | 0 | 128 | 0 |
| C | 0 | 128 | 0 |
| D | 0 | 128 | 0 |
| Mode M0 | |||
|---|---|---|---|
| Quadrant | BADHDUFLAG | Total packets | Discarded packets |
| A | 0 | 12813 | 1 |
| B | 0 | 12997 | 1 |
| C | 0 | 12807 | 1 |
| D | 0 | 15394 | 1 |
| Mode M9 | |||
|---|---|---|---|
| Quadrant | BADHDUFLAG | Total packets | Discarded packets |
| A | 0 | 10 | 0 |
| B | 0 | 10 | 0 |
| C | 0 | 10 | 0 |
| D | 0 | 10 | 0 |
| Quadrant | Total seconds | Saturated seconds | Saturation percentage |
|---|---|---|---|
| A | 6229 | 35 | 0.561888% |
| B | 6230 | 42 | 0.674157% |
| C | 6229 | 47 | 0.754535% |
| D | 6229 | 84 | 1.348531% |
Noise dominated data is calculated using 1-second bins in cleaned event files. If a bin has >2000 counts, and if more than 50% of those come from <1% of pixels, then it is considered to be noise-dominated and hence unusable.
| Quadrant | # 1 sec bins | Bins with >0 counts | Bins with >2000 counts | High rate bins dominated by noise | Noise dominated (total time) | Noise dominated (detector-on time) | Marked lightcurve |
|---|---|---|---|---|---|---|---|
| A | 7264 | 6229 | 0 | 0 | 0.00% | 0.00% | 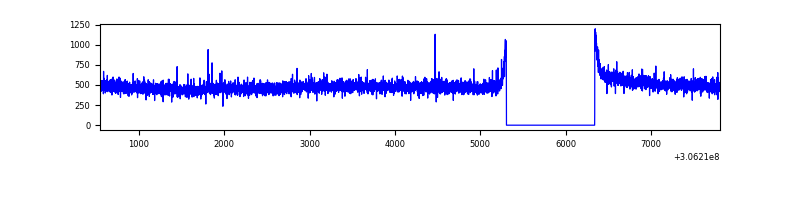 |
| B | 7265 | 6230 | 1 | 1 | 0.01% | 0.02% | 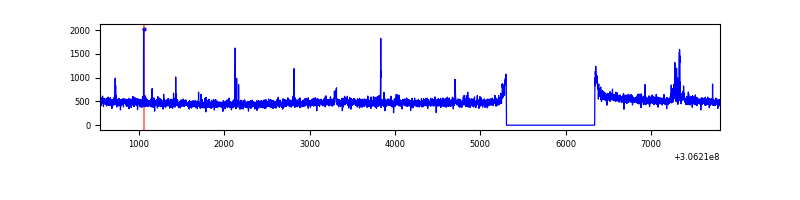 |
| C | 7264 | 6229 | 0 | 0 | 0.00% | 0.00% | 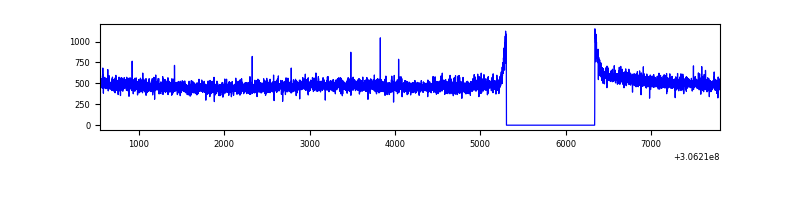 |
| D | 7264 | 6229 | 73 | 73 | 1.00% | 1.17% | 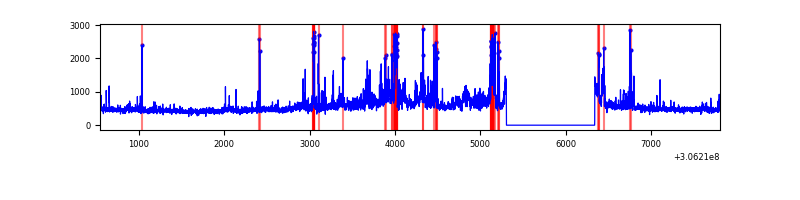 |
Top three noisy pixels from each quadrant. If the there are fewer than three noisy pixels in the level2.evt file, extra rows are filled as -1
| Pixel properties | Quadrant properties | ||||||
|---|---|---|---|---|---|---|---|
| Quadrant | DetID | PixID | Counts | Sigma | Mean | Median | Sigma |
| A | 11 | 47 | 43215 | 274.51 | 770 | 754 | 154.7 |
| A | 13 | 254 | 9182 | 54.48 | 770 | 754 | 154.7 |
| A | 3 | 1 | 9010 | 53.37 | 770 | 754 | 154.7 |
| B | 3 | 64 | 33774 | 224.28 | 769 | 750 | 147.2 |
| B | 0 | 230 | 18857 | 122.97 | 769 | 750 | 147.2 |
| B | 12 | 111 | 17550 | 114.1 | 769 | 750 | 147.2 |
| C | 14 | 238 | 117033 | 670.99 | 738 | 743 | 173.3 |
| C | 8 | 128 | 12099 | 65.52 | 738 | 743 | 173.3 |
| C | 8 | 112 | 5380 | 26.76 | 738 | 743 | 173.3 |
| D | 1 | 52 | 290502 | 1614.59 | 743 | 723 | 179.5 |
| D | 1 | 20 | 245348 | 1363.0 | 743 | 723 | 179.5 |
| D | 12 | 235 | 213582 | 1186.01 | 743 | 723 | 179.5 |
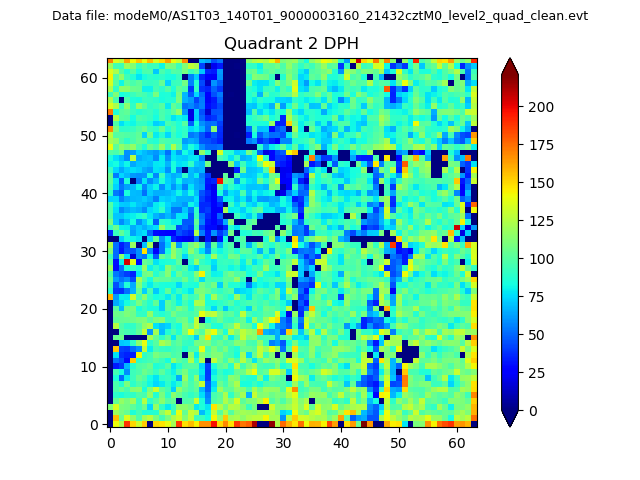
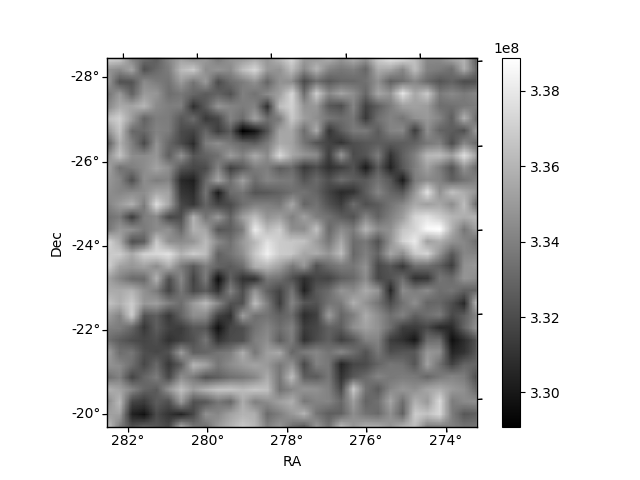
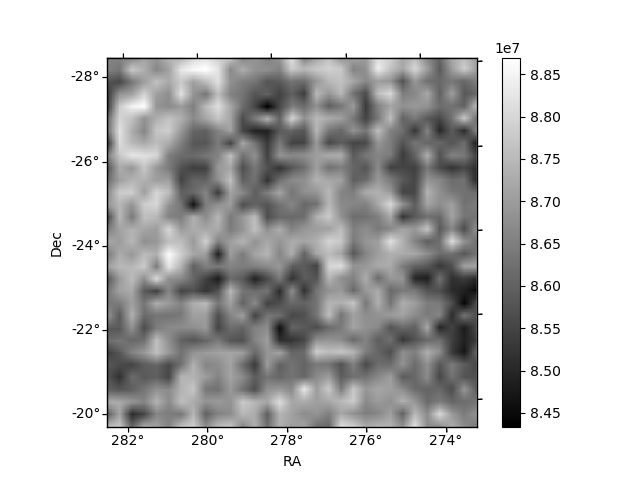
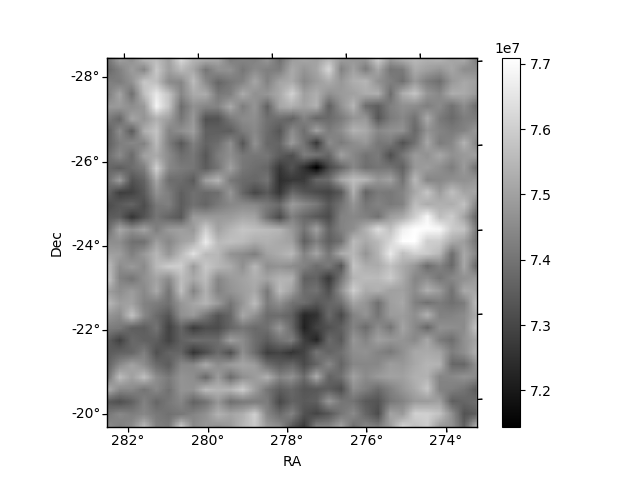
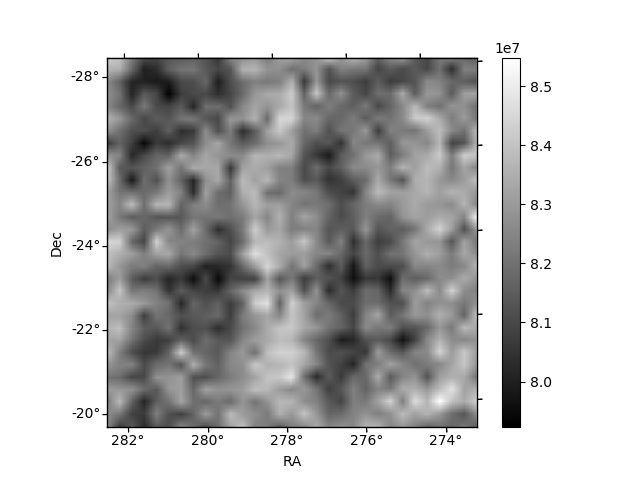
Histogram calculated using DETX and DETY for each event in the final _common_clean file
| Quadrant A | 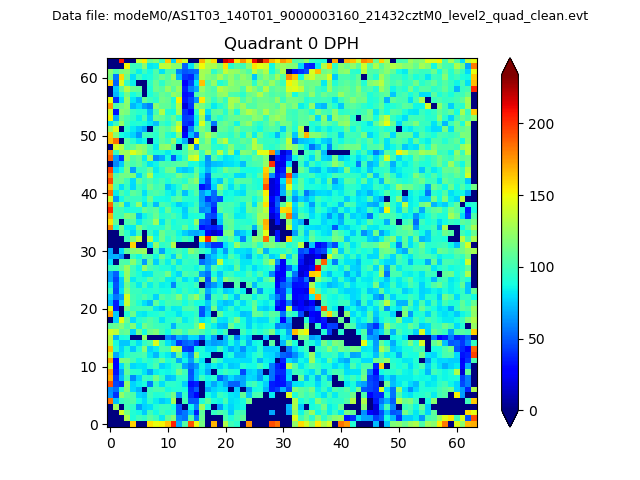 |
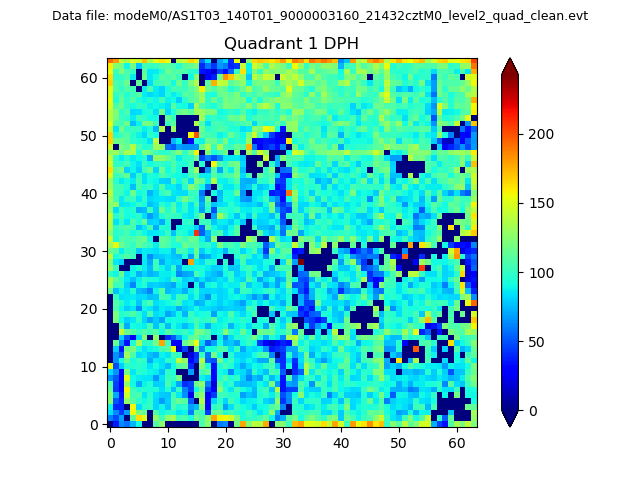 |
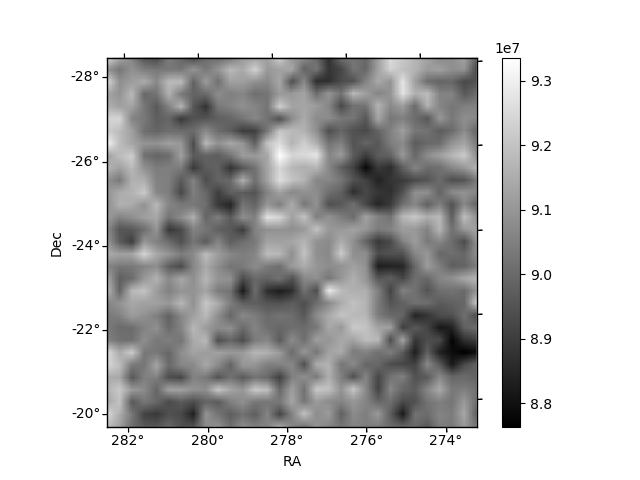
Quadrant B |
|---|---|---|---|
| Quadrant D | 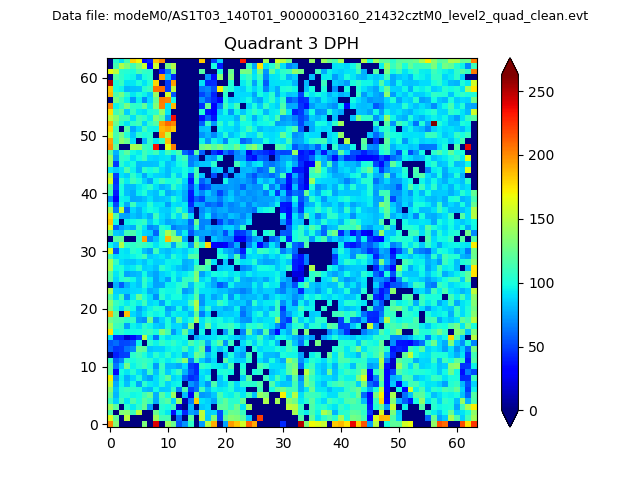 |
 |
Quadrant C |
| Plot type | Count rate plots | Images |
|---|---|---|
| Comparison with Poisson distribution Blue bars denote a histogram of data divided into 1 sec bins. Red curve is a Poisson curve with rate = median count rate of data. |
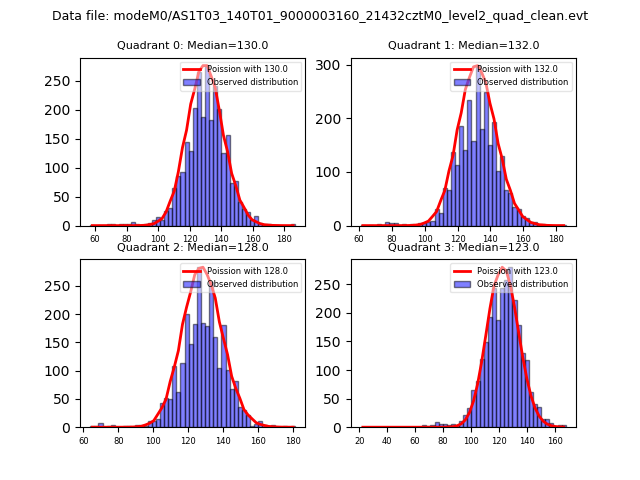 |
 |
| Quadrant-wise count rates Data is divided into 100 sec bins |
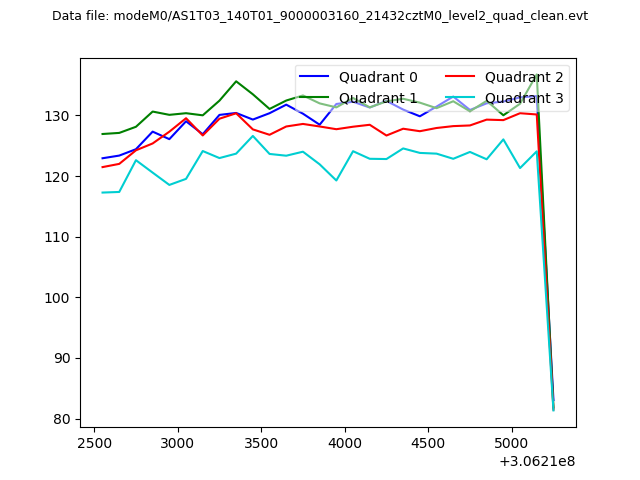 |
|
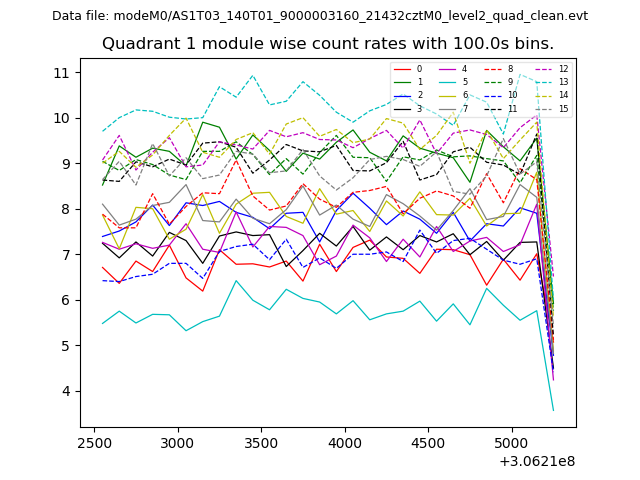
| Module-wise count rates for Quadrant A Data is divided into 100 sec bins |
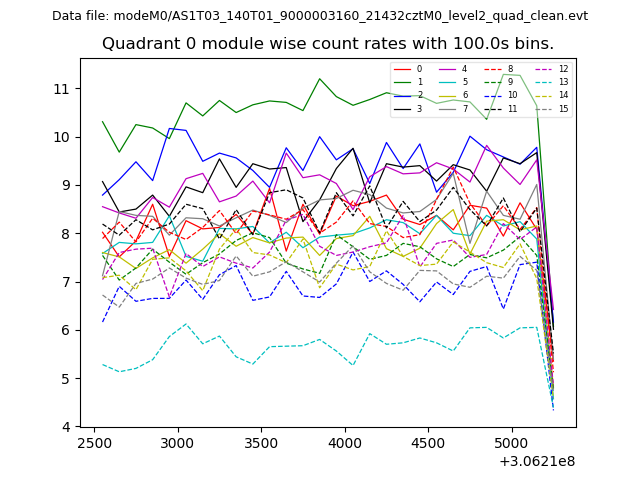 |
 |
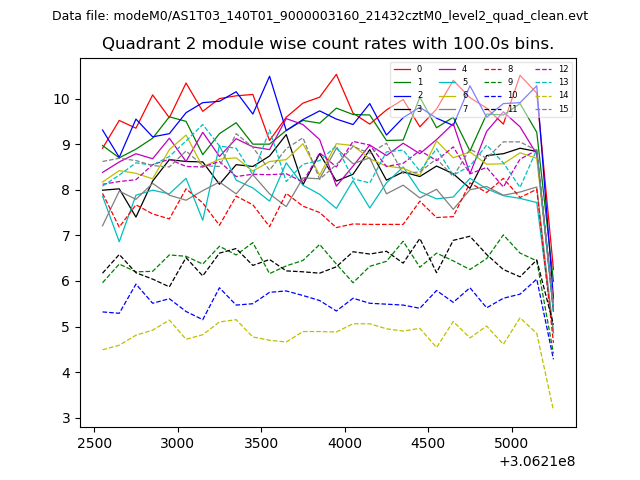
| Module-wise count rates for Quadrant B Data is divided into 100 sec bins |
 |
 |
| Module-wise count rates for Quadrant C Data is divided into 100 sec bins |
 |
 |
| Module-wise count rates for Quadrant D Data is divided into 100 sec bins |
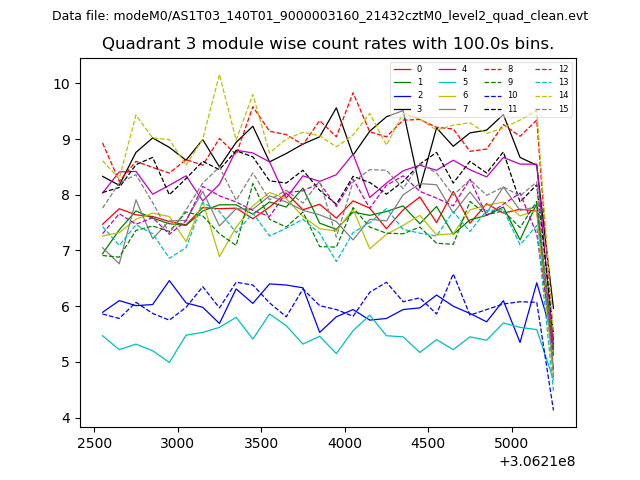 |
 |
| Parameter | Plot |
|---|---|
| CZT HV Monitor | 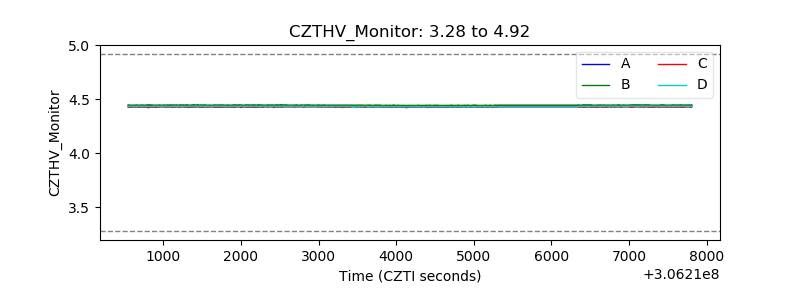 |
| D_VDD | 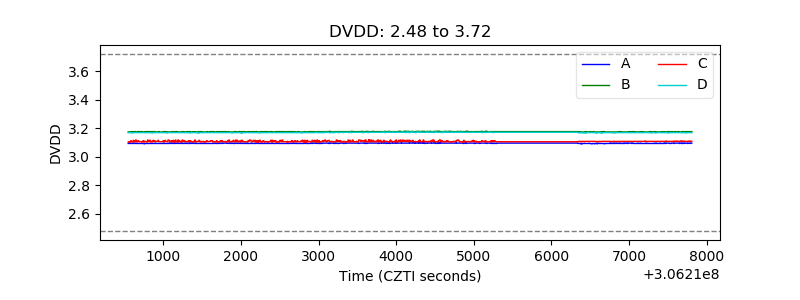 |
| Temperature 1 | 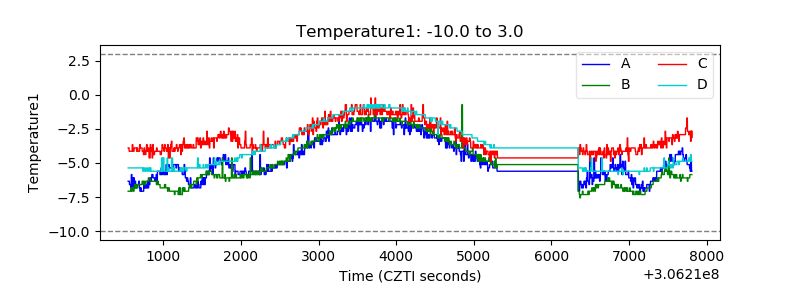 |
| Veto HV Monitor | 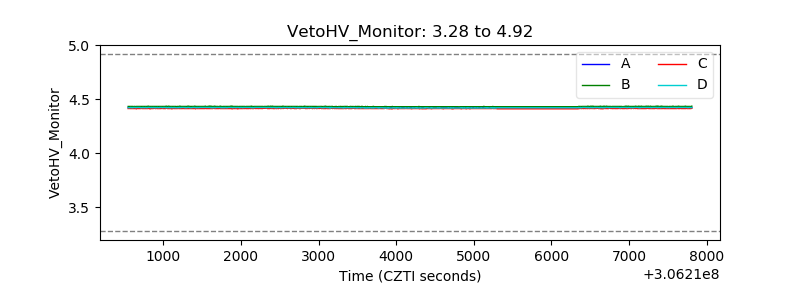 |
| Veto LLD |  |
| Alpha Counter | 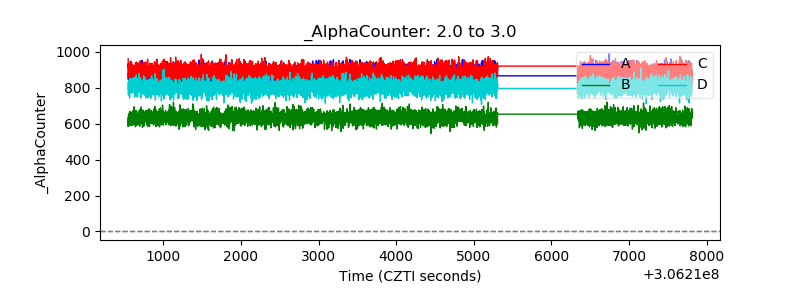 |
| _CPM_Rate | 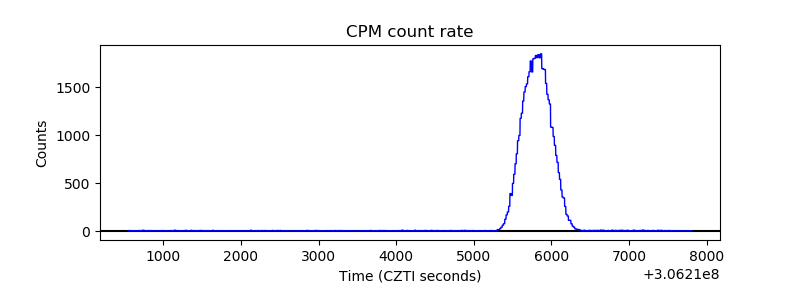 |
| CZT Counter | 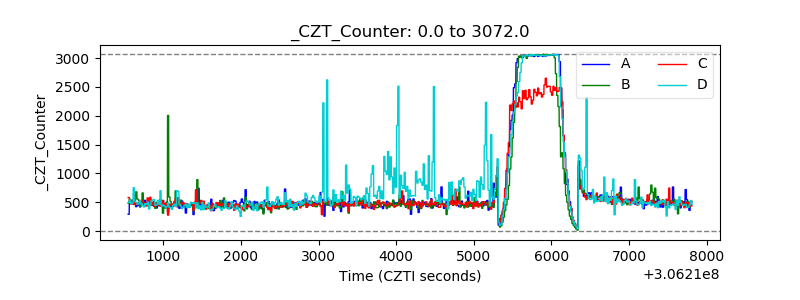 |
| +2.5 Volts monitor |  |
| +5 Volts monitor |  |
| _ROLL_ROT | 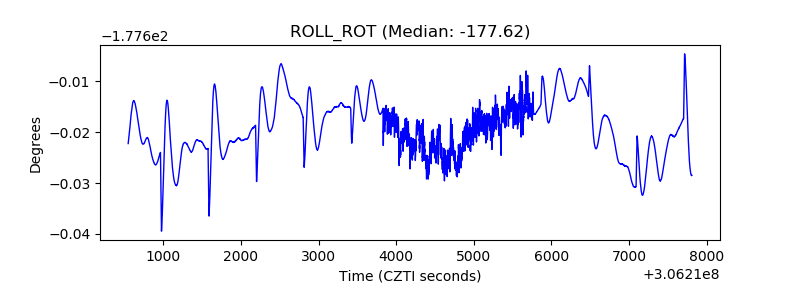 |
| _Roll_DEC | 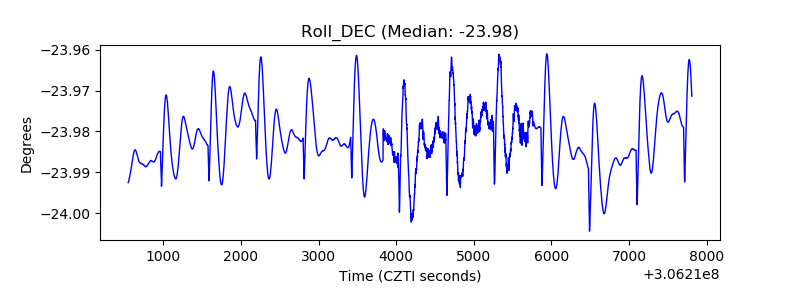 |
| _Roll_RA | 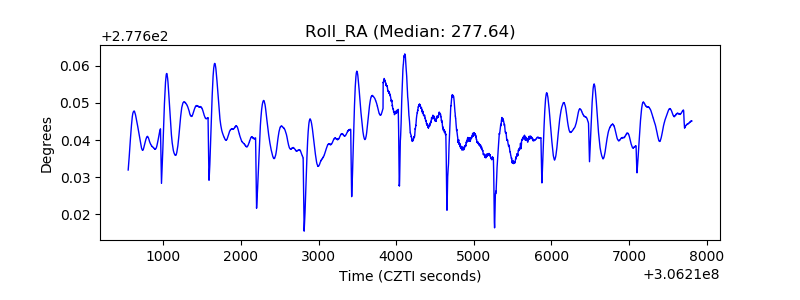 |
| Veto Counter | 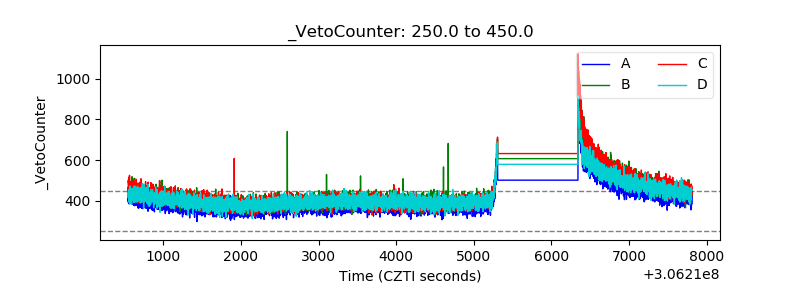 |