| Param | Original file | Final file |
|---|---|---|
| Filename | modeM0/AS1T03_140T01_9000003160_21434cztM0_level2.evt | modeM0/AS1T03_140T01_9000003160_21434cztM0_level2_quad_clean.evt |
| Size (bytes) | 1,971,754,560 | 330,926,400 |
| Size | 1.8 GB | 315.6 MB |
| Events in quadrant A | 13,258,016 | 2,061,555 |
| Events in quadrant B | 13,603,523 | 2,084,124 |
| Events in quadrant C | 13,251,511 | 2,021,911 |
| Events in quadrant D | 17,720,589 | 1,939,464 |
| Mode SS | |||
|---|---|---|---|
| Quadrant | BADHDUFLAG | Total packets | Discarded packets |
| A | 0 | 566 | 0 |
| B | 0 | 566 | 0 |
| C | 0 | 566 | 0 |
| D | 0 | 566 | 0 |
| Mode M0 | |||
|---|---|---|---|
| Quadrant | BADHDUFLAG | Total packets | Discarded packets |
| A | 0 | 57180 | 5 |
| B | 0 | 58011 | 5 |
| C | 0 | 57191 | 5 |
| D | 0 | 71634 | 6 |
| Mode M9 | |||
|---|---|---|---|
| Quadrant | BADHDUFLAG | Total packets | Discarded packets |
| A | 0 | 45 | 0 |
| B | 0 | 45 | 0 |
| C | 0 | 45 | 0 |
| D | 0 | 45 | 0 |
| Quadrant | Total seconds | Saturated seconds | Saturation percentage |
|---|---|---|---|
| A | 27870 | 152 | 0.545389% |
| B | 27871 | 200 | 0.717592% |
| C | 27871 | 247 | 0.886226% |
| D | 27870 | 570 | 2.045210% |
Noise dominated data is calculated using 1-second bins in cleaned event files. If a bin has >2000 counts, and if more than 50% of those come from <1% of pixels, then it is considered to be noise-dominated and hence unusable.
| Quadrant | # 1 sec bins | Bins with >0 counts | Bins with >2000 counts | High rate bins dominated by noise | Noise dominated (total time) | Noise dominated (detector-on time) | Marked lightcurve |
|---|---|---|---|---|---|---|---|
| A | 32285 | 27870 | 0 | 0 | 0.00% | 0.00% | 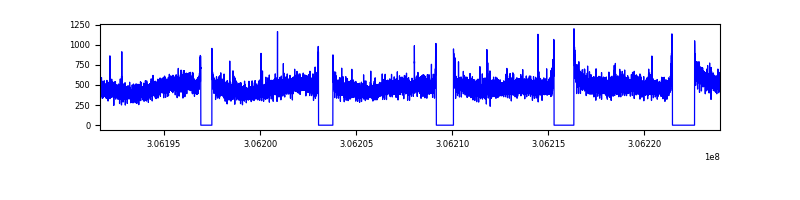 |
| B | 32286 | 27872 | 14 | 14 | 0.04% | 0.05% | 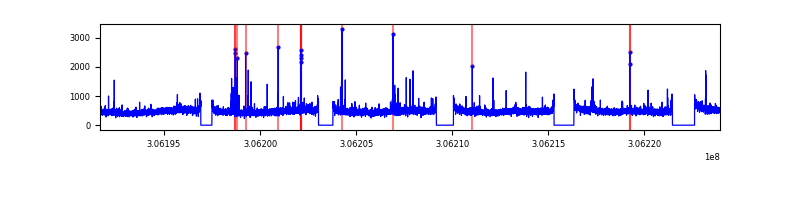 |
| C | 32286 | 27871 | 0 | 0 | 0.00% | 0.00% | 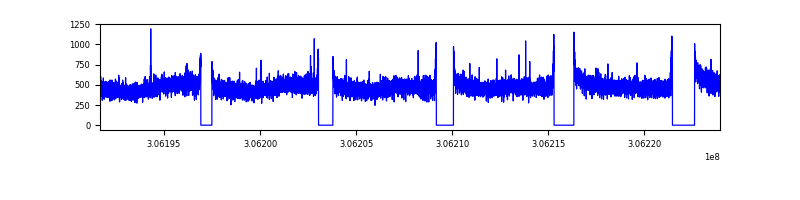 |
| D | 32285 | 27871 | 449 | 449 | 1.39% | 1.61% | 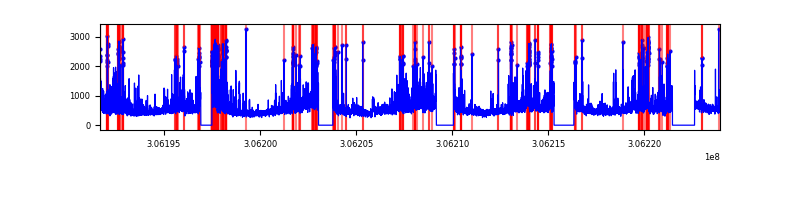 |
Top three noisy pixels from each quadrant. If the there are fewer than three noisy pixels in the level2.evt file, extra rows are filled as -1
| Pixel properties | Quadrant properties | ||||||
|---|---|---|---|---|---|---|---|
| Quadrant | DetID | PixID | Counts | Sigma | Mean | Median | Sigma |
| A | 11 | 47 | 97960 | 140.14 | 3404 | 3339 | 675.2 |
| A | 13 | 254 | 43488 | 59.46 | 3404 | 3339 | 675.2 |
| A | 3 | 1 | 37656 | 50.82 | 3404 | 3339 | 675.2 |
| B | 3 | 64 | 133635 | 202.9 | 3398 | 3318 | 642.3 |
| B | 0 | 230 | 80949 | 120.87 | 3398 | 3318 | 642.3 |
| B | 12 | 111 | 77502 | 115.5 | 3398 | 3318 | 642.3 |
| C | 14 | 238 | 514590 | 669.69 | 3259 | 3274 | 763.5 |
| C | 13 | 61 | 22549 | 25.25 | 3259 | 3274 | 763.5 |
| C | 3 | 233 | 21177 | 23.45 | 3259 | 3274 | 763.5 |
| D | 12 | 235 | 1683161 | 2138.57 | 3276 | 3186 | 785.6 |
| D | 7 | 38 | 1136187 | 1442.29 | 3276 | 3186 | 785.6 |
| D | 1 | 20 | 1046863 | 1328.58 | 3276 | 3186 | 785.6 |
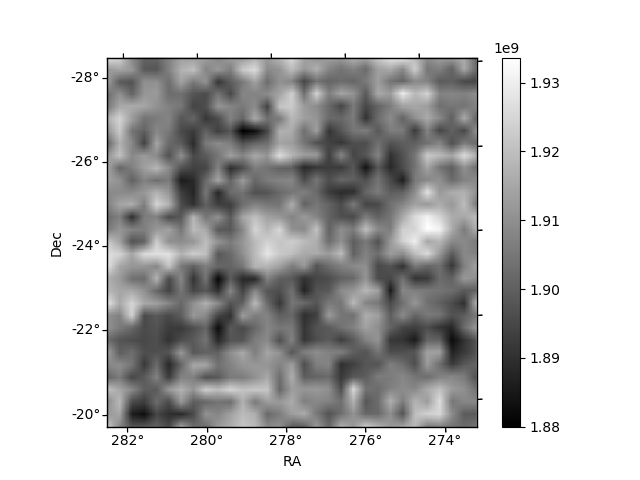
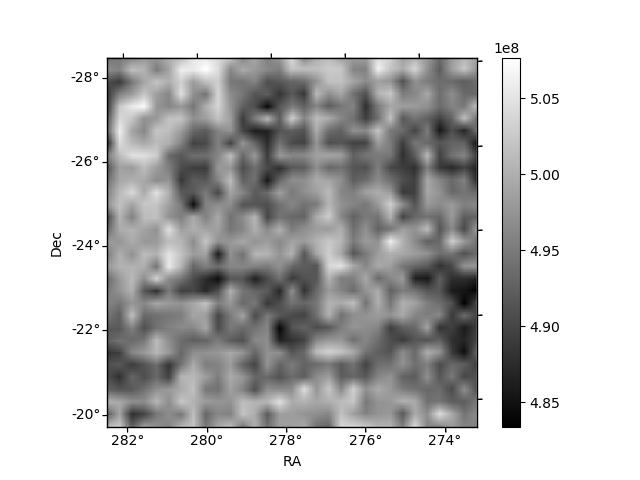
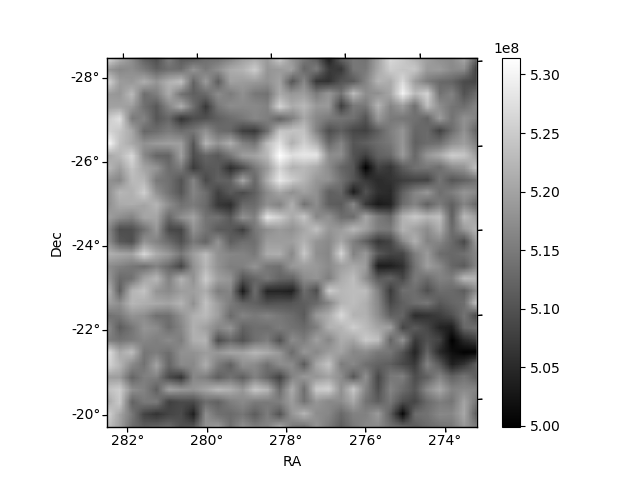
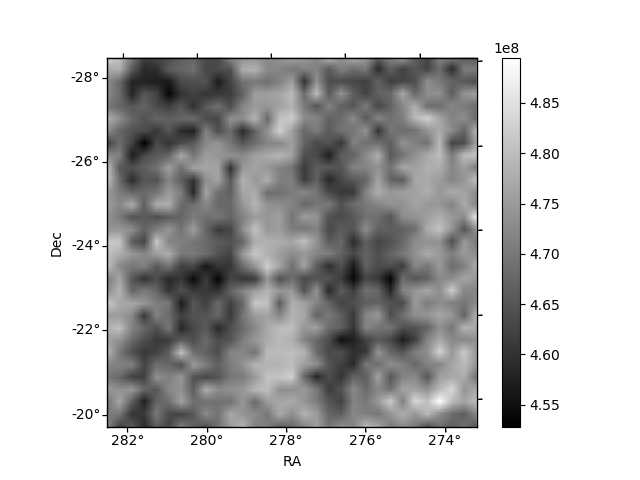
Histogram calculated using DETX and DETY for each event in the final _common_clean file
| Quadrant A | 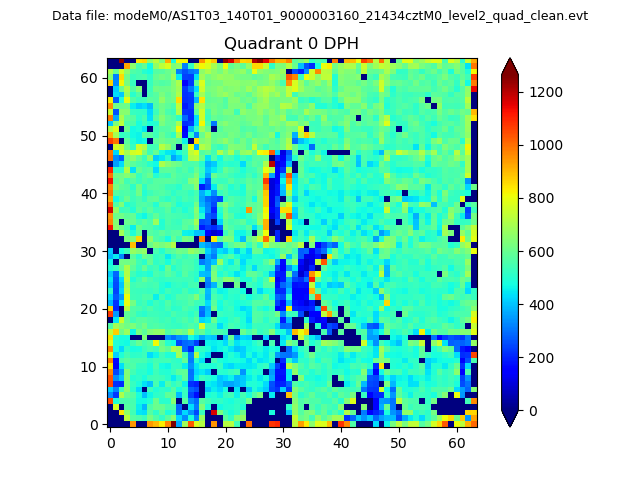 |
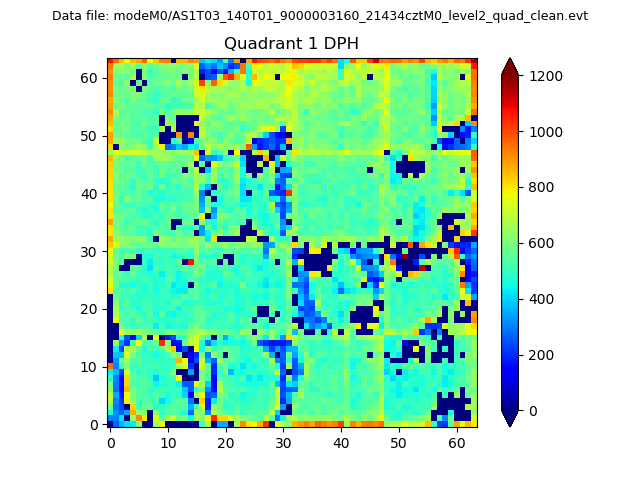 |
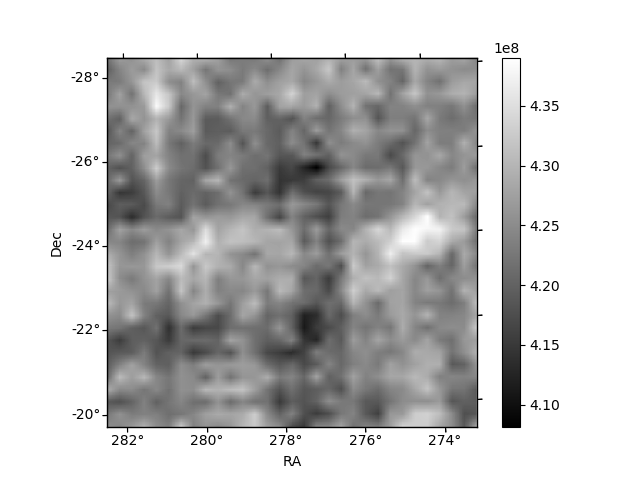
Quadrant B |
|---|---|---|---|
| Quadrant D |  |
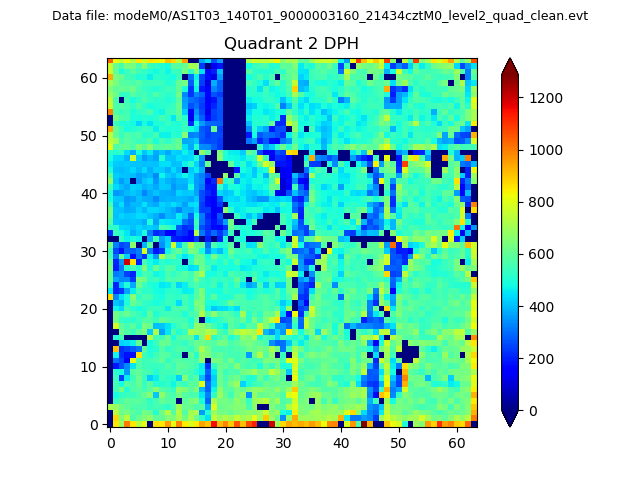 |
Quadrant C |
| Plot type | Count rate plots | Images |
|---|---|---|
| Comparison with Poisson distribution Blue bars denote a histogram of data divided into 1 sec bins. Red curve is a Poisson curve with rate = median count rate of data. |
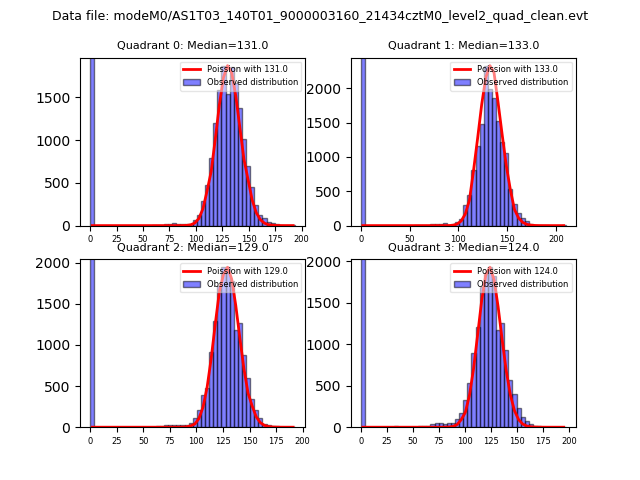 |
 |
| Quadrant-wise count rates Data is divided into 100 sec bins |
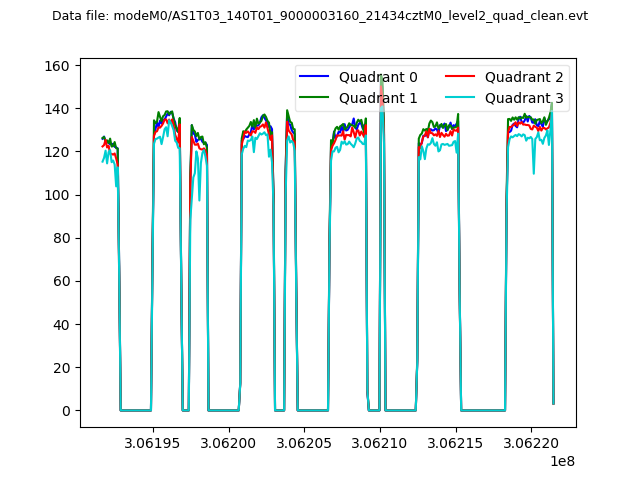 |
|
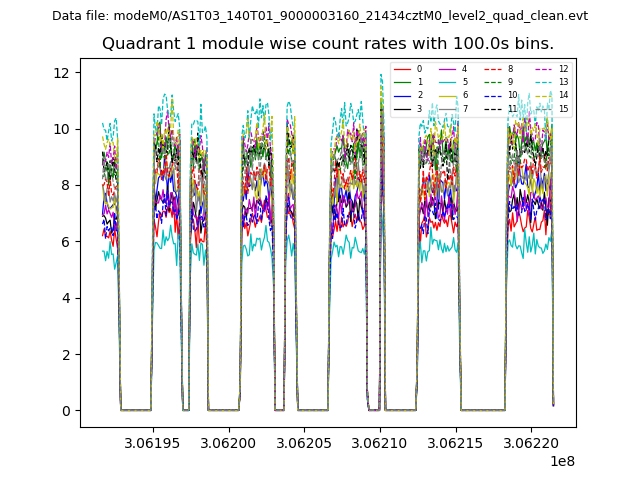
| Module-wise count rates for Quadrant A Data is divided into 100 sec bins |
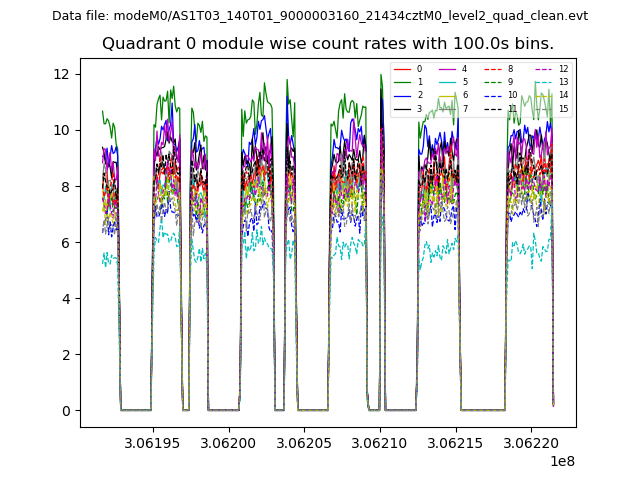 |
 |
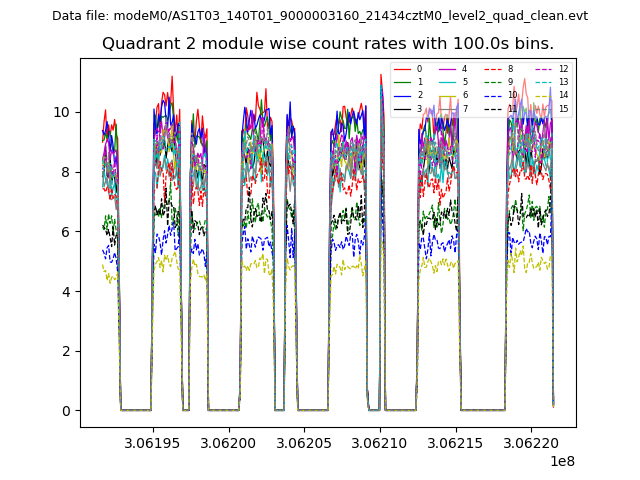
| Module-wise count rates for Quadrant B Data is divided into 100 sec bins |
 |
 |
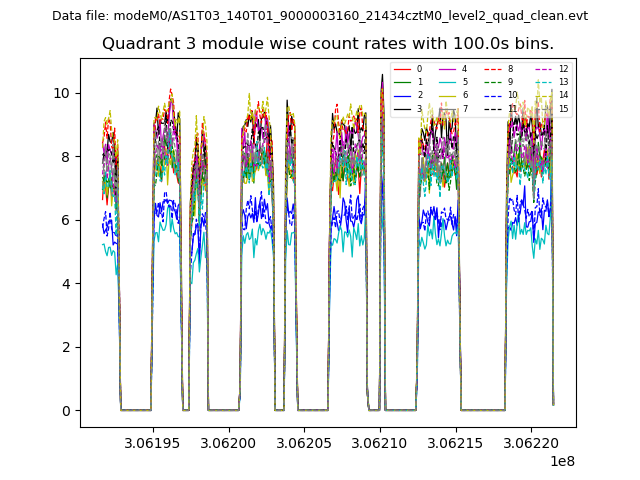
| Module-wise count rates for Quadrant C Data is divided into 100 sec bins |
 |
 |
| Module-wise count rates for Quadrant D Data is divided into 100 sec bins |
 |
 |
| Parameter | Plot |
|---|---|
| CZT HV Monitor |  |
| D_VDD | 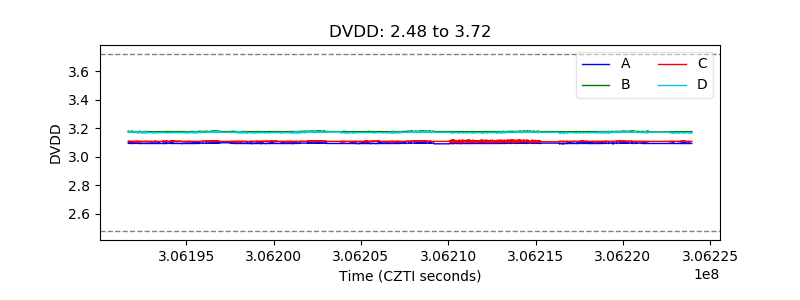 |
| Temperature 1 | 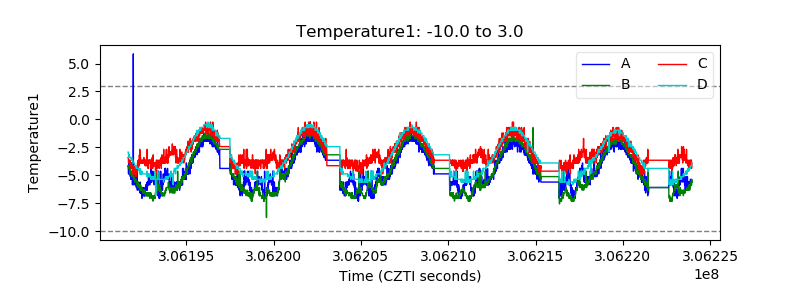 |
| Veto HV Monitor | 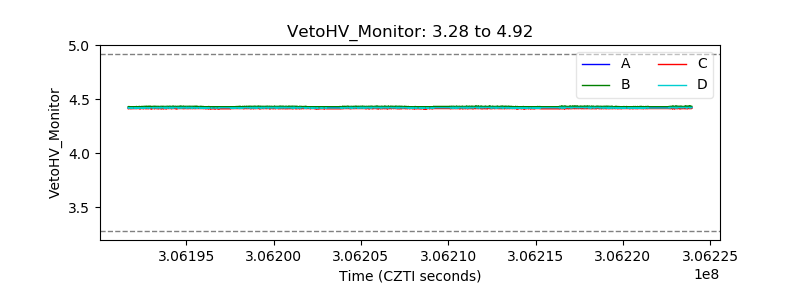 |
| Veto LLD | 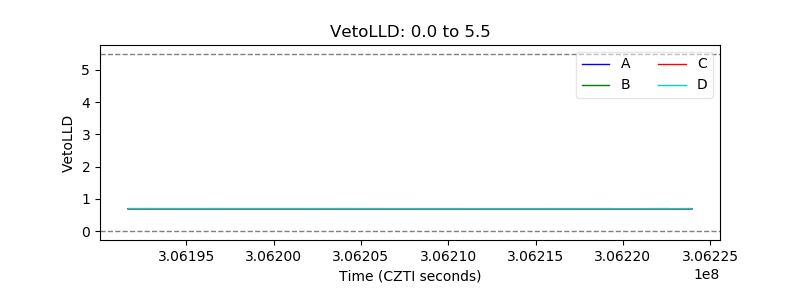 |
| Alpha Counter | 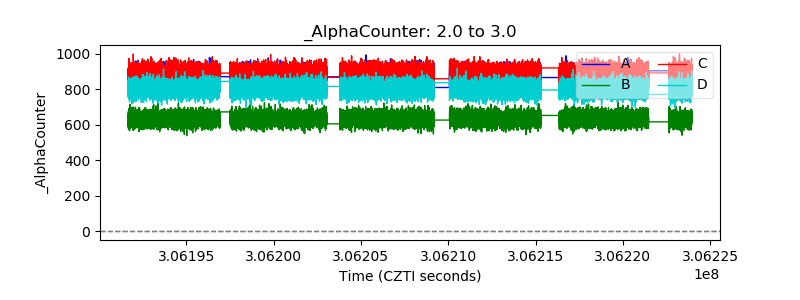 |
| _CPM_Rate | 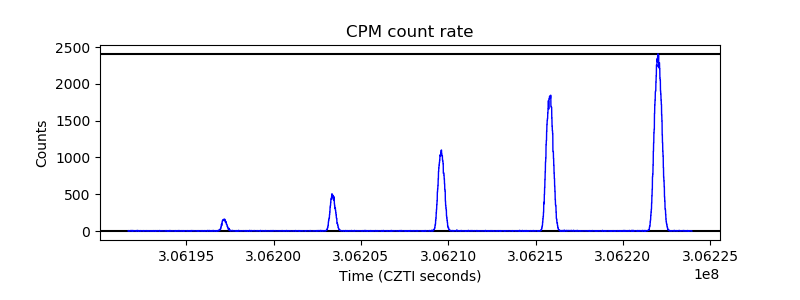 |
| CZT Counter | 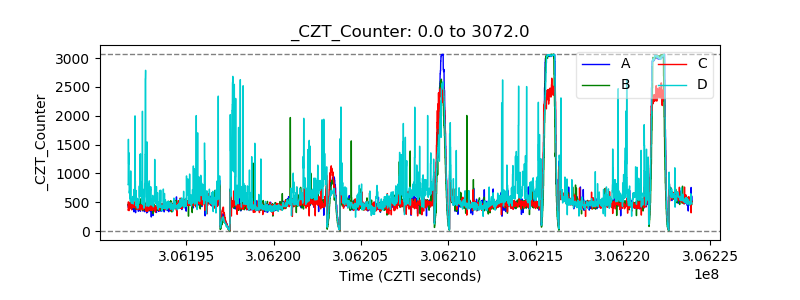 |
| +2.5 Volts monitor |  |
| +5 Volts monitor | 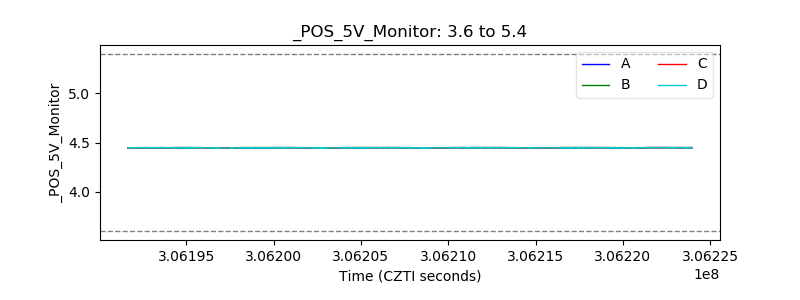 |
| _ROLL_ROT | 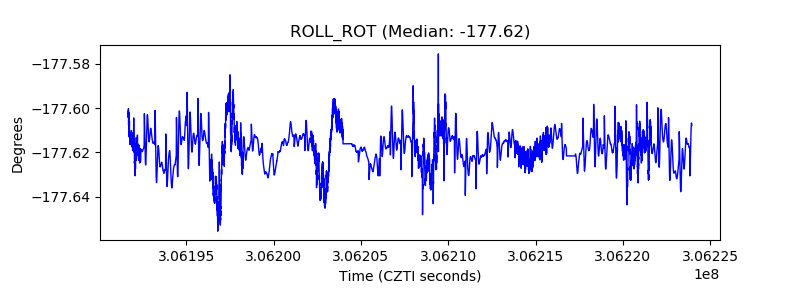 |
| _Roll_DEC | 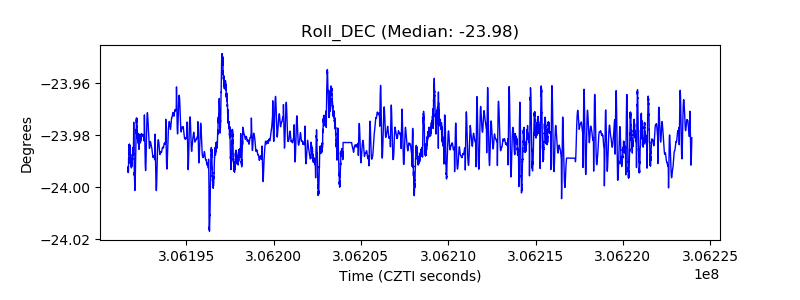 |
| _Roll_RA | 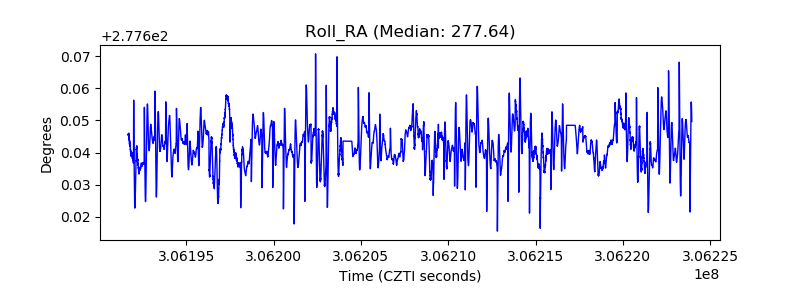 |
| Veto Counter | 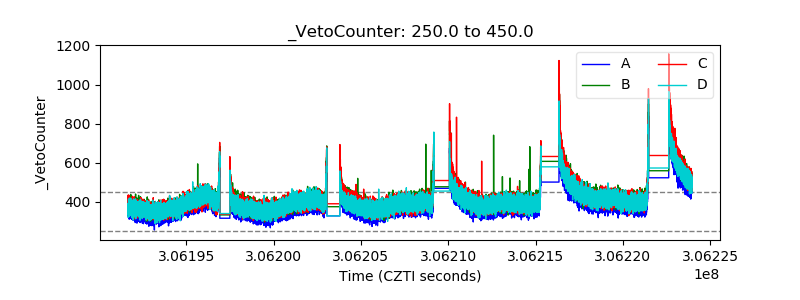 |