| Param | Original file | Final file |
|---|---|---|
| Filename | modeM0/AS1T03_140T01_9000003160_21436cztM0_level2.evt | modeM0/AS1T03_140T01_9000003160_21436cztM0_level2_quad_clean.evt |
| Size (bytes) | 514,330,560 | 96,912,000 |
| Size | 490.5 MB | 92.4 MB |
| Events in quadrant A | 3,576,264 | 637,353 |
| Events in quadrant B | 3,577,635 | 645,965 |
| Events in quadrant C | 3,510,408 | 617,696 |
| Events in quadrant D | 4,483,288 | 592,646 |
| Mode SS | |||
|---|---|---|---|
| Quadrant | BADHDUFLAG | Total packets | Discarded packets |
| A | 0 | 128 | 0 |
| B | 0 | 128 | 0 |
| C | 0 | 128 | 0 |
| D | 0 | 128 | 0 |
| Mode M0 | |||
|---|---|---|---|
| Quadrant | BADHDUFLAG | Total packets | Discarded packets |
| A | 0 | 14674 | 2 |
| B | 0 | 14597 | 2 |
| C | 0 | 14484 | 2 |
| D | 0 | 17625 | 2 |
| Mode M9 | |||
|---|---|---|---|
| Quadrant | BADHDUFLAG | Total packets | Discarded packets |
| A | 0 | 17 | 0 |
| B | 0 | 18 | 0 |
| C | 0 | 18 | 0 |
| D | 0 | 18 | 0 |
| Quadrant | Total seconds | Saturated seconds | Saturation percentage |
|---|---|---|---|
| A | 6326 | 110 | 1.738856% |
| B | 6326 | 128 | 2.023396% |
| C | 6326 | 168 | 2.655707% |
| D | 6326 | 239 | 3.778059% |
Noise dominated data is calculated using 1-second bins in cleaned event files. If a bin has >2000 counts, and if more than 50% of those come from <1% of pixels, then it is considered to be noise-dominated and hence unusable.
| Quadrant | # 1 sec bins | Bins with >0 counts | Bins with >2000 counts | High rate bins dominated by noise | Noise dominated (total time) | Noise dominated (detector-on time) | Marked lightcurve |
|---|---|---|---|---|---|---|---|
| A | 7596 | 6326 | 0 | 0 | 0.00% | 0.00% | 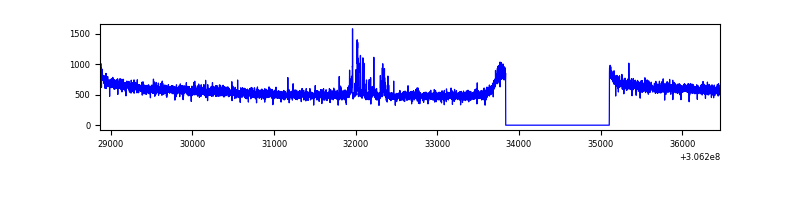 |
| B | 7596 | 6326 | 3 | 3 | 0.04% | 0.05% | 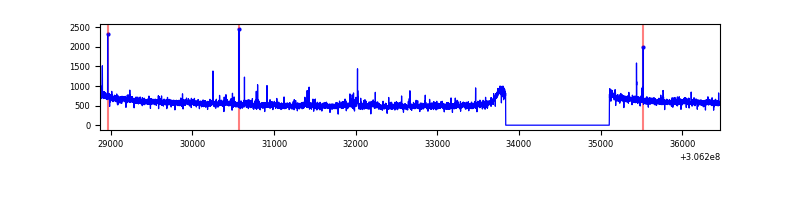 |
| C | 7596 | 6326 | 0 | 0 | 0.00% | 0.00% | 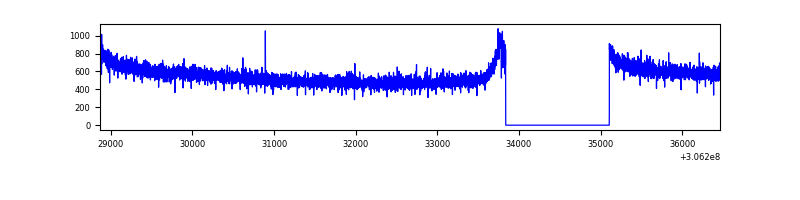 |
| D | 7596 | 6326 | 142 | 142 | 1.87% | 2.24% | 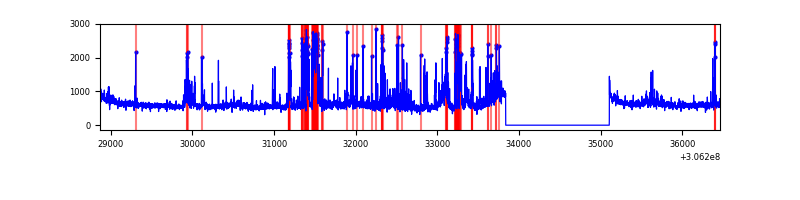 |
Top three noisy pixels from each quadrant. If the there are fewer than three noisy pixels in the level2.evt file, extra rows are filled as -1
| Pixel properties | Quadrant properties | ||||||
|---|---|---|---|---|---|---|---|
| Quadrant | DetID | PixID | Counts | Sigma | Mean | Median | Sigma |
| A | 15 | 174 | 57647 | 314.58 | 912 | 898 | 180.4 |
| A | 13 | 254 | 9767 | 49.16 | 912 | 898 | 180.4 |
| A | 0 | 226 | 7997 | 39.35 | 912 | 898 | 180.4 |
| B | 0 | 197 | 22558 | 131.15 | 896 | 877 | 165.3 |
| B | 12 | 111 | 19148 | 110.52 | 896 | 877 | 165.3 |
| B | 11 | 111 | 17217 | 98.84 | 896 | 877 | 165.3 |
| C | 14 | 238 | 137977 | 697.38 | 863 | 872 | 196.6 |
| C | 13 | 61 | 6042 | 26.3 | 863 | 872 | 196.6 |
| C | 3 | 233 | 5460 | 23.34 | 863 | 872 | 196.6 |
| D | 7 | 38 | 237315 | 1123.63 | 878 | 858 | 210.4 |
| D | 12 | 235 | 231754 | 1097.2 | 878 | 858 | 210.4 |
| D | 1 | 20 | 170900 | 808.03 | 878 | 858 | 210.4 |
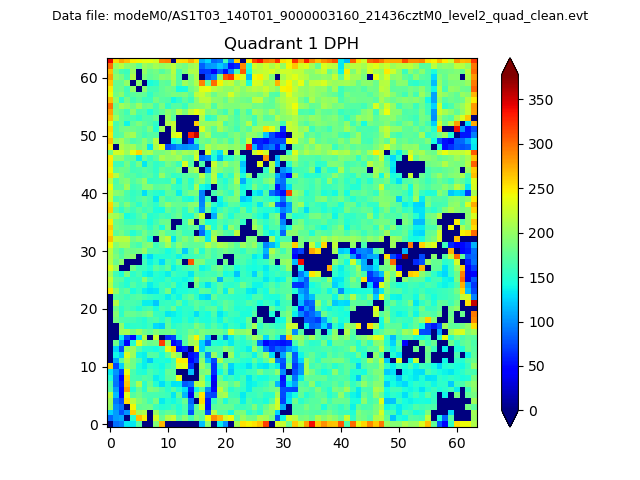
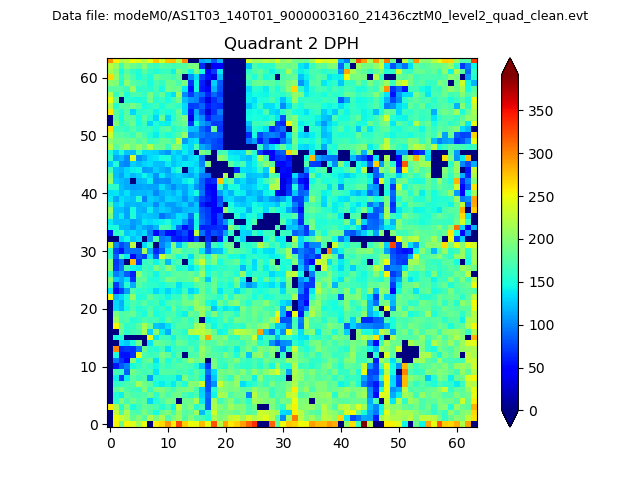
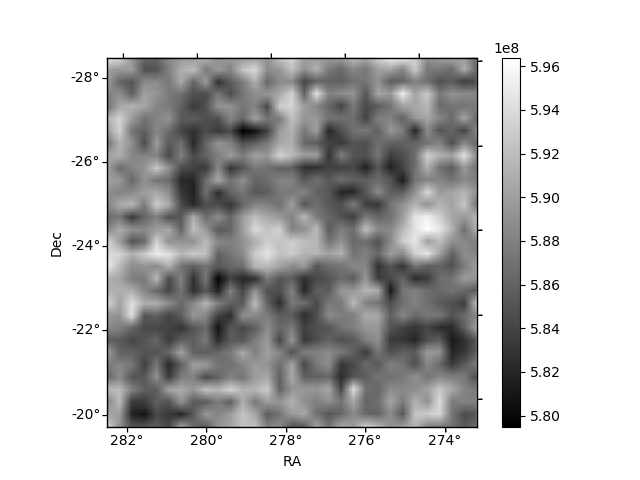
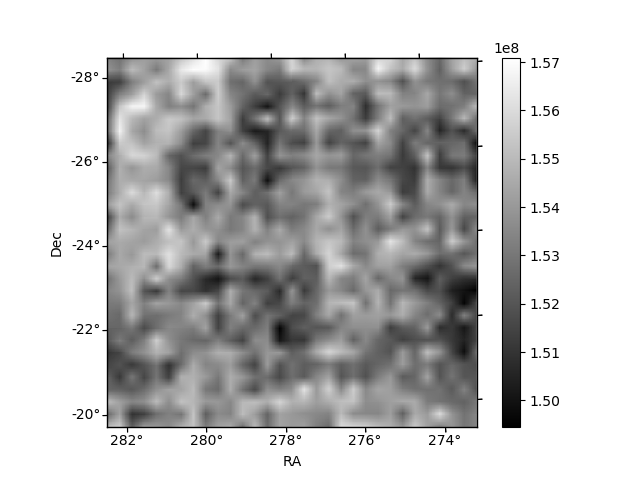
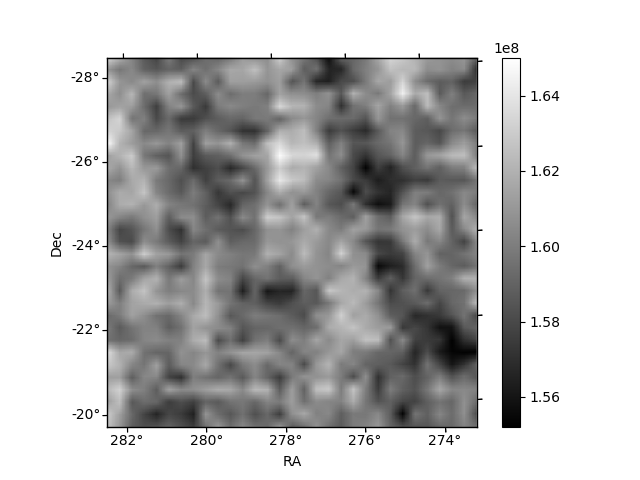
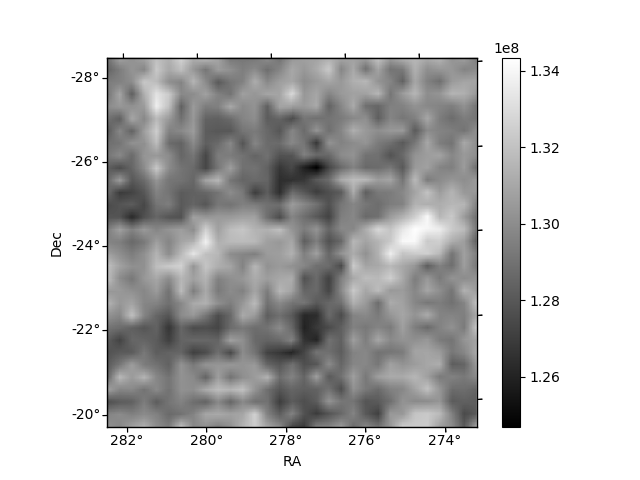
Histogram calculated using DETX and DETY for each event in the final _common_clean file
| Quadrant A |  |
 |
Quadrant B |
|---|---|---|---|
| Quadrant D | 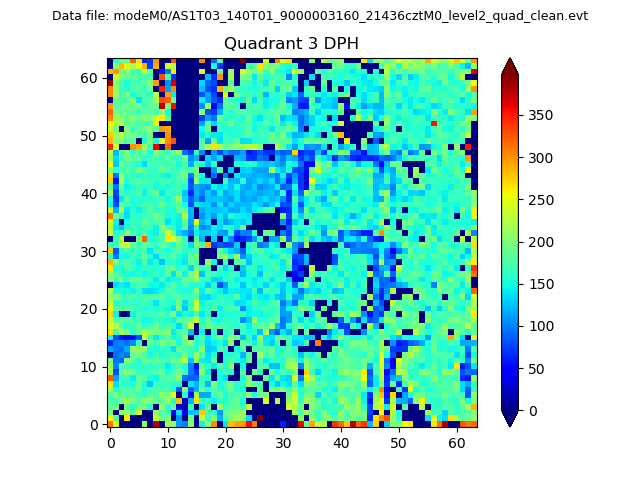 |
 |
Quadrant C |
| Plot type | Count rate plots | Images |
|---|---|---|
| Comparison with Poisson distribution Blue bars denote a histogram of data divided into 1 sec bins. Red curve is a Poisson curve with rate = median count rate of data. |
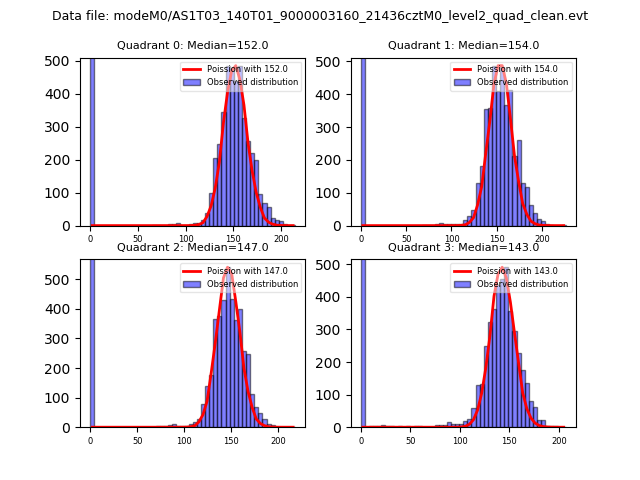 |
 |
| Quadrant-wise count rates Data is divided into 100 sec bins |
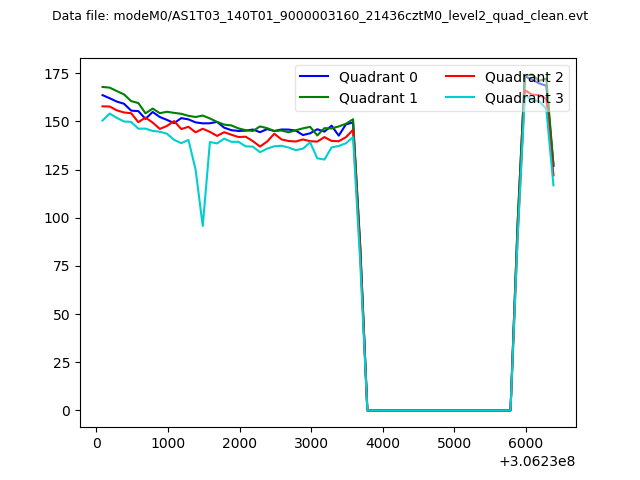 |
|
| Module-wise count rates for Quadrant A Data is divided into 100 sec bins |
 |
 |
| Module-wise count rates for Quadrant B Data is divided into 100 sec bins |
 |
 |
| Module-wise count rates for Quadrant C Data is divided into 100 sec bins |
 |
 |
| Module-wise count rates for Quadrant D Data is divided into 100 sec bins |
 |
 |
| Parameter | Plot |
|---|---|
| CZT HV Monitor |  |
| D_VDD | 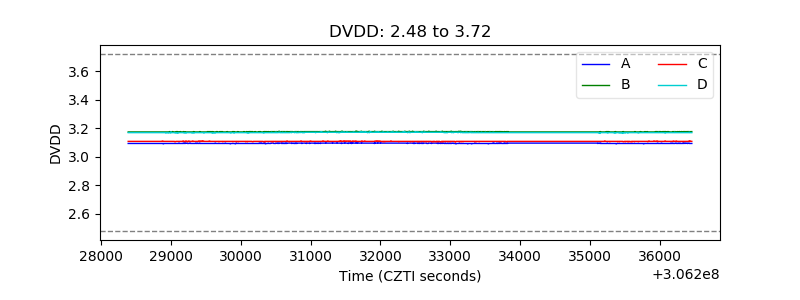 |
| Temperature 1 |  |
| Veto HV Monitor | 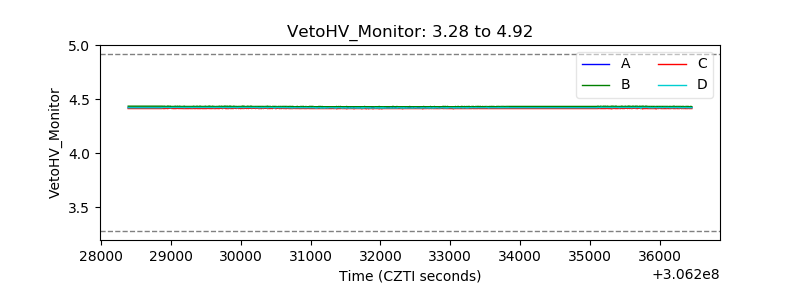 |
| Veto LLD | 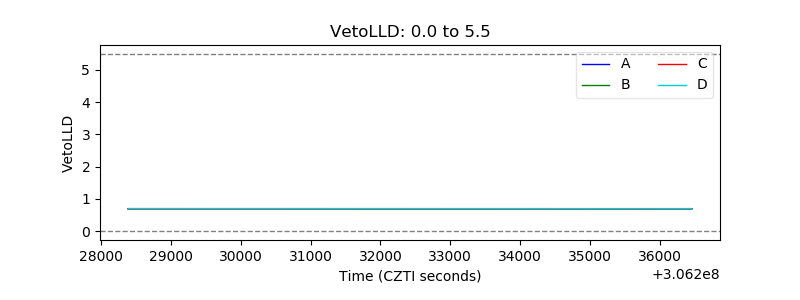 |
| Alpha Counter | 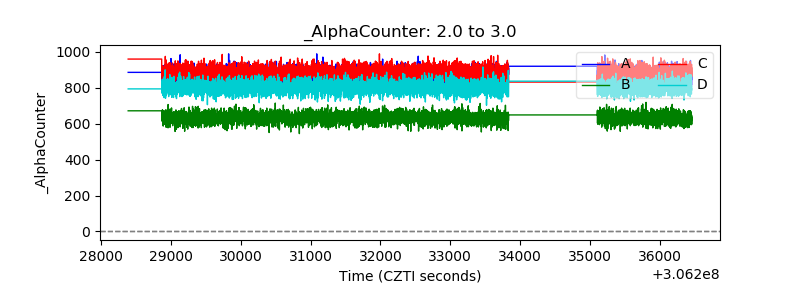 |
| _CPM_Rate | 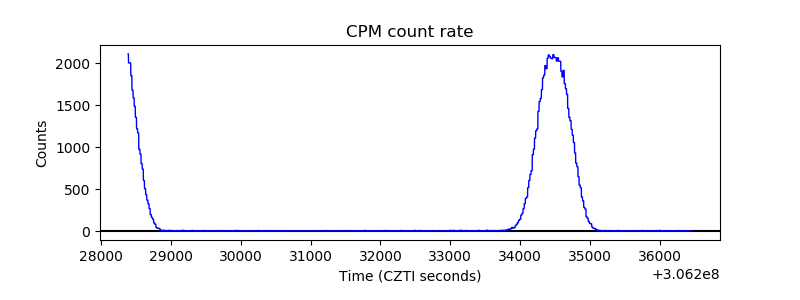 |
| CZT Counter | 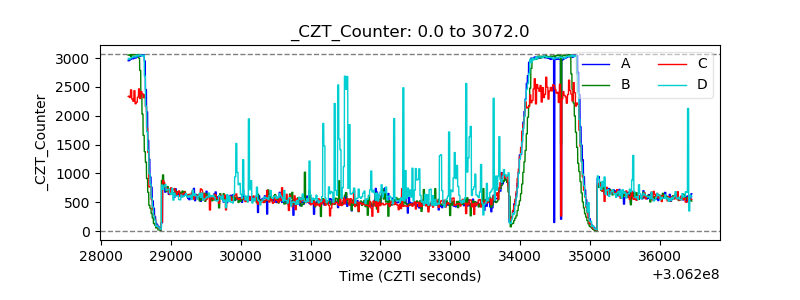 |
| +2.5 Volts monitor |  |
| +5 Volts monitor | 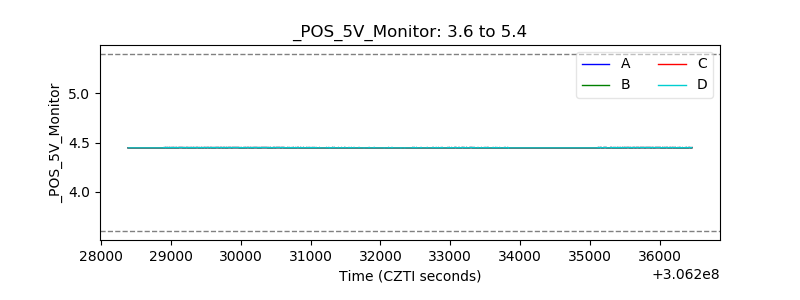 |
| _ROLL_ROT | 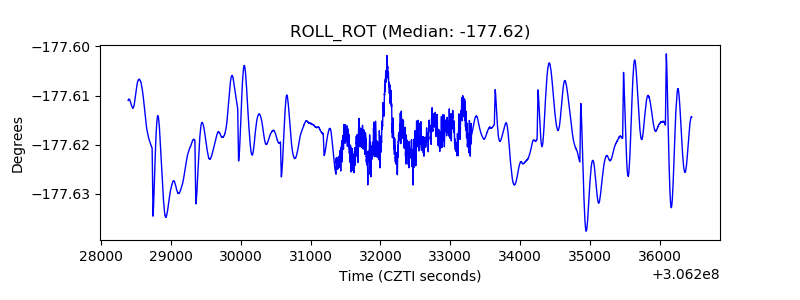 |
| _Roll_DEC | 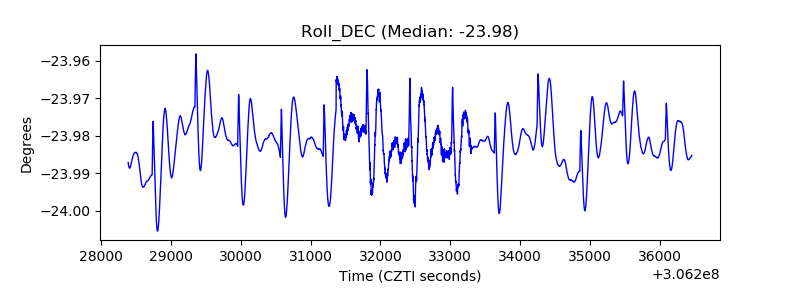 |
| _Roll_RA | 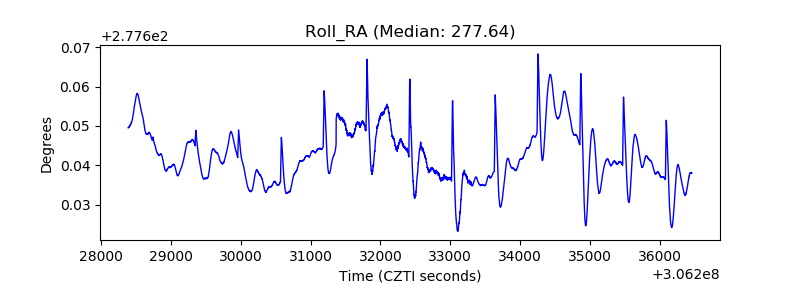 |
| Veto Counter | 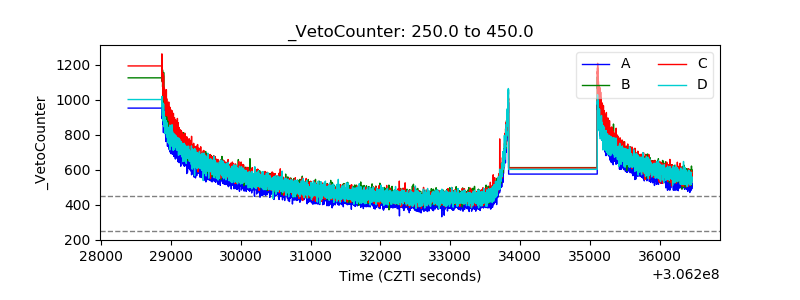 |