| Param | Original file | Final file |
|---|---|---|
| Filename | modeM0/AS1T03_140T01_9000003160_21438cztM0_level2.evt | modeM0/AS1T03_140T01_9000003160_21438cztM0_level2_quad_clean.evt |
| Size (bytes) | 512,470,080 | 111,332,160 |
| Size | 488.7 MB | 106.2 MB |
| Events in quadrant A | 3,250,029 | 759,149 |
| Events in quadrant B | 3,530,833 | 755,784 |
| Events in quadrant C | 3,224,711 | 725,496 |
| Events in quadrant D | 5,090,626 | 695,236 |
| Mode SS | |||
|---|---|---|---|
| Quadrant | BADHDUFLAG | Total packets | Discarded packets |
| A | 0 | 128 | 0 |
| B | 0 | 128 | 0 |
| C | 0 | 128 | 0 |
| D | 0 | 128 | 0 |
| Mode M0 | |||
|---|---|---|---|
| Quadrant | BADHDUFLAG | Total packets | Discarded packets |
| A | 0 | 13485 | 2 |
| B | 0 | 14327 | 1 |
| C | 0 | 13421 | 1 |
| D | 0 | 19360 | 1 |
| Mode M9 | |||
|---|---|---|---|
| Quadrant | BADHDUFLAG | Total packets | Discarded packets |
| A | 0 | 12 | 0 |
| B | 0 | 12 | 0 |
| C | 0 | 12 | 0 |
| D | 0 | 12 | 0 |
| Quadrant | Total seconds | Saturated seconds | Saturation percentage |
|---|---|---|---|
| A | 6245 | 151 | 2.417934% |
| B | 6245 | 214 | 3.426741% |
| C | 6246 | 178 | 2.849824% |
| D | 6246 | 353 | 5.651617% |
Noise dominated data is calculated using 1-second bins in cleaned event files. If a bin has >2000 counts, and if more than 50% of those come from <1% of pixels, then it is considered to be noise-dominated and hence unusable.
| Quadrant | # 1 sec bins | Bins with >0 counts | Bins with >2000 counts | High rate bins dominated by noise | Noise dominated (total time) | Noise dominated (detector-on time) | Marked lightcurve |
|---|---|---|---|---|---|---|---|
| A | 7411 | 6246 | 0 | 0 | 0.00% | 0.00% | 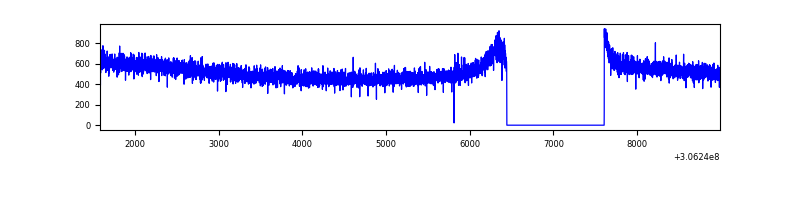 |
| B | 7411 | 6246 | 59 | 59 | 0.80% | 0.94% | 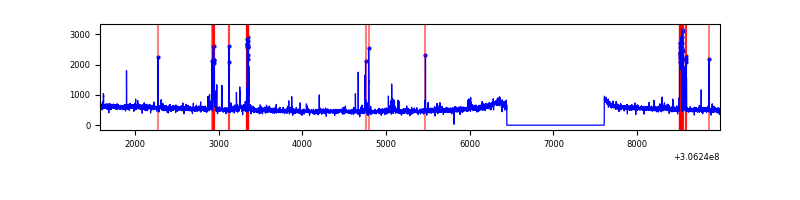 |
| C | 7412 | 6247 | 0 | 0 | 0.00% | 0.00% | 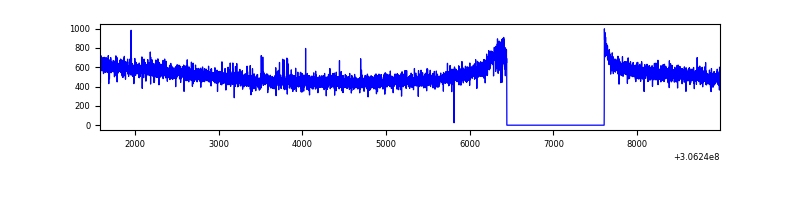 |
| D | 7412 | 6247 | 237 | 237 | 3.20% | 3.79% |  |
Top three noisy pixels from each quadrant. If the there are fewer than three noisy pixels in the level2.evt file, extra rows are filled as -1
| Pixel properties | Quadrant properties | ||||||
|---|---|---|---|---|---|---|---|
| Quadrant | DetID | PixID | Counts | Sigma | Mean | Median | Sigma |
| A | 13 | 254 | 9669 | 52.15 | 842 | 826 | 169.6 |
| A | 0 | 226 | 7269 | 38.0 | 842 | 826 | 169.6 |
| A | 3 | 137 | 6441 | 33.11 | 842 | 826 | 169.6 |
| B | 10 | 247 | 104572 | 664.11 | 824 | 806 | 156.2 |
| B | 0 | 189 | 50215 | 316.22 | 824 | 806 | 156.2 |
| B | 3 | 64 | 48515 | 305.34 | 824 | 806 | 156.2 |
| C | 14 | 238 | 127005 | 692.53 | 791 | 798 | 182.2 |
| C | 0 | 236 | 8359 | 41.49 | 791 | 798 | 182.2 |
| C | 13 | 61 | 5468 | 25.63 | 791 | 798 | 182.2 |
| D | 1 | 20 | 879467 | 4493.99 | 808 | 784 | 195.5 |
| D | 12 | 235 | 461628 | 2356.97 | 808 | 784 | 195.5 |
| D | 7 | 38 | 267014 | 1361.62 | 808 | 784 | 195.5 |
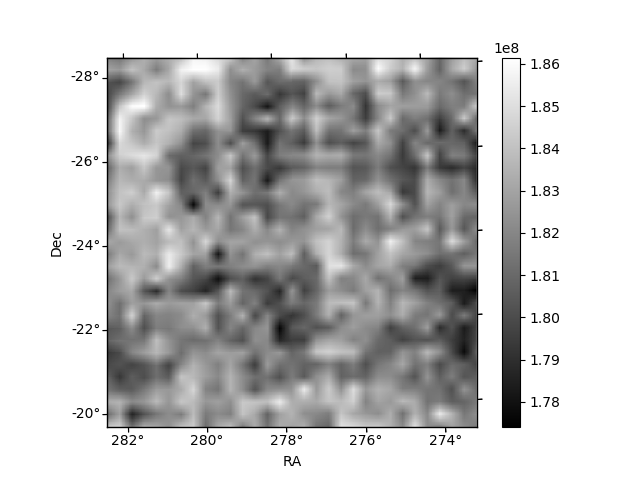
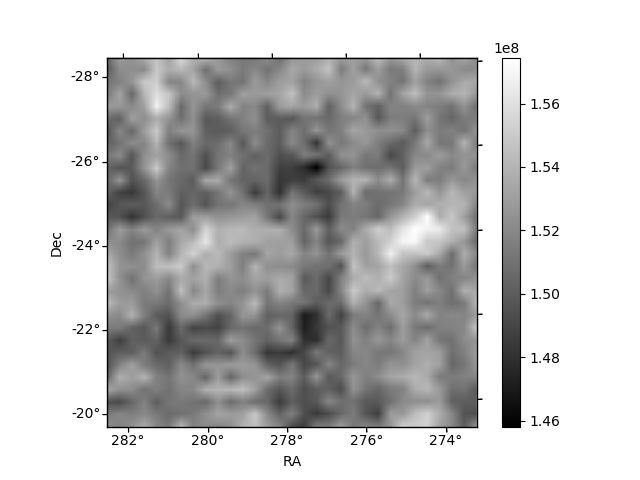
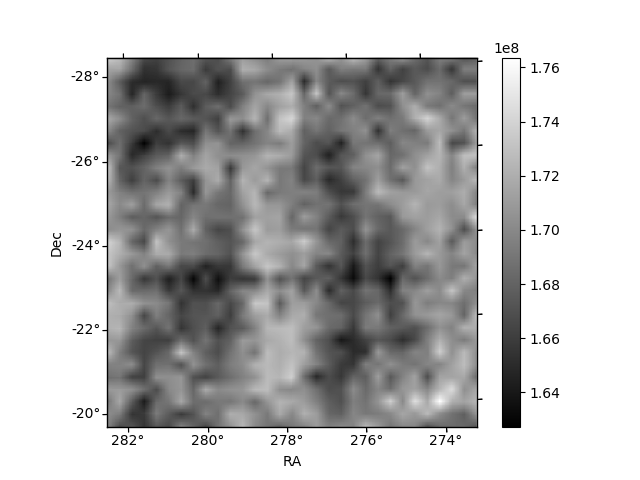
Histogram calculated using DETX and DETY for each event in the final _common_clean file
| Quadrant A |  |
 |
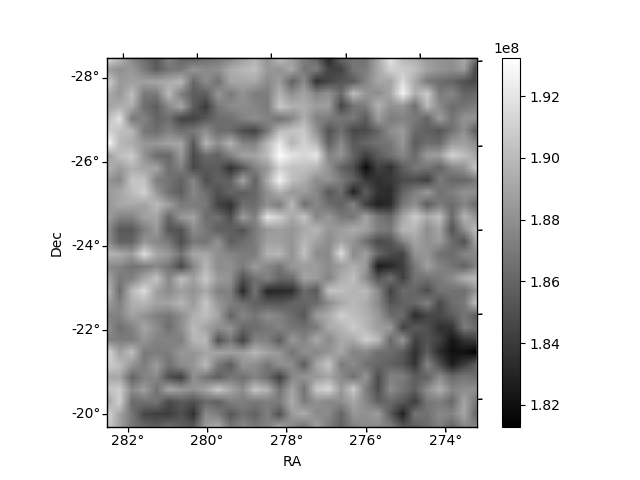
Quadrant B |
|---|---|---|---|
| Quadrant D | 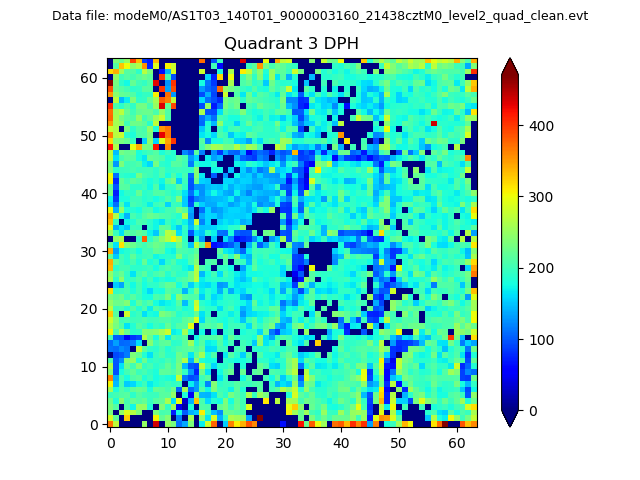 |
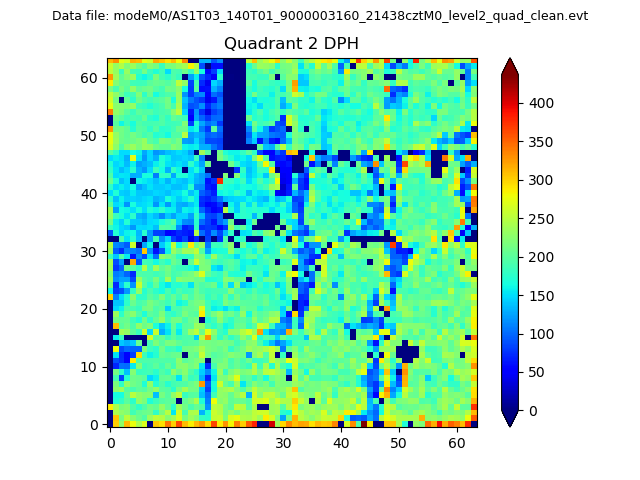 |
Quadrant C |
| Plot type | Count rate plots | Images |
|---|---|---|
| Comparison with Poisson distribution Blue bars denote a histogram of data divided into 1 sec bins. Red curve is a Poisson curve with rate = median count rate of data. |
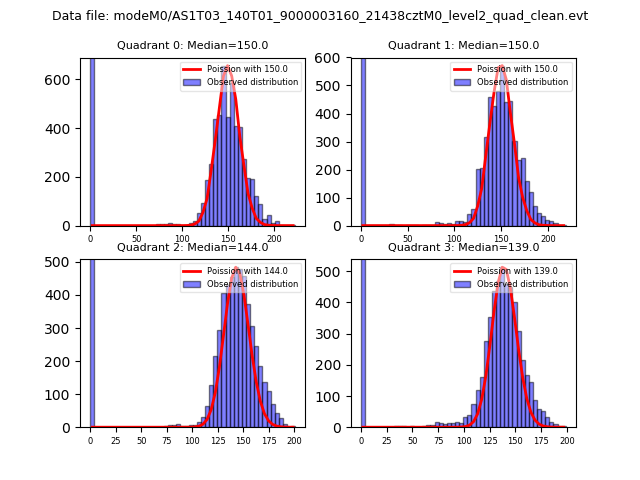 |
 |
| Quadrant-wise count rates Data is divided into 100 sec bins |
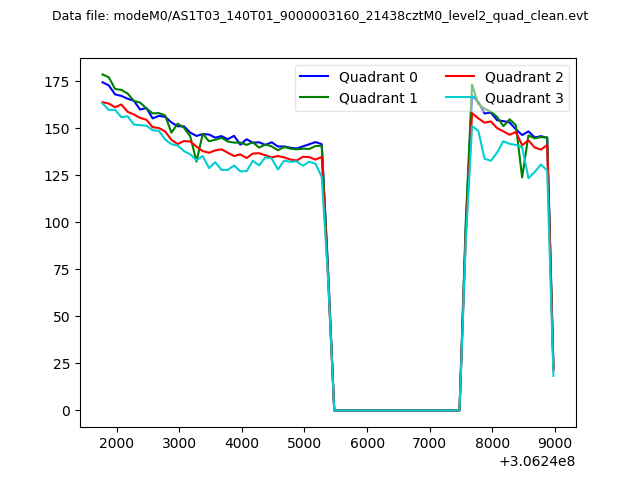 |
|
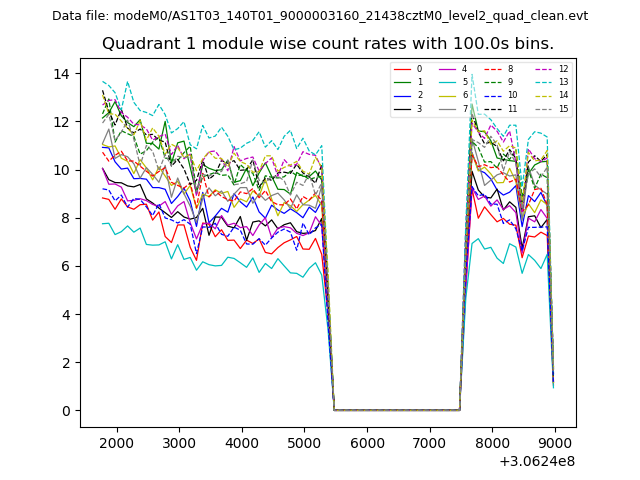
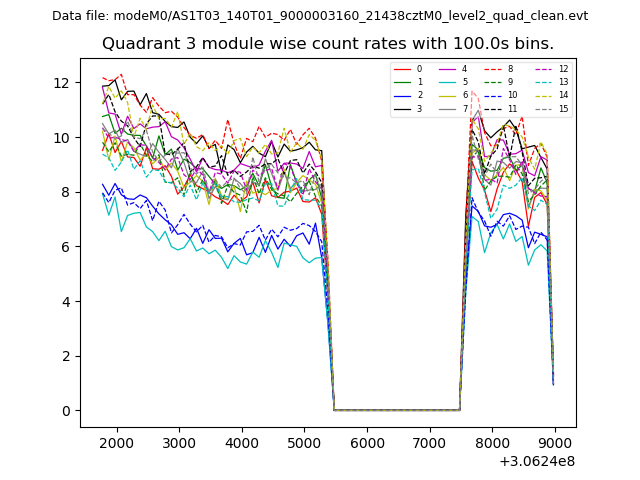
| Module-wise count rates for Quadrant A Data is divided into 100 sec bins |
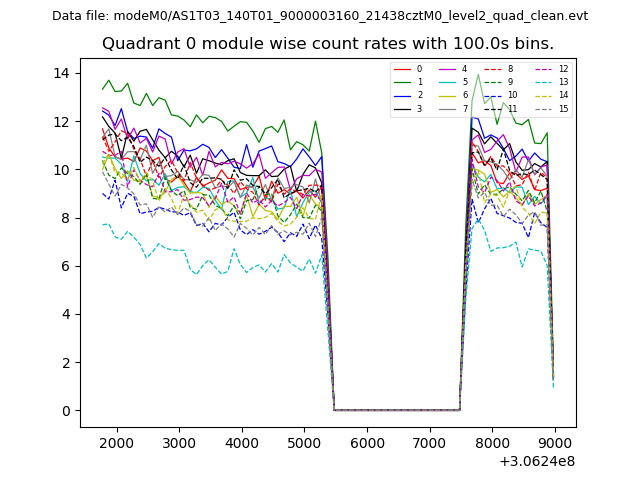 |
 |
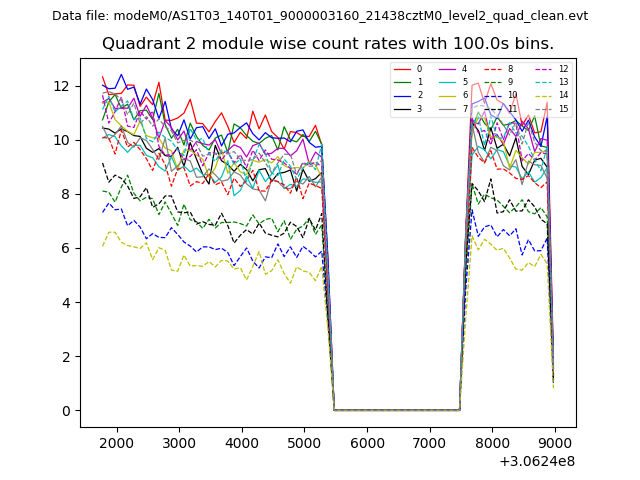
| Module-wise count rates for Quadrant B Data is divided into 100 sec bins |
 |
 |
| Module-wise count rates for Quadrant C Data is divided into 100 sec bins |
 |
 |
| Module-wise count rates for Quadrant D Data is divided into 100 sec bins |
 |
 |
| Parameter | Plot |
|---|---|
| CZT HV Monitor | 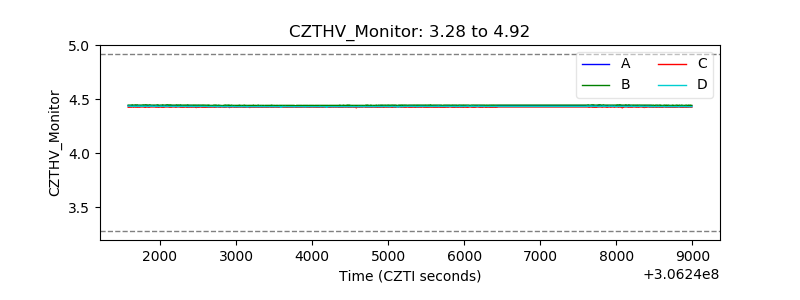 |
| D_VDD | 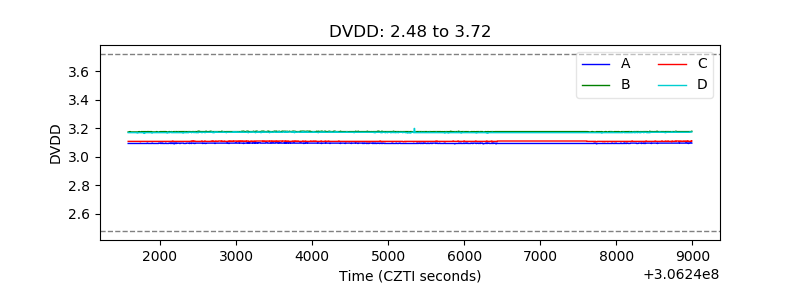 |
| Temperature 1 | 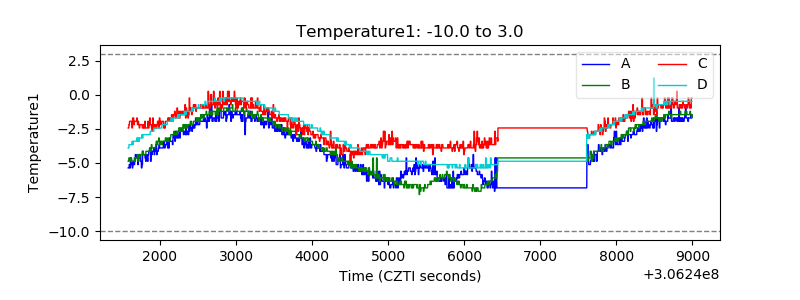 |
| Veto HV Monitor | 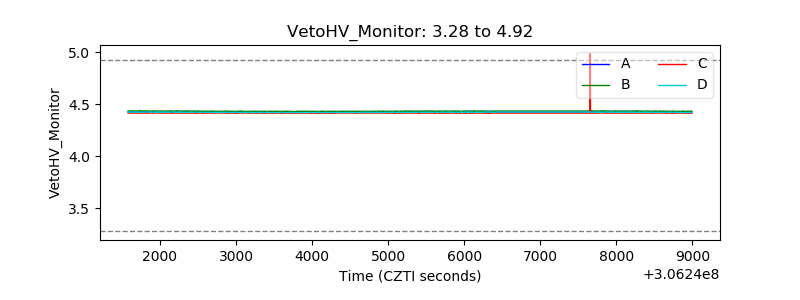 |
| Veto LLD | 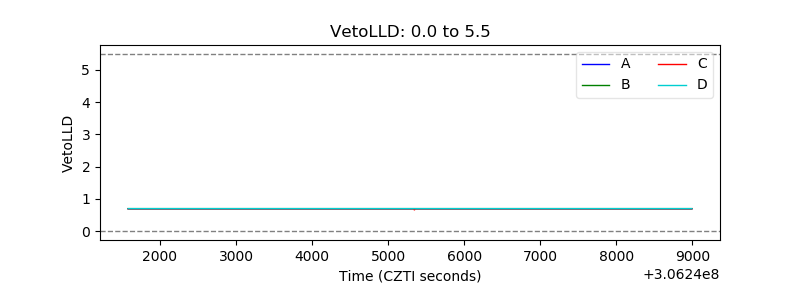 |
| Alpha Counter | 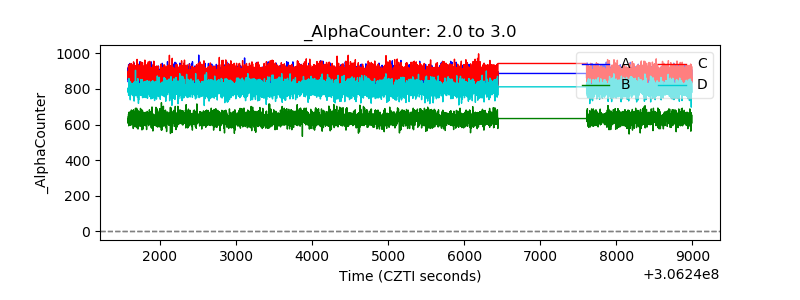 |
| _CPM_Rate | 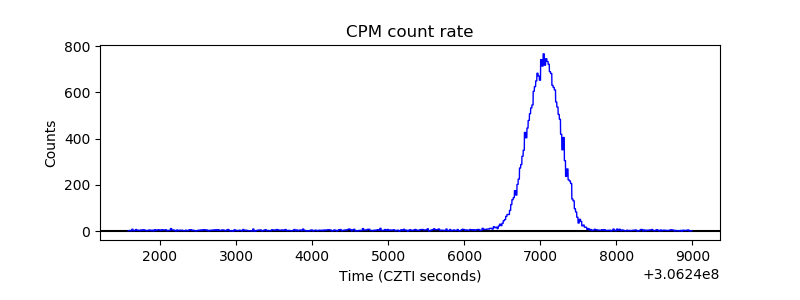 |
| CZT Counter |  |
| +2.5 Volts monitor |  |
| +5 Volts monitor | 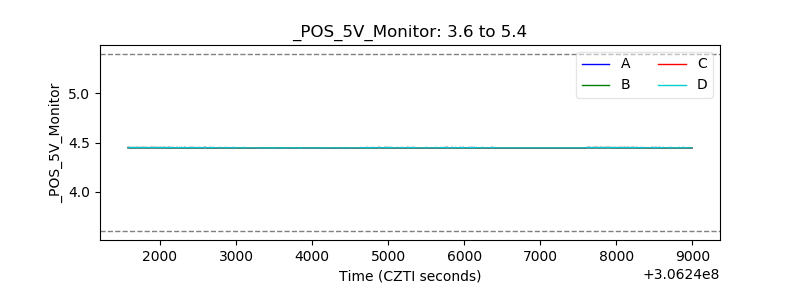 |
| _ROLL_ROT | 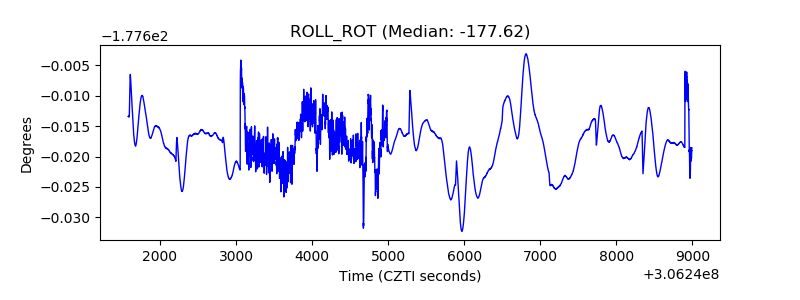 |
| _Roll_DEC | 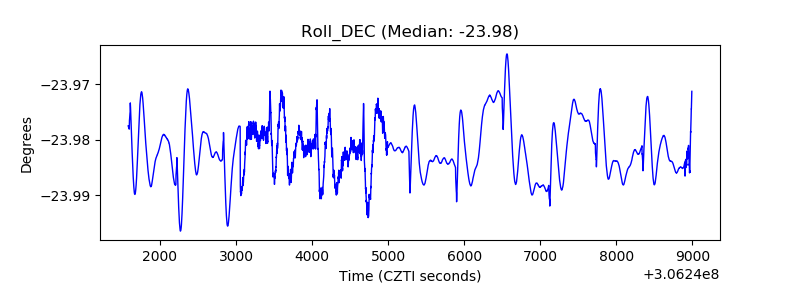 |
| _Roll_RA |  |
| Veto Counter | 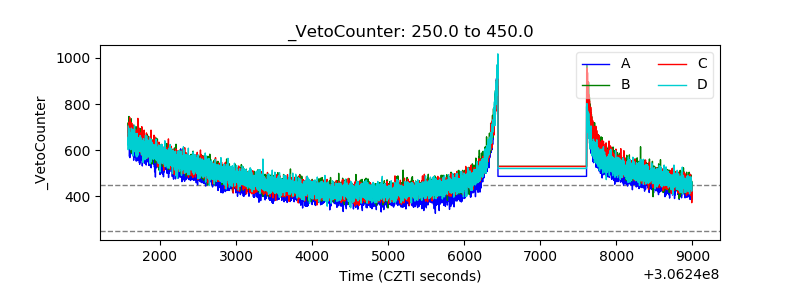 |