| Param | Original file | Final file |
|---|---|---|
| Filename | modeM0/AS1T03_140T01_9000003160_21439cztM0_level2.evt | modeM0/AS1T03_140T01_9000003160_21439cztM0_level2_quad_clean.evt |
| Size (bytes) | 587,790,720 | 110,188,800 |
| Size | 560.6 MB | 105.1 MB |
| Events in quadrant A | 3,429,658 | 741,926 |
| Events in quadrant B | 3,584,441 | 742,705 |
| Events in quadrant C | 3,384,998 | 715,423 |
| Events in quadrant D | 6,936,010 | 657,435 |
| Mode SS | |||
|---|---|---|---|
| Quadrant | BADHDUFLAG | Total packets | Discarded packets |
| A | 0 | 140 | 0 |
| B | 0 | 140 | 0 |
| C | 0 | 140 | 0 |
| D | 0 | 140 | 0 |
| Mode M0 | |||
|---|---|---|---|
| Quadrant | BADHDUFLAG | Total packets | Discarded packets |
| A | 0 | 14473 | 2 |
| B | 0 | 14926 | 2 |
| C | 0 | 14383 | 3 |
| D | 0 | 25451 | 2 |
| Mode M9 | |||
|---|---|---|---|
| Quadrant | BADHDUFLAG | Total packets | Discarded packets |
| A | 0 | 9 | 0 |
| B | 0 | 9 | 0 |
| C | 0 | 9 | 0 |
| D | 0 | 9 | 0 |
| Quadrant | Total seconds | Saturated seconds | Saturation percentage |
|---|---|---|---|
| A | 6879 | 103 | 1.497311% |
| B | 6880 | 137 | 1.991279% |
| C | 6879 | 113 | 1.642681% |
| D | 6879 | 671 | 9.754325% |
Noise dominated data is calculated using 1-second bins in cleaned event files. If a bin has >2000 counts, and if more than 50% of those come from <1% of pixels, then it is considered to be noise-dominated and hence unusable.
| Quadrant | # 1 sec bins | Bins with >0 counts | Bins with >2000 counts | High rate bins dominated by noise | Noise dominated (total time) | Noise dominated (detector-on time) | Marked lightcurve |
|---|---|---|---|---|---|---|---|
| A | 7829 | 6879 | 0 | 0 | 0.00% | 0.00% | 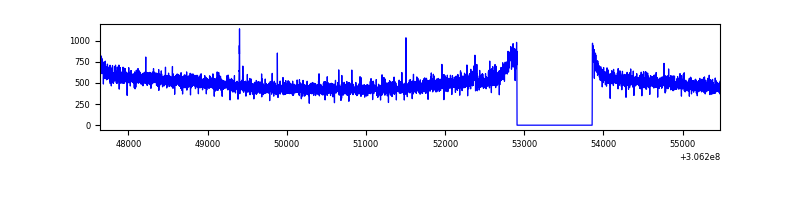 |
| B | 7830 | 6880 | 34 | 34 | 0.43% | 0.49% | 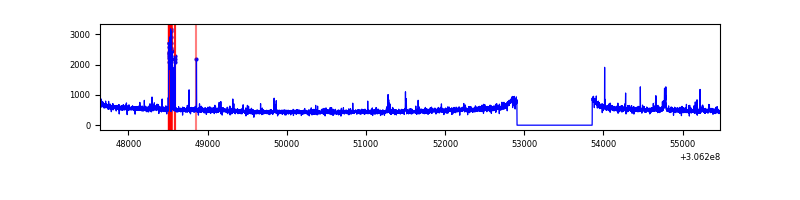 |
| C | 7829 | 6879 | 0 | 0 | 0.00% | 0.00% | 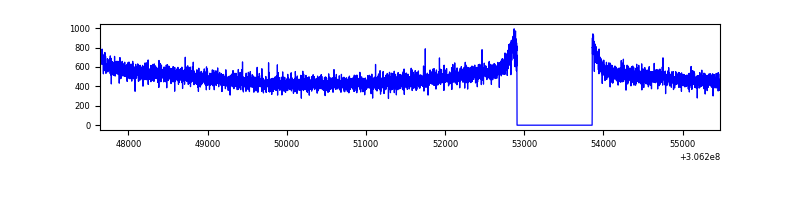 |
| D | 7829 | 6879 | 605 | 605 | 7.73% | 8.79% | 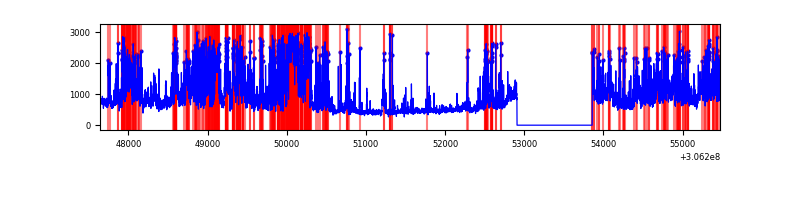 |
Top three noisy pixels from each quadrant. If the there are fewer than three noisy pixels in the level2.evt file, extra rows are filled as -1
| Pixel properties | Quadrant properties | ||||||
|---|---|---|---|---|---|---|---|
| Quadrant | DetID | PixID | Counts | Sigma | Mean | Median | Sigma |
| A | 11 | 47 | 13400 | 70.51 | 885 | 868 | 177.7 |
| A | 13 | 254 | 10893 | 56.41 | 885 | 868 | 177.7 |
| A | 0 | 226 | 7680 | 38.33 | 885 | 868 | 177.7 |
| B | 10 | 247 | 102016 | 607.39 | 871 | 849 | 166.6 |
| B | 0 | 190 | 28354 | 165.13 | 871 | 849 | 166.6 |
| B | 12 | 111 | 19265 | 110.57 | 871 | 849 | 166.6 |
| C | 14 | 238 | 132073 | 677.58 | 834 | 841 | 193.7 |
| C | 13 | 61 | 5813 | 25.67 | 834 | 841 | 193.7 |
| C | 3 | 233 | 2538 | 8.76 | 834 | 841 | 193.7 |
| D | 12 | 235 | 1595230 | 7813.42 | 830 | 806 | 204.1 |
| D | 7 | 38 | 581327 | 2844.82 | 830 | 806 | 204.1 |
| D | 1 | 20 | 573470 | 2806.32 | 830 | 806 | 204.1 |
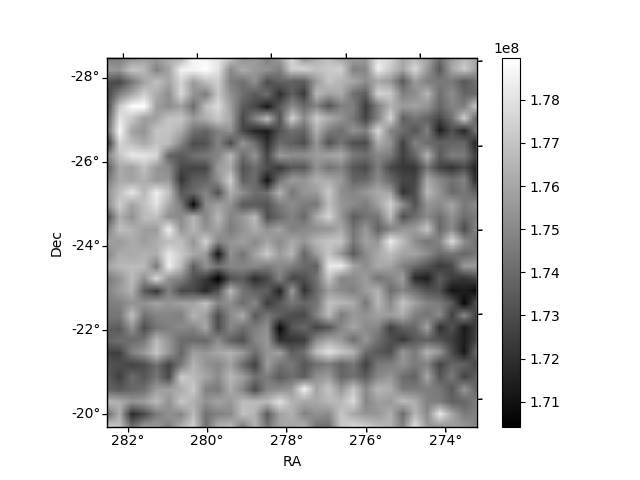
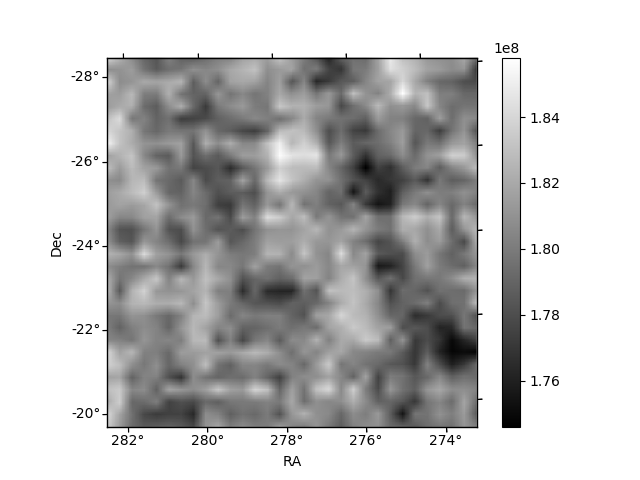
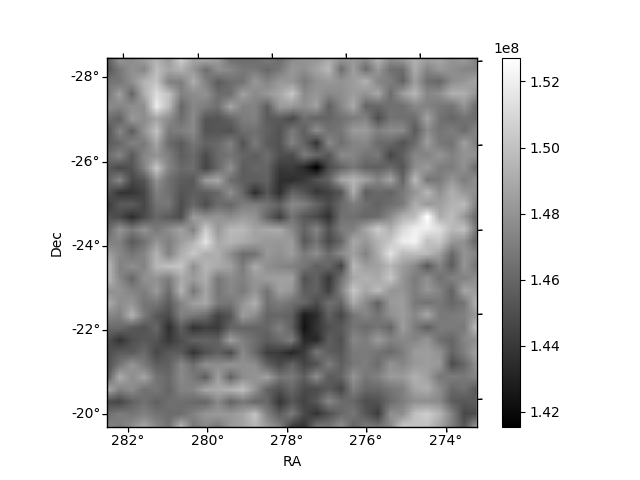
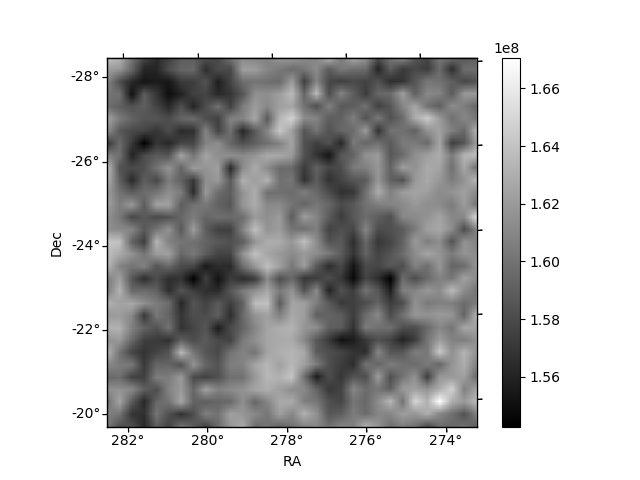
Histogram calculated using DETX and DETY for each event in the final _common_clean file
| Quadrant A |  |
 |
Quadrant B |
|---|---|---|---|
| Quadrant D |  |
 |
Quadrant C |
| Plot type | Count rate plots | Images |
|---|---|---|
| Comparison with Poisson distribution Blue bars denote a histogram of data divided into 1 sec bins. Red curve is a Poisson curve with rate = median count rate of data. |
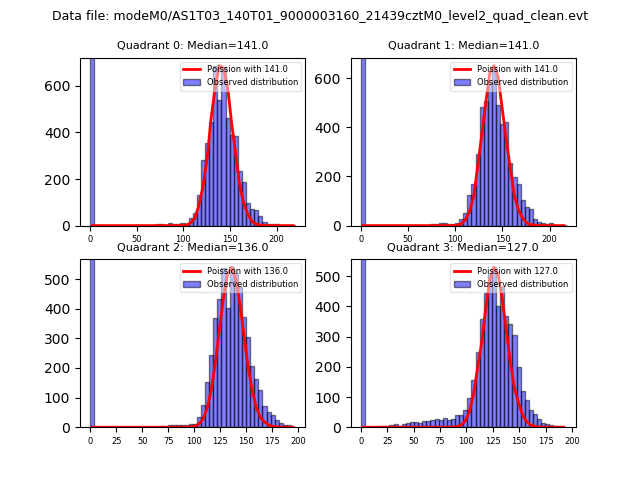 |
 |
| Quadrant-wise count rates Data is divided into 100 sec bins |
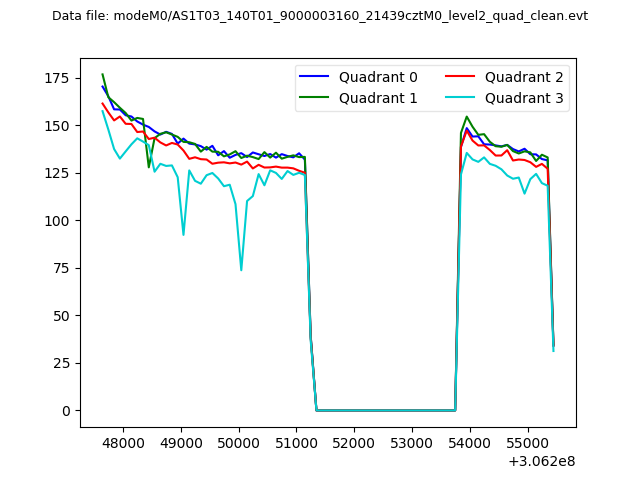 |
|
| Module-wise count rates for Quadrant A Data is divided into 100 sec bins |
 |
 |
| Module-wise count rates for Quadrant B Data is divided into 100 sec bins |
 |
 |
| Module-wise count rates for Quadrant C Data is divided into 100 sec bins |
 |
 |
| Module-wise count rates for Quadrant D Data is divided into 100 sec bins |
 |
 |
| Parameter | Plot |
|---|---|
| CZT HV Monitor |  |
| D_VDD |  |
| Temperature 1 |  |
| Veto HV Monitor |  |
| Veto LLD |  |
| Alpha Counter | 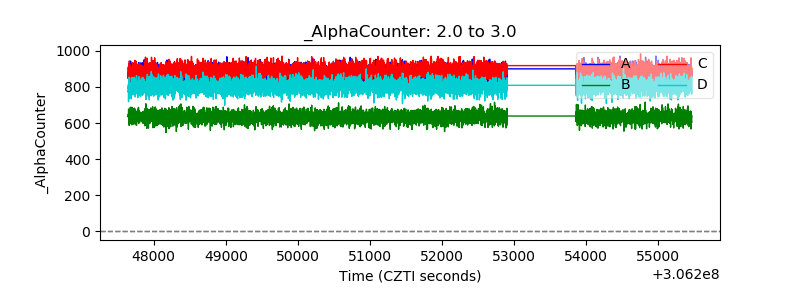 |
| _CPM_Rate | 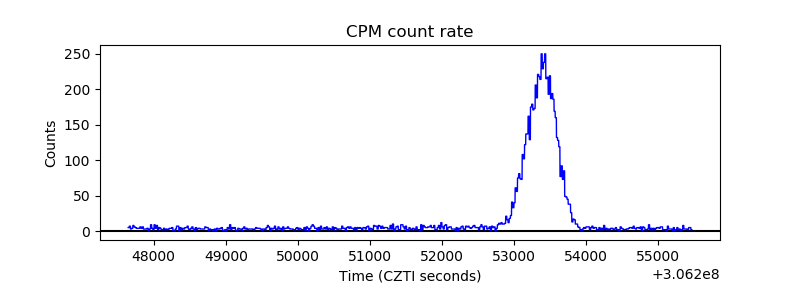 |
| CZT Counter |  |
| +2.5 Volts monitor |  |
| +5 Volts monitor |  |
| _ROLL_ROT |  |
| _Roll_DEC |  |
| _Roll_RA |  |
| Veto Counter |  |