| Param | Original file | Final file |
|---|---|---|
| Filename | modeM0/AS1T03_140T01_9000003160_21440cztM0_level2.evt | modeM0/AS1T03_140T01_9000003160_21440cztM0_level2_quad_clean.evt |
| Size (bytes) | 520,727,040 | 92,537,280 |
| Size | 496.6 MB | 88.3 MB |
| Events in quadrant A | 3,216,197 | 599,792 |
| Events in quadrant B | 3,345,829 | 600,771 |
| Events in quadrant C | 3,198,305 | 582,290 |
| Events in quadrant D | 5,555,474 | 552,341 |
| Mode SS | |||
|---|---|---|---|
| Quadrant | BADHDUFLAG | Total packets | Discarded packets |
| A | 0 | 136 | 0 |
| B | 0 | 136 | 0 |
| C | 0 | 136 | 0 |
| D | 0 | 136 | 0 |
| Mode M0 | |||
|---|---|---|---|
| Quadrant | BADHDUFLAG | Total packets | Discarded packets |
| A | 0 | 13878 | 1 |
| B | 0 | 14173 | 1 |
| C | 0 | 13877 | 1 |
| D | 0 | 21084 | 1 |
| Mode M9 | |||
|---|---|---|---|
| Quadrant | BADHDUFLAG | Total packets | Discarded packets |
| A | 0 | 5 | 0 |
| B | 0 | 5 | 0 |
| C | 0 | 5 | 0 |
| D | 0 | 5 | 0 |
| Quadrant | Total seconds | Saturated seconds | Saturation percentage |
|---|---|---|---|
| A | 6701 | 67 | 0.999851% |
| B | 6701 | 95 | 1.417699% |
| C | 6701 | 89 | 1.328160% |
| D | 6701 | 295 | 4.402328% |
Noise dominated data is calculated using 1-second bins in cleaned event files. If a bin has >2000 counts, and if more than 50% of those come from <1% of pixels, then it is considered to be noise-dominated and hence unusable.
| Quadrant | # 1 sec bins | Bins with >0 counts | Bins with >2000 counts | High rate bins dominated by noise | Noise dominated (total time) | Noise dominated (detector-on time) | Marked lightcurve |
|---|---|---|---|---|---|---|---|
| A | 7276 | 6701 | 0 | 0 | 0.00% | 0.00% | 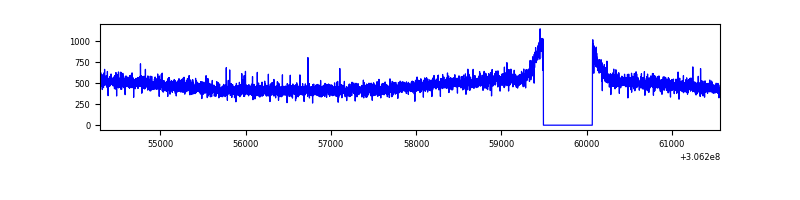 |
| B | 7276 | 6701 | 9 | 9 | 0.12% | 0.13% | 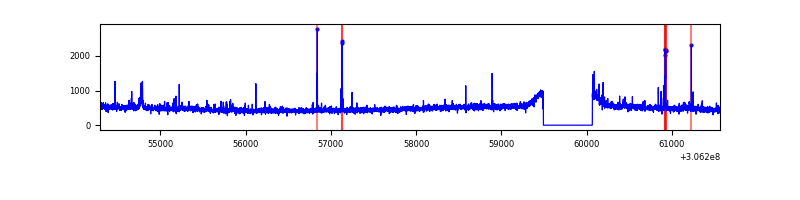 |
| C | 7276 | 6701 | 0 | 0 | 0.00% | 0.00% | 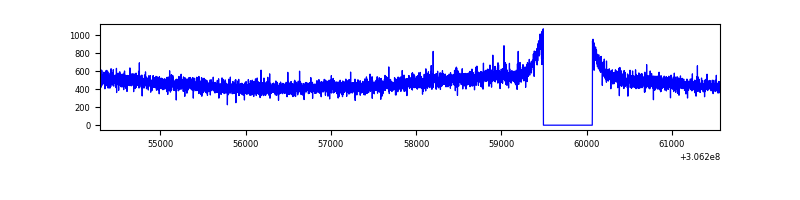 |
| D | 7276 | 6702 | 263 | 263 | 3.61% | 3.92% | 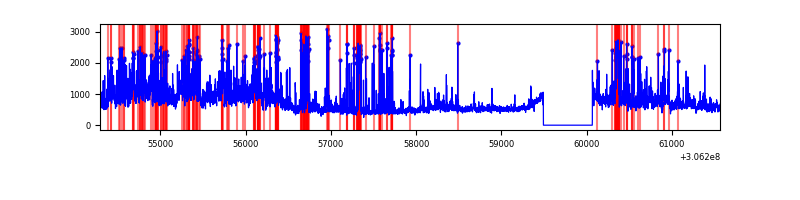 |
Top three noisy pixels from each quadrant. If the there are fewer than three noisy pixels in the level2.evt file, extra rows are filled as -1
| Pixel properties | Quadrant properties | ||||||
|---|---|---|---|---|---|---|---|
| Quadrant | DetID | PixID | Counts | Sigma | Mean | Median | Sigma |
| A | 13 | 254 | 10959 | 60.97 | 831 | 815 | 166.4 |
| A | 11 | 47 | 7620 | 40.9 | 831 | 815 | 166.4 |
| A | 0 | 226 | 7088 | 37.7 | 831 | 815 | 166.4 |
| B | 0 | 190 | 36568 | 227.0 | 822 | 803 | 157.6 |
| B | 0 | 230 | 29065 | 179.38 | 822 | 803 | 157.6 |
| B | 12 | 111 | 18813 | 114.31 | 822 | 803 | 157.6 |
| C | 14 | 238 | 125552 | 673.88 | 787 | 793 | 185.1 |
| C | 13 | 61 | 5443 | 25.12 | 787 | 793 | 185.1 |
| C | 3 | 233 | 4373 | 19.34 | 787 | 793 | 185.1 |
| D | 12 | 235 | 1024865 | 5336.07 | 791 | 768 | 191.9 |
| D | 1 | 52 | 558132 | 2904.15 | 791 | 768 | 191.9 |
| D | 1 | 20 | 414254 | 2154.47 | 791 | 768 | 191.9 |
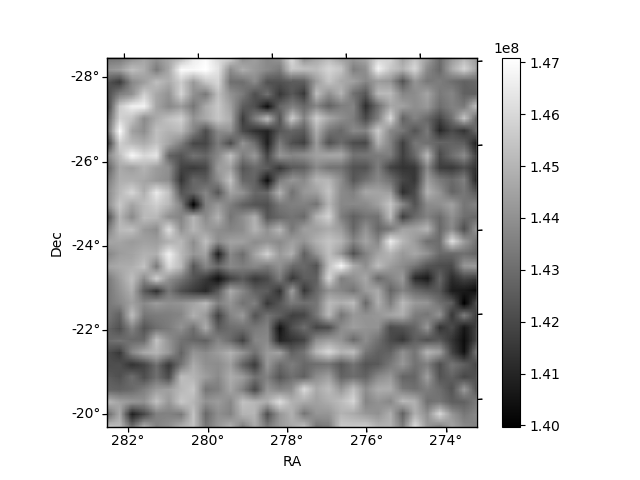
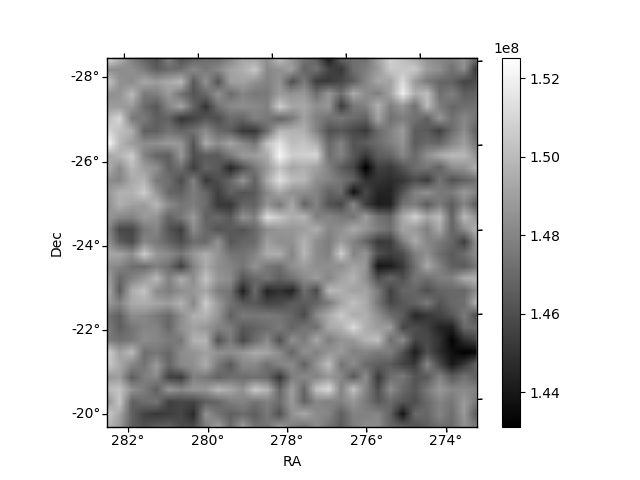
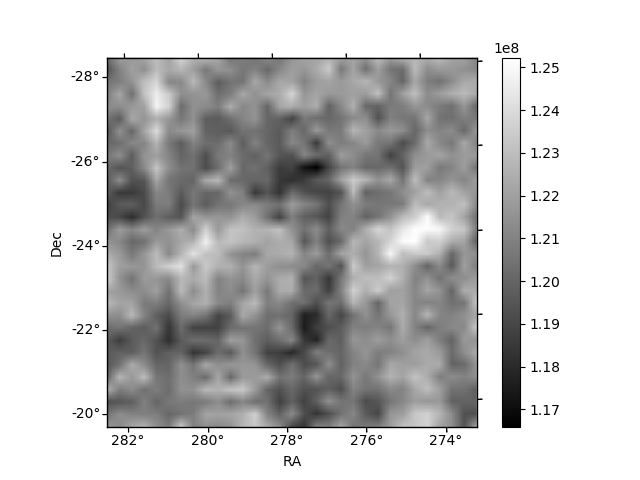
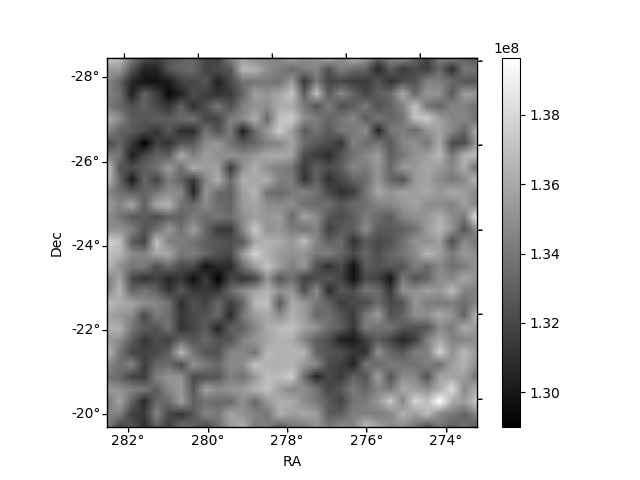
Histogram calculated using DETX and DETY for each event in the final _common_clean file
| Quadrant A | 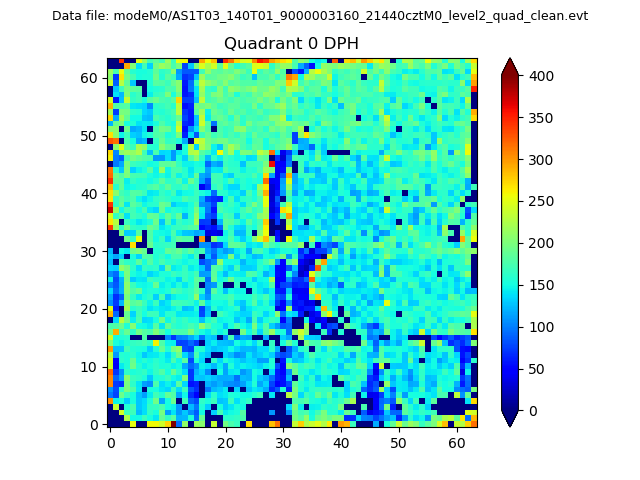 |
 |
Quadrant B |
|---|---|---|---|
| Quadrant D | 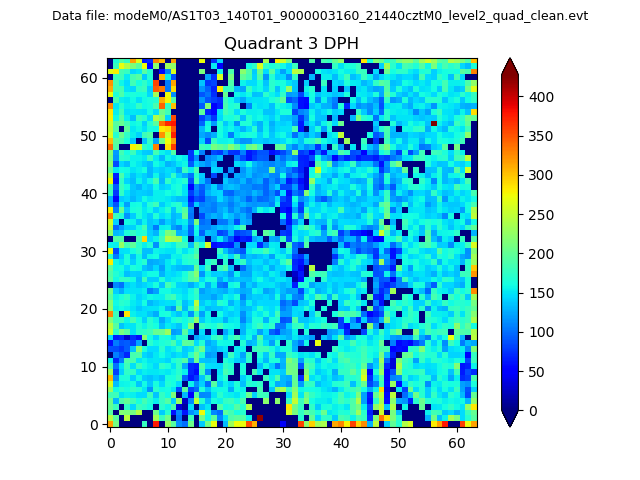 |
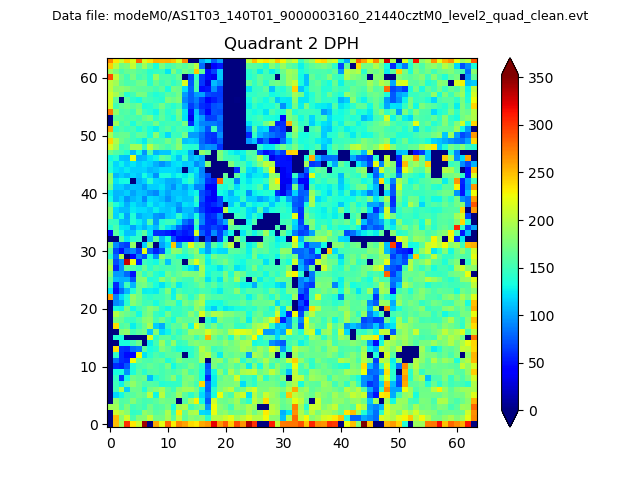 |
Quadrant C |
| Plot type | Count rate plots | Images |
|---|---|---|
| Comparison with Poisson distribution Blue bars denote a histogram of data divided into 1 sec bins. Red curve is a Poisson curve with rate = median count rate of data. |
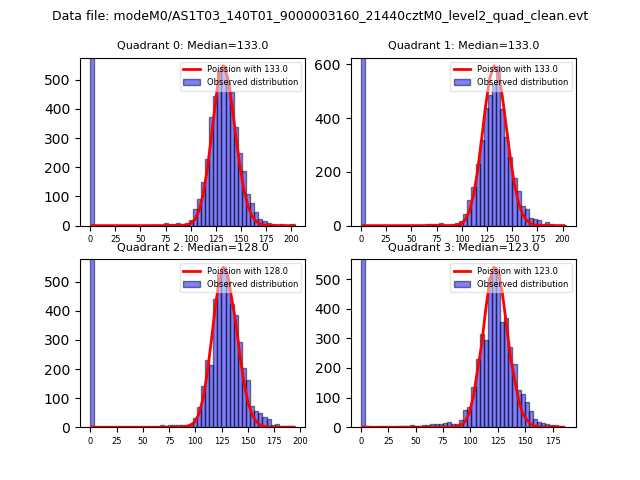 |
 |
| Quadrant-wise count rates Data is divided into 100 sec bins |
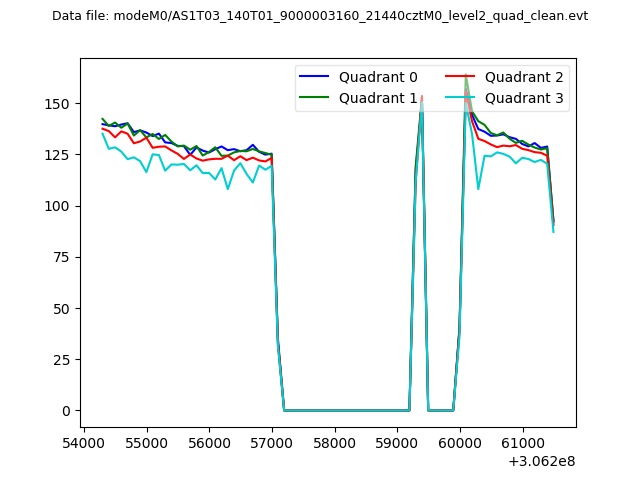 |
|
| Module-wise count rates for Quadrant A Data is divided into 100 sec bins |
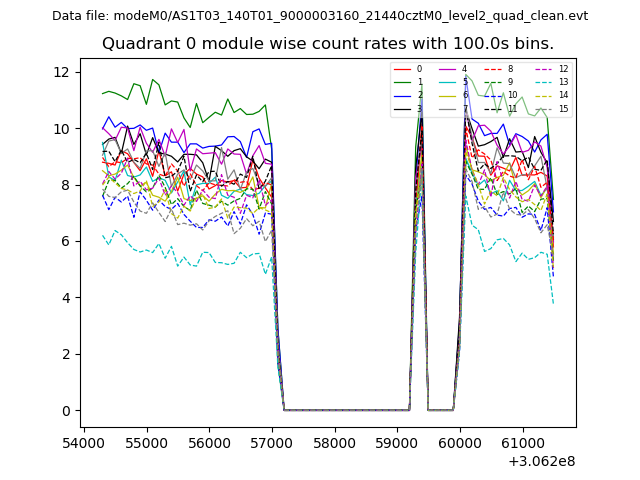 |
 |
| Module-wise count rates for Quadrant B Data is divided into 100 sec bins |
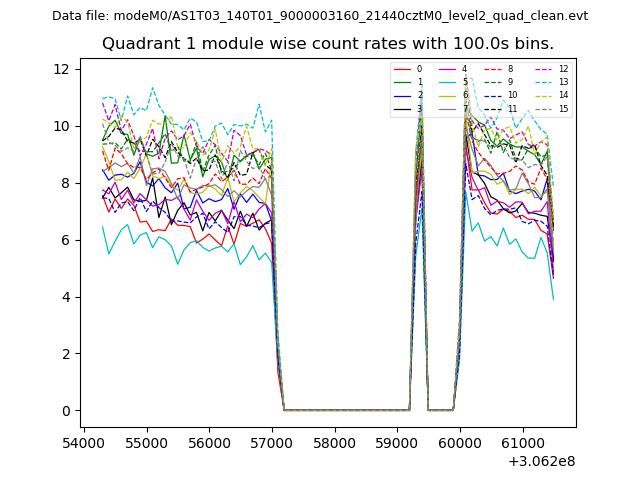 |
 |
| Module-wise count rates for Quadrant C Data is divided into 100 sec bins |
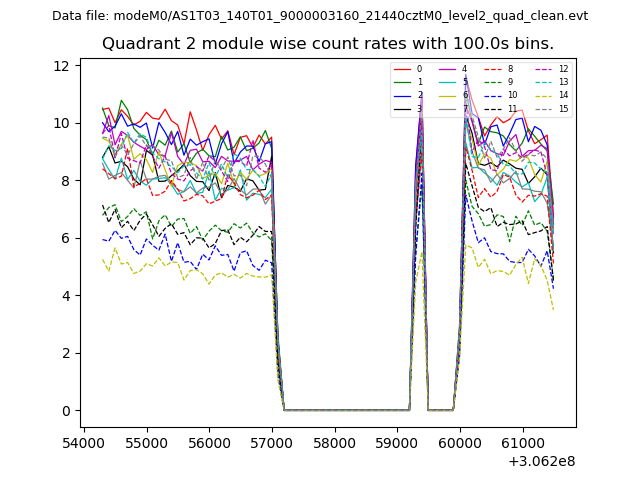 |
 |
| Module-wise count rates for Quadrant D Data is divided into 100 sec bins |
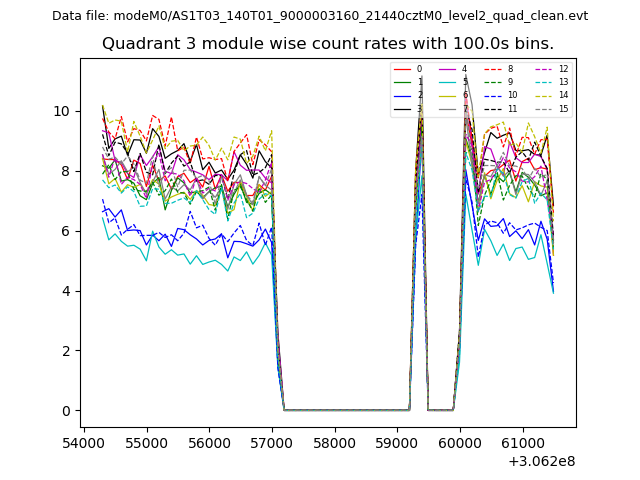 |
 |
| Parameter | Plot |
|---|---|
| CZT HV Monitor | 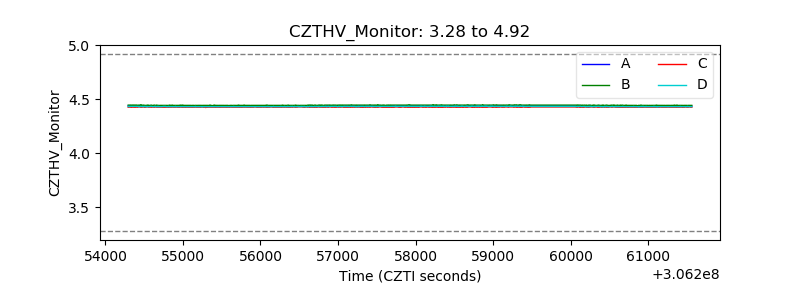 |
| D_VDD | 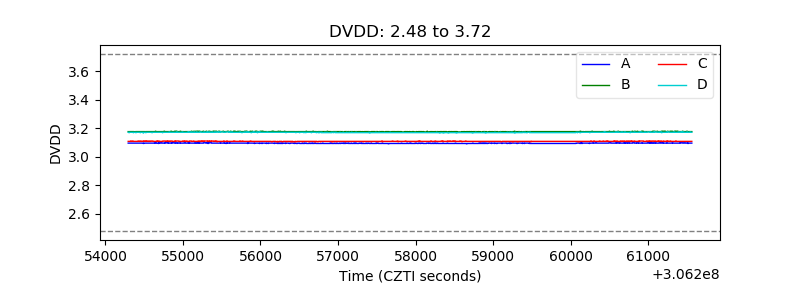 |
| Temperature 1 | 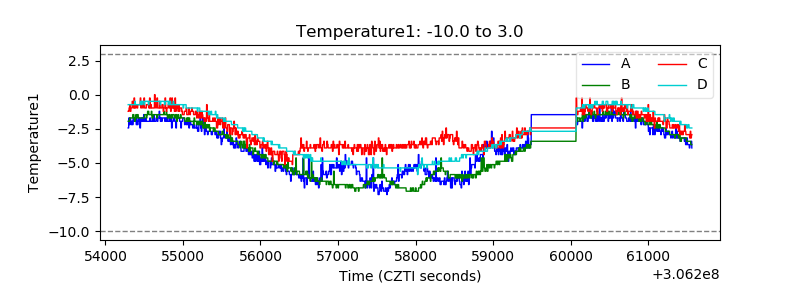 |
| Veto HV Monitor | 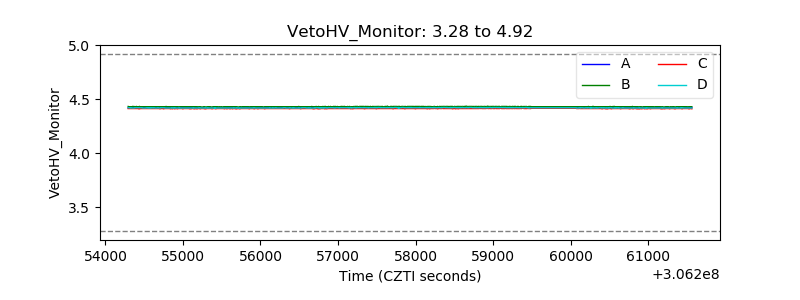 |
| Veto LLD | 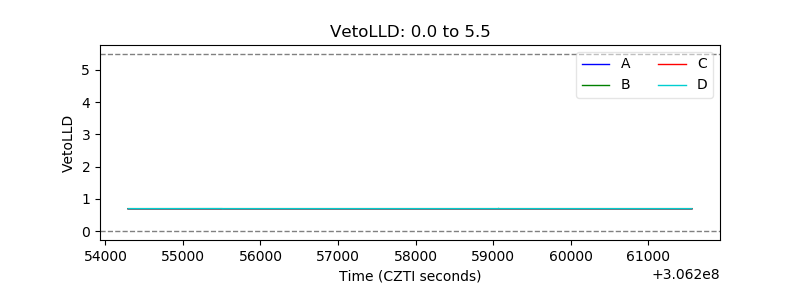 |
| Alpha Counter | 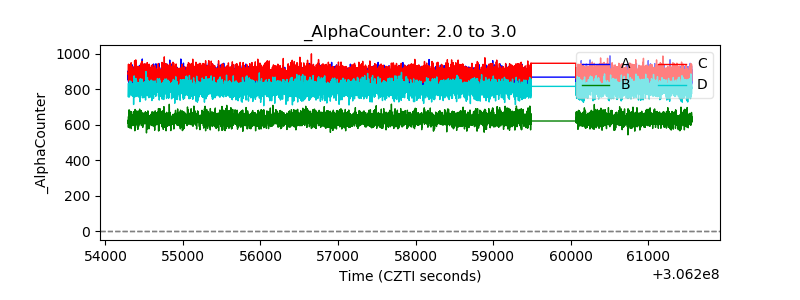 |
| _CPM_Rate | 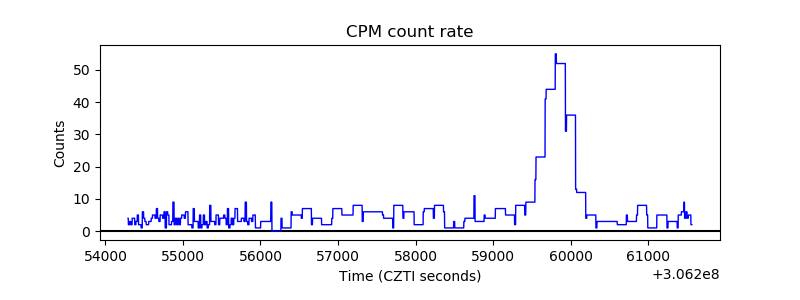 |
| CZT Counter | 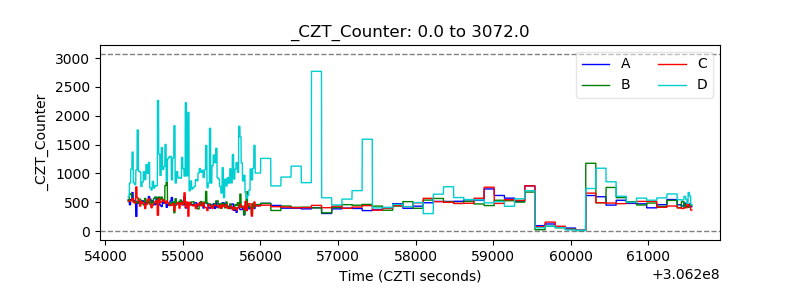 |
| +2.5 Volts monitor |  |
| +5 Volts monitor | 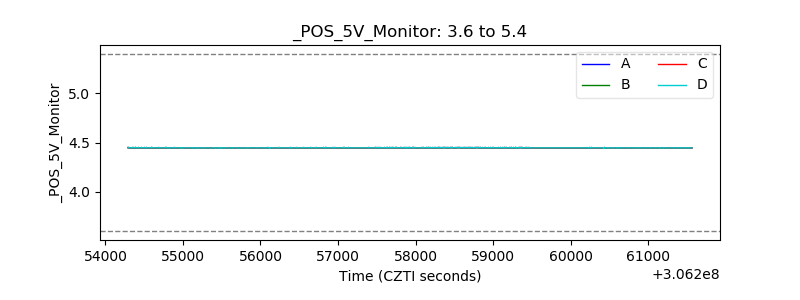 |
| _ROLL_ROT | 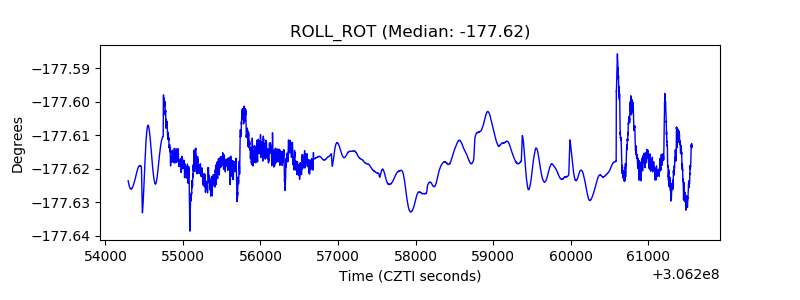 |
| _Roll_DEC | 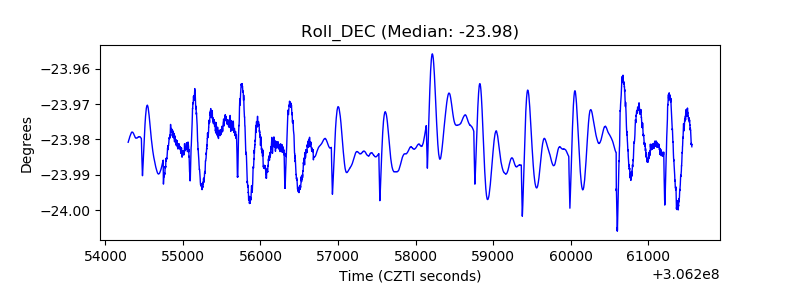 |
| _Roll_RA |  |
| Veto Counter | 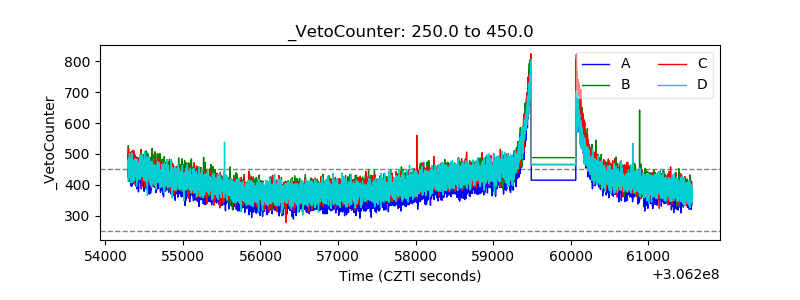 |