| Param | Original file | Final file |
|---|---|---|
| Filename | modeM0/AS1T03_140T01_9000003160_21441cztM0_level2.evt | modeM0/AS1T03_140T01_9000003160_21441cztM0_level2_quad_clean.evt |
| Size (bytes) | 584,225,280 | 106,122,240 |
| Size | 557.2 MB | 101.2 MB |
| Events in quadrant A | 3,590,336 | 690,993 |
| Events in quadrant B | 3,683,758 | 697,866 |
| Events in quadrant C | 3,635,412 | 674,974 |
| Events in quadrant D | 6,278,031 | 630,549 |
| Mode SS | |||
|---|---|---|---|
| Quadrant | BADHDUFLAG | Total packets | Discarded packets |
| A | 0 | 150 | 0 |
| B | 0 | 150 | 0 |
| C | 0 | 150 | 0 |
| D | 0 | 150 | 0 |
| Mode M0 | |||
|---|---|---|---|
| Quadrant | BADHDUFLAG | Total packets | Discarded packets |
| A | 0 | 15535 | 1 |
| B | 0 | 15724 | 2 |
| C | 0 | 15696 | 1 |
| D | 0 | 23858 | 1 |
| Mode M9 | |||
|---|---|---|---|
| Quadrant | BADHDUFLAG | Total packets | Discarded packets |
| A | 0 | 3 | 0 |
| B | 0 | 3 | 0 |
| C | 0 | 3 | 0 |
| D | 0 | 3 | 0 |
| Quadrant | Total seconds | Saturated seconds | Saturation percentage |
|---|---|---|---|
| A | 7466 | 58 | 0.776855% |
| B | 7465 | 84 | 1.125251% |
| C | 7465 | 107 | 1.433356% |
| D | 7466 | 565 | 7.567640% |
Noise dominated data is calculated using 1-second bins in cleaned event files. If a bin has >2000 counts, and if more than 50% of those come from <1% of pixels, then it is considered to be noise-dominated and hence unusable.
| Quadrant | # 1 sec bins | Bins with >0 counts | Bins with >2000 counts | High rate bins dominated by noise | Noise dominated (total time) | Noise dominated (detector-on time) | Marked lightcurve |
|---|---|---|---|---|---|---|---|
| A | 7736 | 7466 | 0 | 0 | 0.00% | 0.00% | 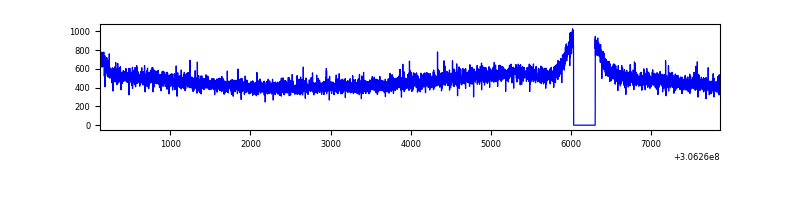 |
| B | 7735 | 7465 | 8 | 8 | 0.10% | 0.11% | 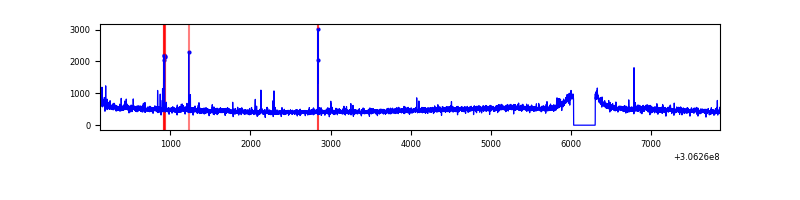 |
| C | 7735 | 7465 | 0 | 0 | 0.00% | 0.00% | 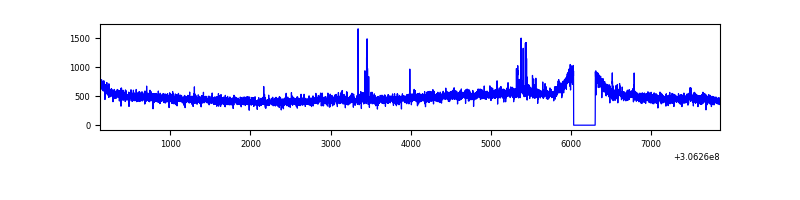 |
| D | 7736 | 7466 | 500 | 500 | 6.46% | 6.70% | 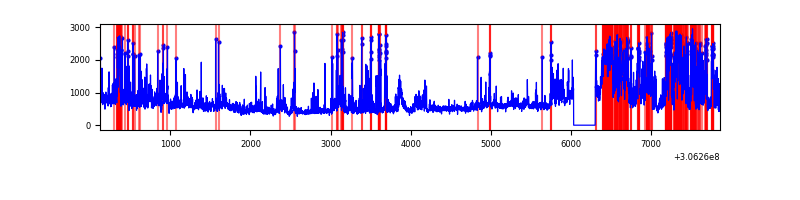 |
Top three noisy pixels from each quadrant. If the there are fewer than three noisy pixels in the level2.evt file, extra rows are filled as -1
| Pixel properties | Quadrant properties | ||||||
|---|---|---|---|---|---|---|---|
| Quadrant | DetID | PixID | Counts | Sigma | Mean | Median | Sigma |
| A | 11 | 47 | 22070 | 113.5 | 923 | 904 | 186.5 |
| A | 13 | 254 | 12808 | 63.84 | 923 | 904 | 186.5 |
| A | 0 | 226 | 8009 | 38.1 | 923 | 904 | 186.5 |
| B | 0 | 230 | 35152 | 194.52 | 913 | 889 | 176.1 |
| B | 0 | 190 | 22685 | 123.74 | 913 | 889 | 176.1 |
| B | 12 | 111 | 21068 | 114.56 | 913 | 889 | 176.1 |
| C | 14 | 238 | 137857 | 662.13 | 875 | 879 | 206.9 |
| C | 3 | 233 | 89163 | 426.75 | 875 | 879 | 206.9 |
| C | 13 | 61 | 6194 | 25.69 | 875 | 879 | 206.9 |
| D | 12 | 235 | 975300 | 4608.53 | 871 | 846 | 211.4 |
| D | 1 | 20 | 959293 | 4532.83 | 871 | 846 | 211.4 |
| D | 1 | 52 | 366593 | 1729.74 | 871 | 846 | 211.4 |
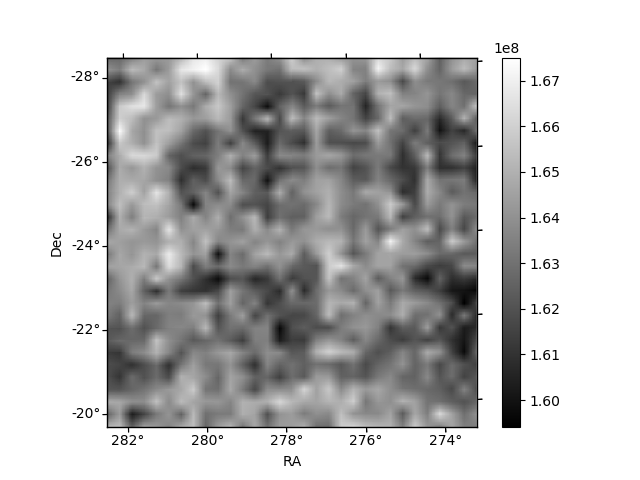
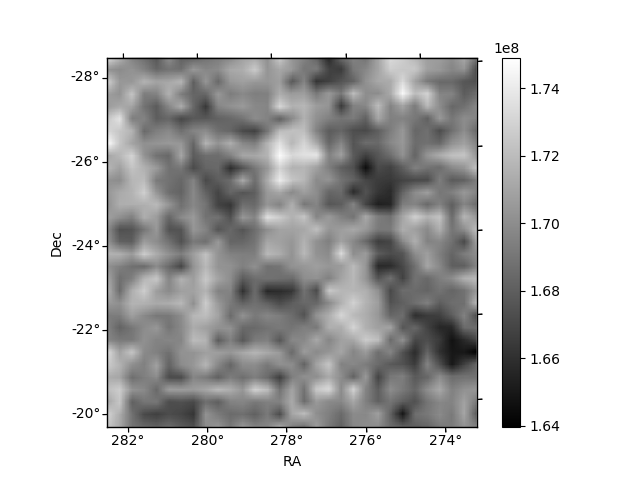
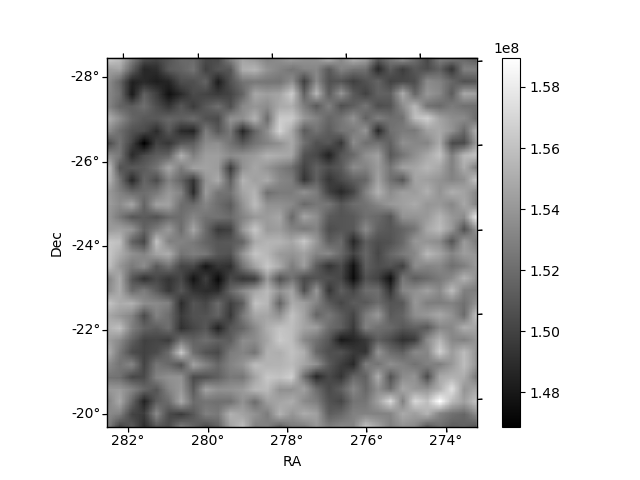
Histogram calculated using DETX and DETY for each event in the final _common_clean file
| Quadrant A | 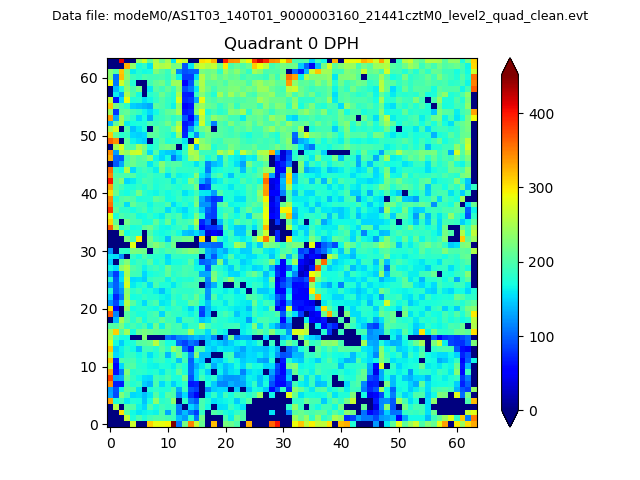 |
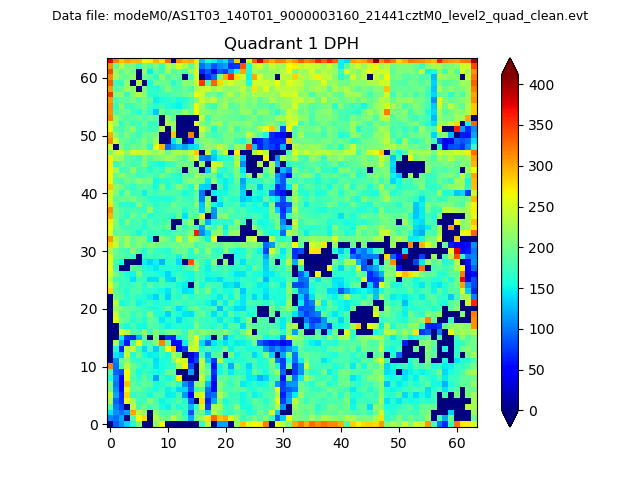 |
Quadrant B |
|---|---|---|---|
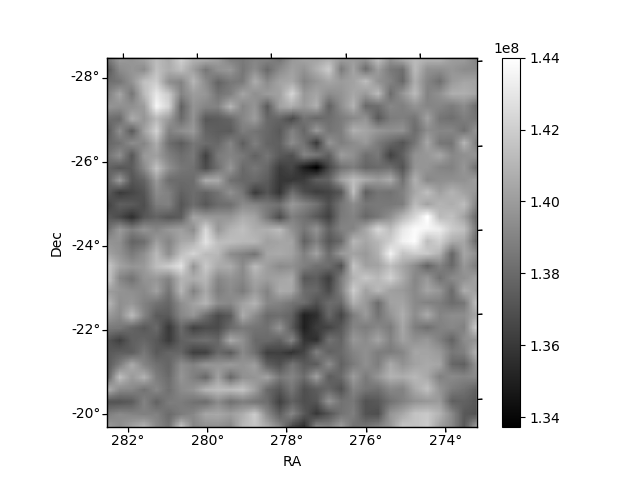
| Quadrant D |  |
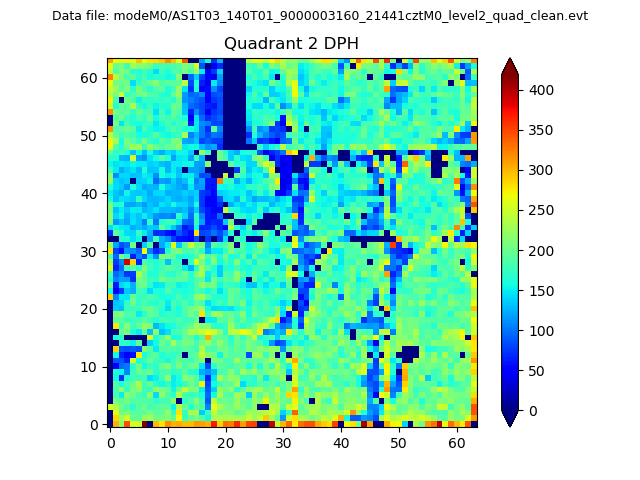 |
Quadrant C |
| Plot type | Count rate plots | Images |
|---|---|---|
| Comparison with Poisson distribution Blue bars denote a histogram of data divided into 1 sec bins. Red curve is a Poisson curve with rate = median count rate of data. |
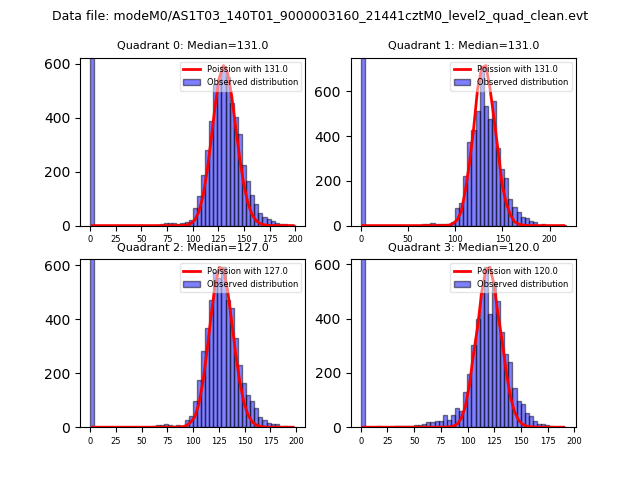 |
 |
| Quadrant-wise count rates Data is divided into 100 sec bins |
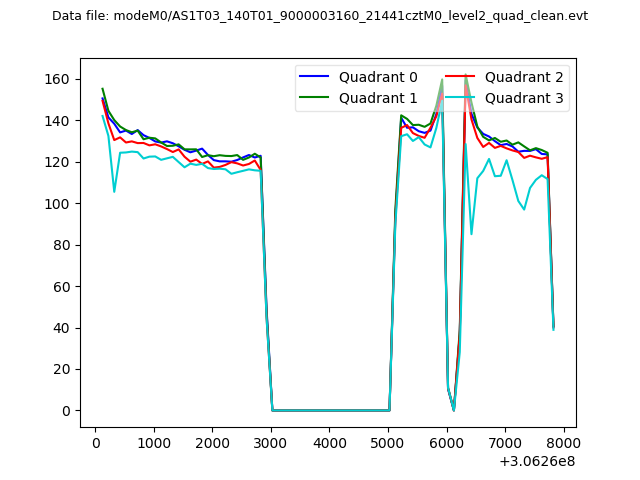 |
|
| Module-wise count rates for Quadrant A Data is divided into 100 sec bins |
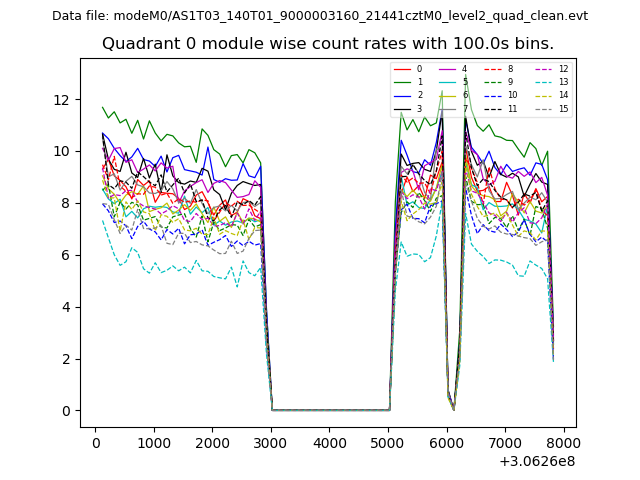 |
 |
| Module-wise count rates for Quadrant B Data is divided into 100 sec bins |
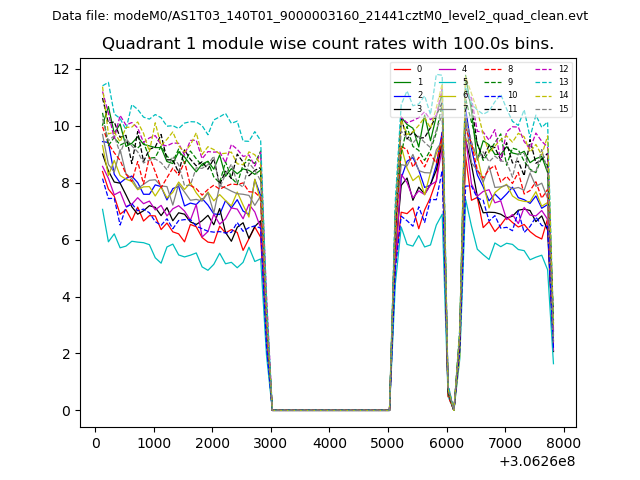 |
 |
| Module-wise count rates for Quadrant C Data is divided into 100 sec bins |
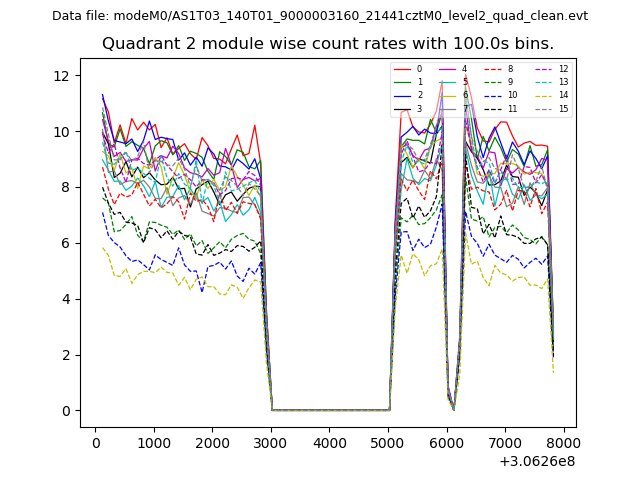 |
 |
| Module-wise count rates for Quadrant D Data is divided into 100 sec bins |
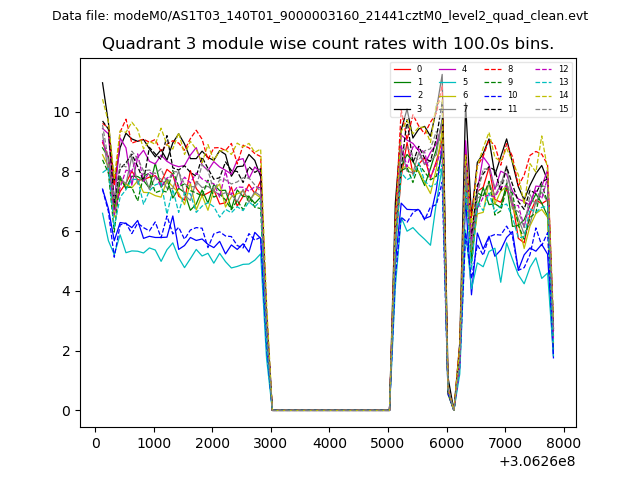 |
 |
| Parameter | Plot |
|---|---|
| CZT HV Monitor | 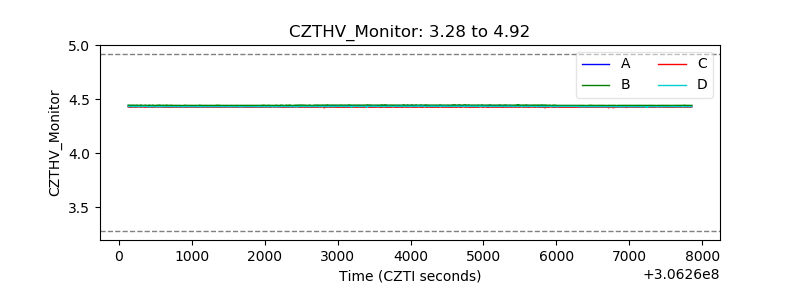 |
| D_VDD | 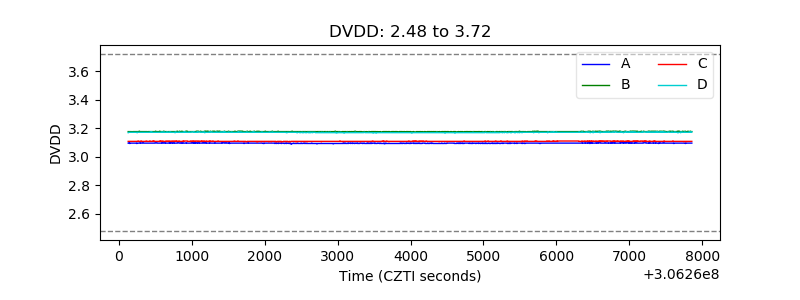 |
| Temperature 1 | 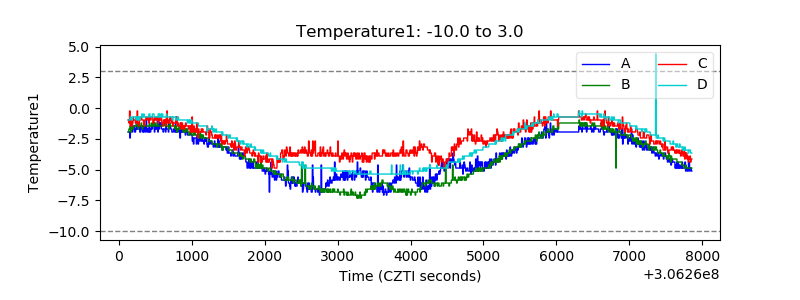 |
| Veto HV Monitor | 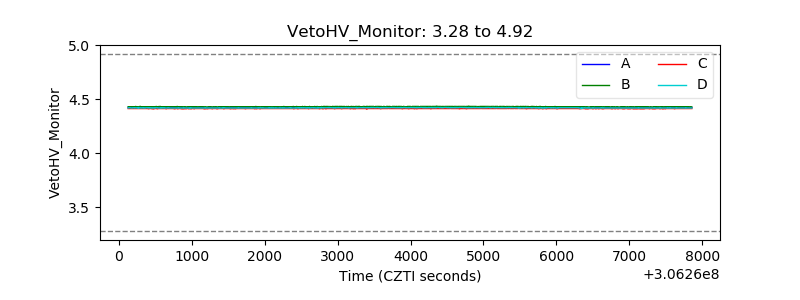 |
| Veto LLD | 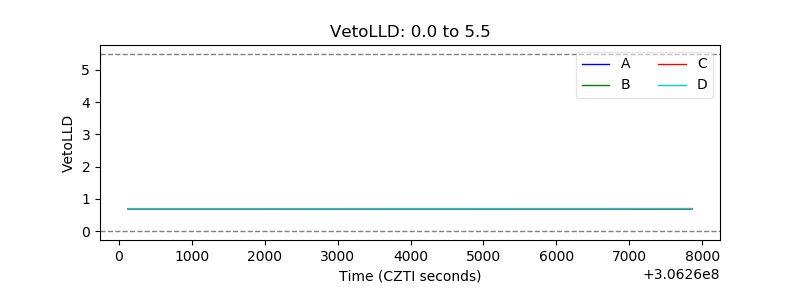 |
| Alpha Counter |  |
| _CPM_Rate | 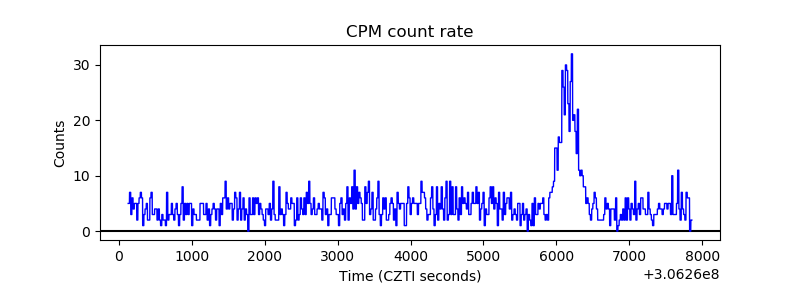 |
| CZT Counter |  |
| +2.5 Volts monitor |  |
| +5 Volts monitor |  |
| _ROLL_ROT | 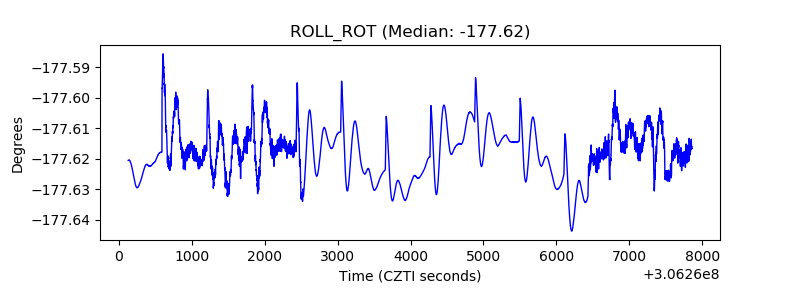 |
| _Roll_DEC | 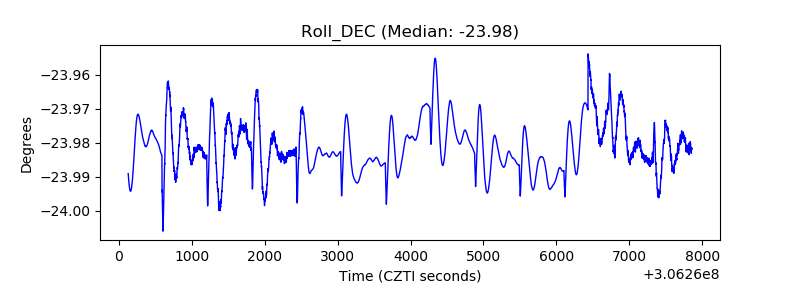 |
| _Roll_RA | 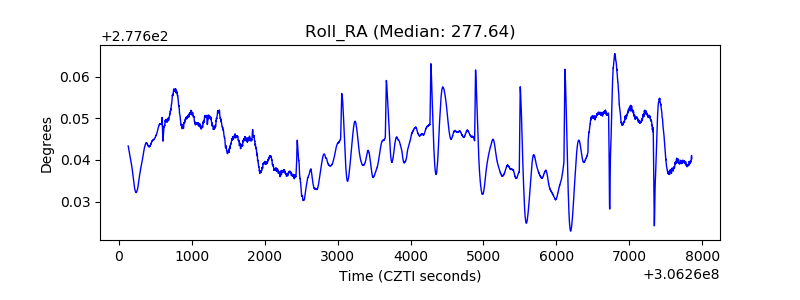 |
| Veto Counter | 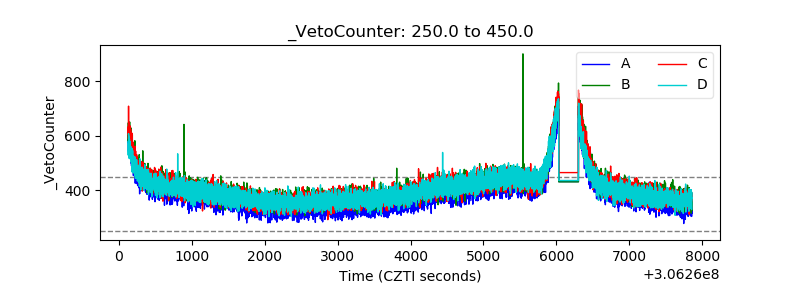 |