| Param | Original file | Final file |
|---|---|---|
| Filename | modeM0/AS1T03_140T01_9000003160_21445cztM0_level2.evt | modeM0/AS1T03_140T01_9000003160_21445cztM0_level2_quad_clean.evt |
| Size (bytes) | 1,393,701,120 | 224,591,040 |
| Size | 1.3 GB | 214.2 MB |
| Events in quadrant A | 8,558,319 | 1,419,851 |
| Events in quadrant B | 8,853,569 | 1,438,202 |
| Events in quadrant C | 9,058,362 | 1,382,027 |
| Events in quadrant D | 14,491,916 | 1,290,012 |
| Mode SS | |||
|---|---|---|---|
| Quadrant | BADHDUFLAG | Total packets | Discarded packets |
| A | 0 | 378 | 2 |
| B | 0 | 378 | 2 |
| C | 0 | 378 | 2 |
| D | 0 | 378 | 2 |
| Mode M0 | |||
|---|---|---|---|
| Quadrant | BADHDUFLAG | Total packets | Discarded packets |
| A | 0 | 37728 | 91 |
| B | 0 | 38342 | 93 |
| C | 0 | 38847 | 84 |
| D | 0 | 55722 | 108 |
| Mode M9 | |||
|---|---|---|---|
| Quadrant | BADHDUFLAG | Total packets | Discarded packets |
| A | 0 | 24 | 0 |
| B | 0 | 24 | 0 |
| C | 0 | 24 | 0 |
| D | 0 | 24 | 0 |
| Quadrant | Total seconds | Saturated seconds | Saturation percentage |
|---|---|---|---|
| A | 18461 | 52 | 0.281675% |
| B | 18459 | 114 | 0.617585% |
| C | 18461 | 180 | 0.975028% |
| D | 18459 | 969 | 5.249472% |
Noise dominated data is calculated using 1-second bins in cleaned event files. If a bin has >2000 counts, and if more than 50% of those come from <1% of pixels, then it is considered to be noise-dominated and hence unusable.
| Quadrant | # 1 sec bins | Bins with >0 counts | Bins with >2000 counts | High rate bins dominated by noise | Noise dominated (total time) | Noise dominated (detector-on time) | Marked lightcurve |
|---|---|---|---|---|---|---|---|
| A | 20932 | 18467 | 0 | 0 | 0.00% | 0.00% | 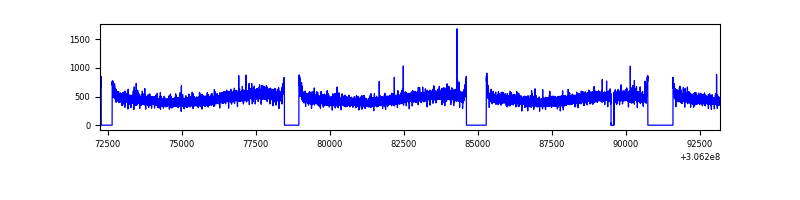 |
| B | 20932 | 18463 | 9 | 9 | 0.04% | 0.05% | 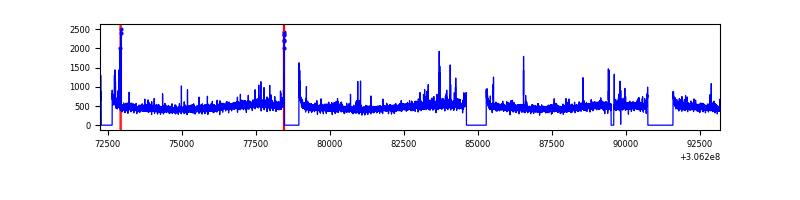 |
| C | 20933 | 18464 | 5 | 5 | 0.02% | 0.03% |  |
| D | 20932 | 18461 | 831 | 831 | 3.97% | 4.50% | 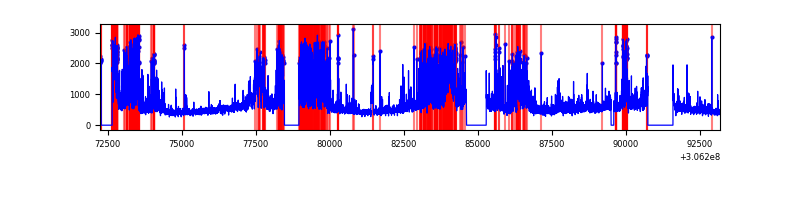 |
Top three noisy pixels from each quadrant. If the there are fewer than three noisy pixels in the level2.evt file, extra rows are filled as -1
| Pixel properties | Quadrant properties | ||||||
|---|---|---|---|---|---|---|---|
| Quadrant | DetID | PixID | Counts | Sigma | Mean | Median | Sigma |
| A | 11 | 47 | 45750 | 98.88 | 2202 | 2155 | 440.9 |
| A | 13 | 254 | 30602 | 64.52 | 2202 | 2155 | 440.9 |
| A | 0 | 226 | 19138 | 38.52 | 2202 | 2155 | 440.9 |
| B | 0 | 230 | 56197 | 129.4 | 2199 | 2142 | 417.7 |
| B | 0 | 189 | 51293 | 117.66 | 2199 | 2142 | 417.7 |
| B | 12 | 111 | 51246 | 117.55 | 2199 | 2142 | 417.7 |
| C | 3 | 233 | 481866 | 974.98 | 2105 | 2122 | 492.1 |
| C | 14 | 238 | 331836 | 670.08 | 2105 | 2122 | 492.1 |
| C | 7 | 239 | 26025 | 48.58 | 2105 | 2122 | 492.1 |
| D | 12 | 235 | 3285019 | 6451.01 | 2093 | 2032 | 508.9 |
| D | 1 | 20 | 1323654 | 2596.96 | 2093 | 2032 | 508.9 |
| D | 1 | 52 | 680106 | 1332.4 | 2093 | 2032 | 508.9 |
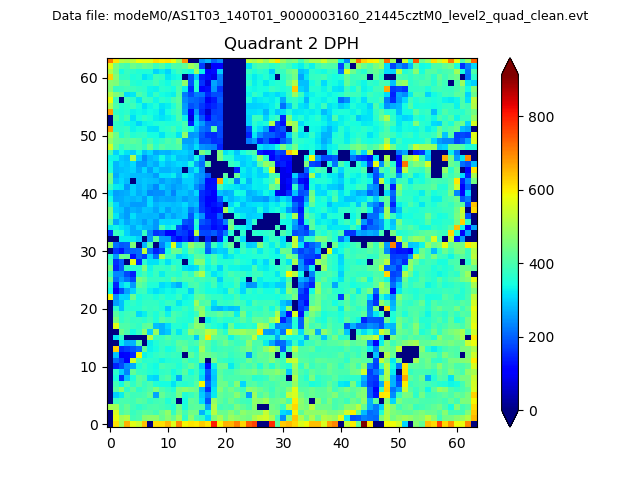
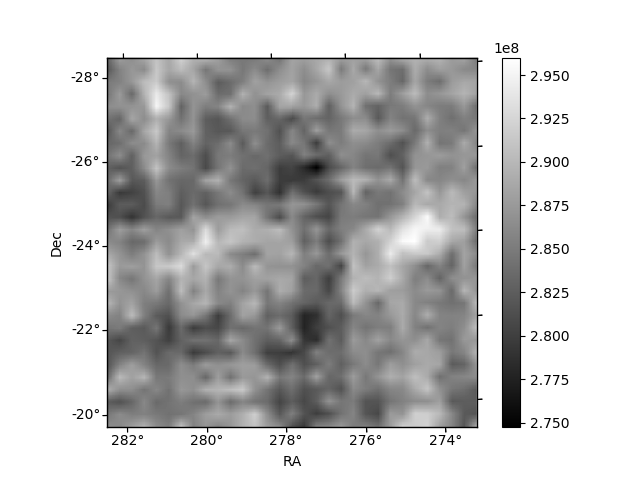
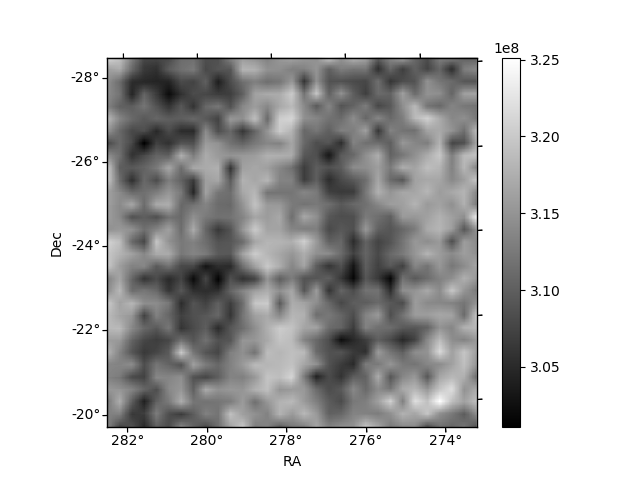
Histogram calculated using DETX and DETY for each event in the final _common_clean file
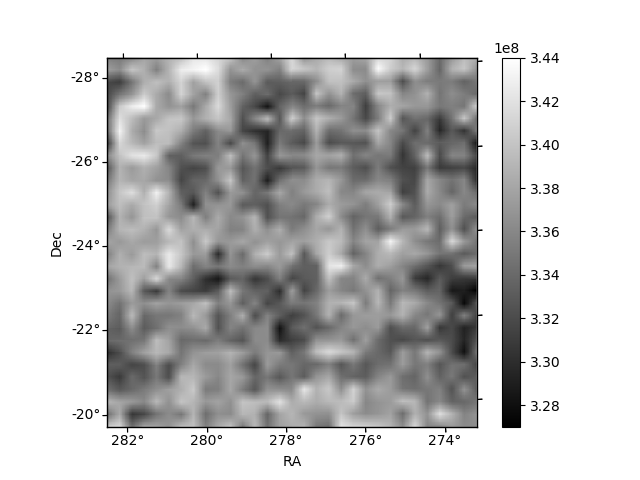
| Quadrant A | 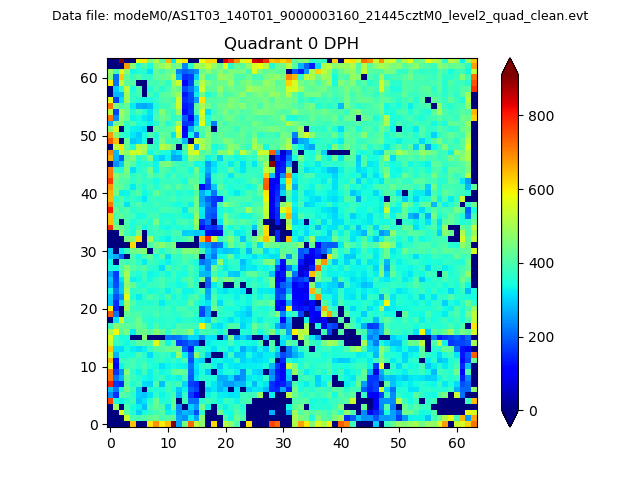 |
 |
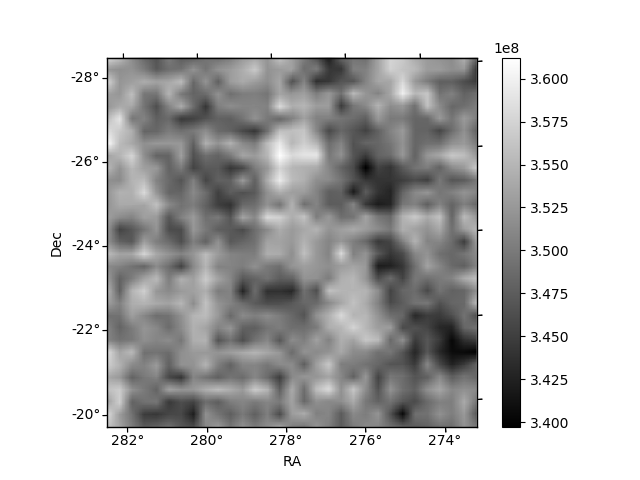
Quadrant B |
|---|---|---|---|
| Quadrant D |  |
 |
Quadrant C |
| Plot type | Count rate plots | Images |
|---|---|---|
| Comparison with Poisson distribution Blue bars denote a histogram of data divided into 1 sec bins. Red curve is a Poisson curve with rate = median count rate of data. |
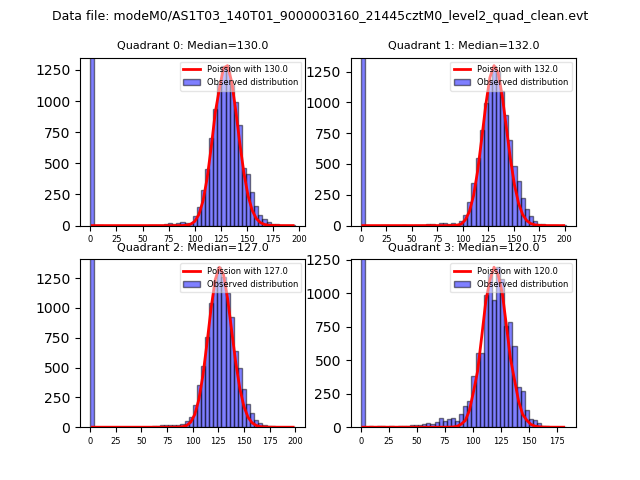 |
 |
| Quadrant-wise count rates Data is divided into 100 sec bins |
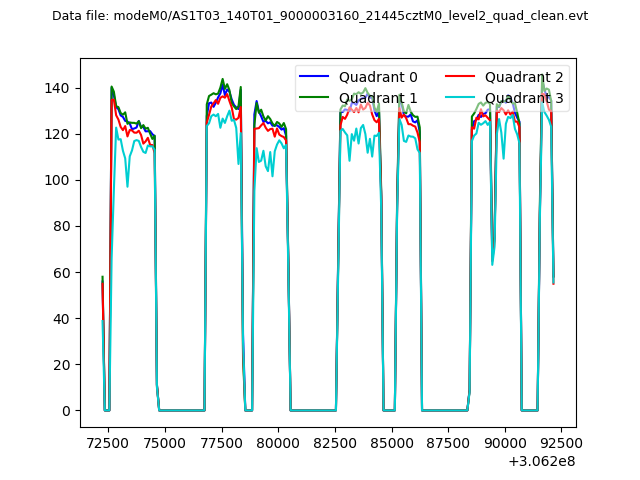 |
|
| Module-wise count rates for Quadrant A Data is divided into 100 sec bins |
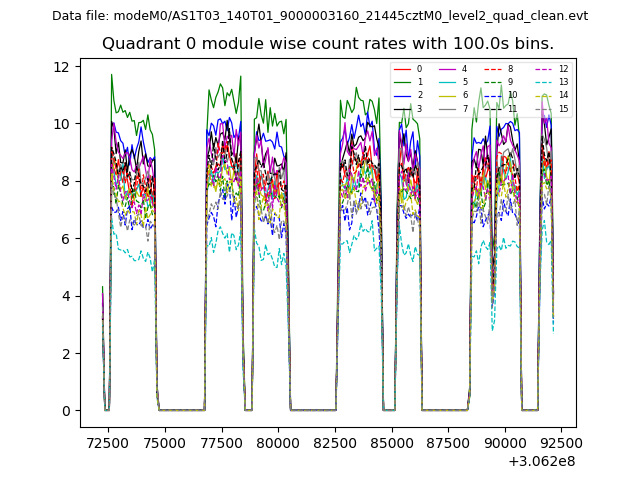 |
 |
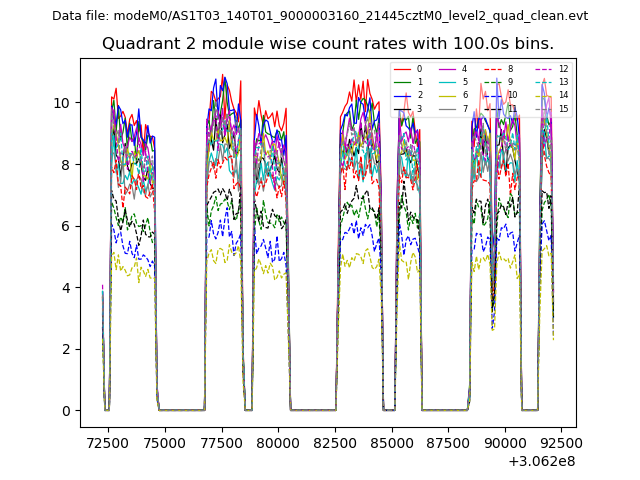
| Module-wise count rates for Quadrant B Data is divided into 100 sec bins |
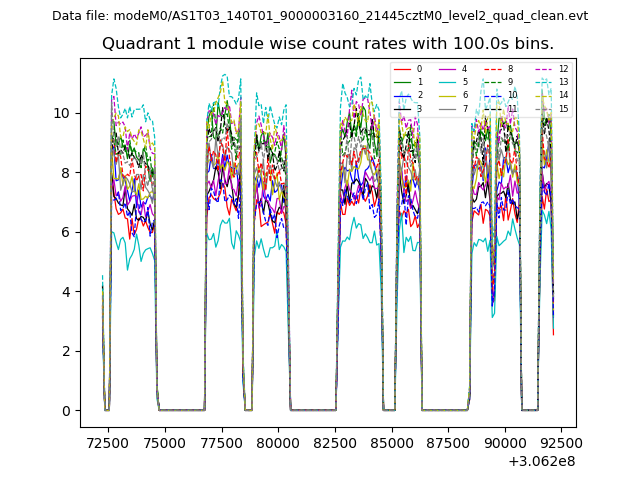 |
 |
| Module-wise count rates for Quadrant C Data is divided into 100 sec bins |
 |
 |
| Module-wise count rates for Quadrant D Data is divided into 100 sec bins |
 |
 |
| Parameter | Plot |
|---|---|
| CZT HV Monitor | 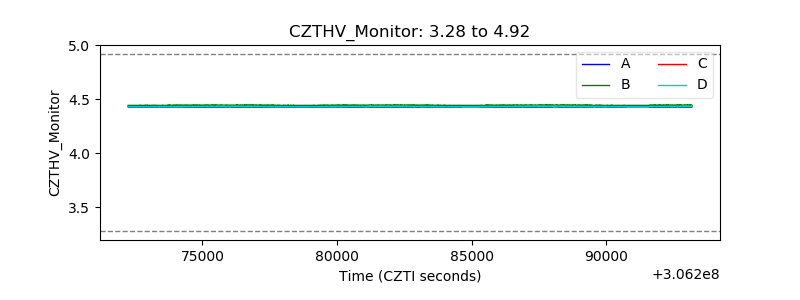 |
| D_VDD | 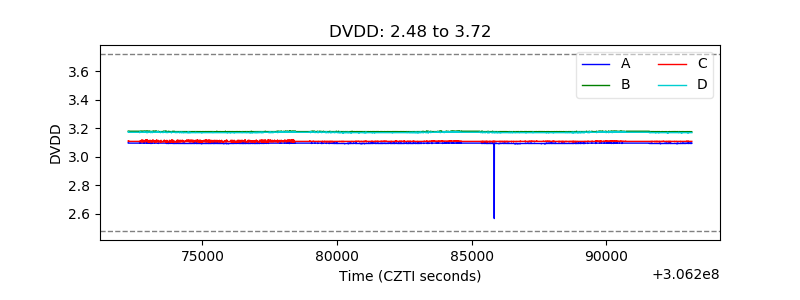 |
| Temperature 1 | 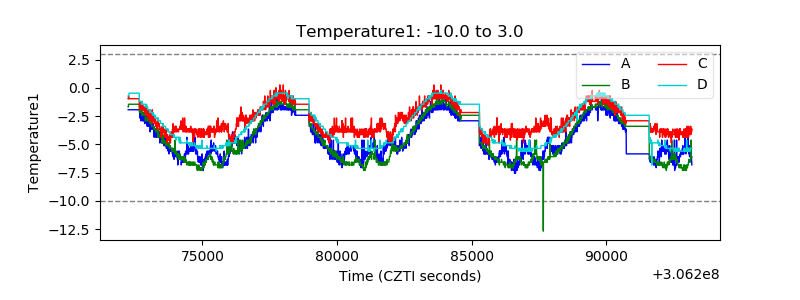 |
| Veto HV Monitor | 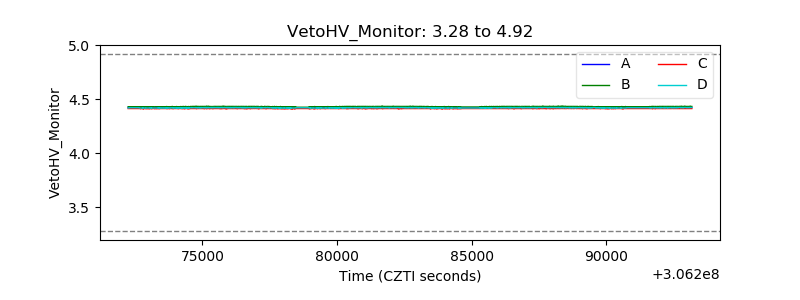 |
| Veto LLD | 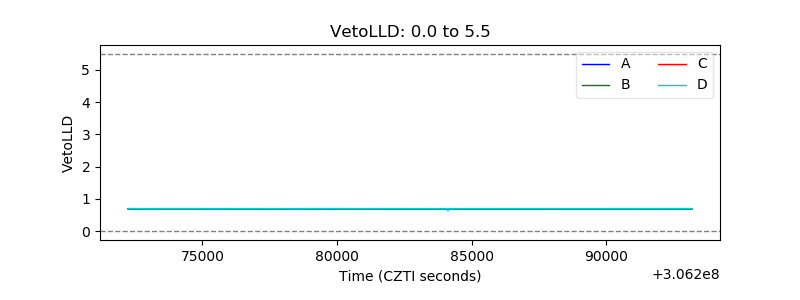 |
| Alpha Counter | 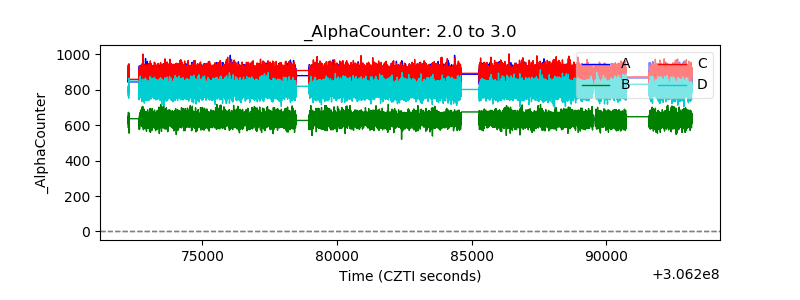 |
| _CPM_Rate | 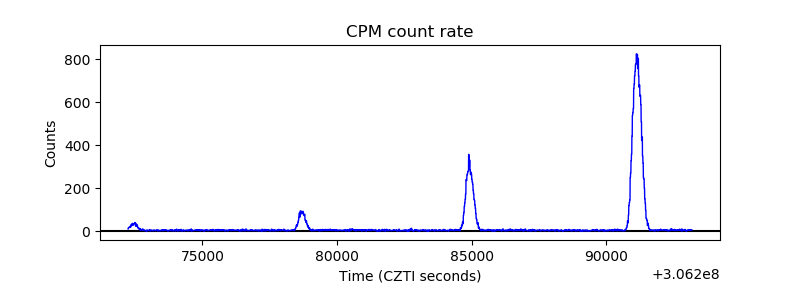 |
| CZT Counter | 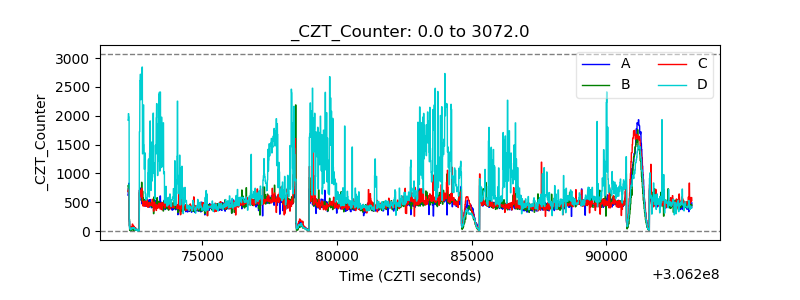 |
| +2.5 Volts monitor |  |
| +5 Volts monitor |  |
| _ROLL_ROT |  |
| _Roll_DEC | 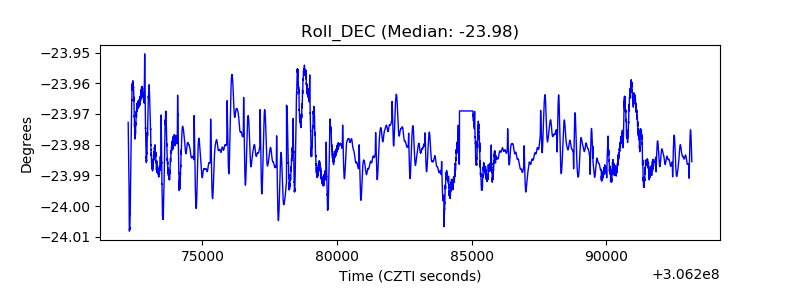 |
| _Roll_RA | 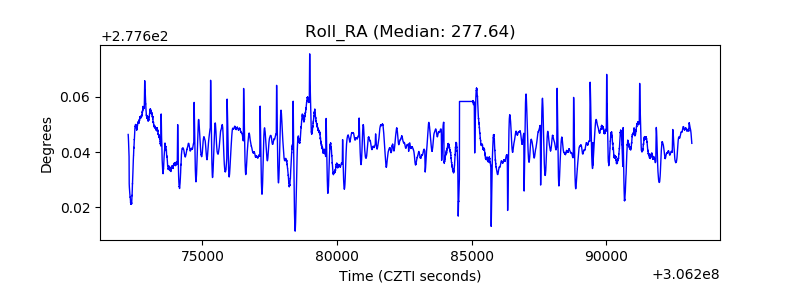 |
| Veto Counter | 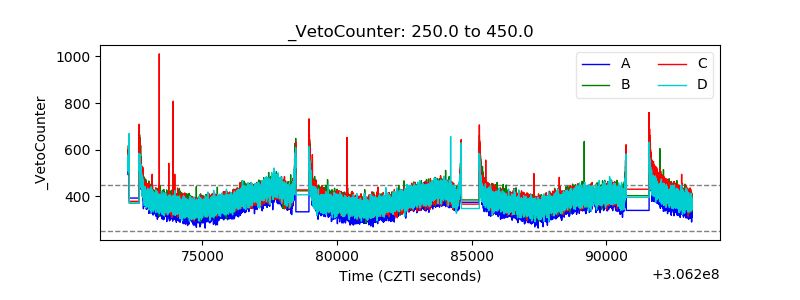 |