| Param | Original file | Final file |
|---|---|---|
| Filename | modeM0/AS1T03_140T01_9000003160_21446cztM0_level2.evt | modeM0/AS1T03_140T01_9000003160_21446cztM0_level2_quad_clean.evt |
| Size (bytes) | 468,918,720 | 72,167,040 |
| Size | 447.2 MB | 68.8 MB |
| Events in quadrant A | 3,135,499 | 438,658 |
| Events in quadrant B | 3,260,004 | 443,937 |
| Events in quadrant C | 3,488,669 | 427,940 |
| Events in quadrant D | 3,867,218 | 412,785 |
| Mode SS | |||
|---|---|---|---|
| Quadrant | BADHDUFLAG | Total packets | Discarded packets |
| A | 0 | 134 | 0 |
| B | 0 | 134 | 0 |
| C | 0 | 134 | 0 |
| D | 0 | 134 | 0 |
| Mode M0 | |||
|---|---|---|---|
| Quadrant | BADHDUFLAG | Total packets | Discarded packets |
| A | 0 | 13519 | 2 |
| B | 0 | 13788 | 2 |
| C | 0 | 14380 | 2 |
| D | 0 | 15933 | 3 |
| Mode M9 | |||
|---|---|---|---|
| Quadrant | BADHDUFLAG | Total packets | Discarded packets |
| A | 0 | 15 | 0 |
| B | 0 | 16 | 0 |
| C | 0 | 16 | 0 |
| D | 0 | 16 | 0 |
| Quadrant | Total seconds | Saturated seconds | Saturation percentage |
|---|---|---|---|
| A | 6625 | 26 | 0.392453% |
| B | 6625 | 46 | 0.694340% |
| C | 6625 | 81 | 1.222642% |
| D | 6624 | 62 | 0.935990% |
Noise dominated data is calculated using 1-second bins in cleaned event files. If a bin has >2000 counts, and if more than 50% of those come from <1% of pixels, then it is considered to be noise-dominated and hence unusable.
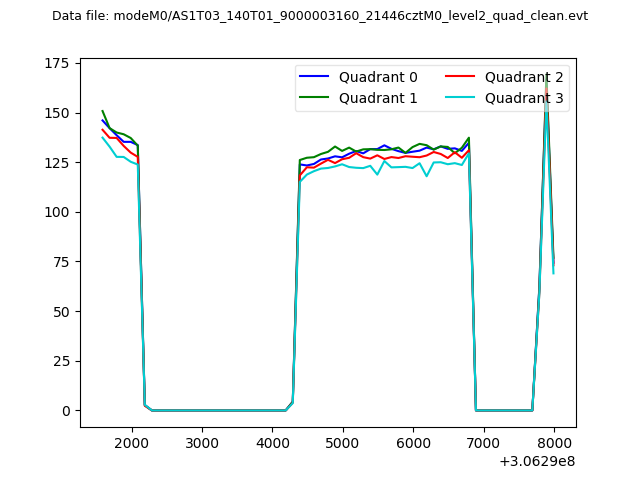
| Quadrant | # 1 sec bins | Bins with >0 counts | Bins with >2000 counts | High rate bins dominated by noise | Noise dominated (total time) | Noise dominated (detector-on time) | Marked lightcurve |
|---|---|---|---|---|---|---|---|
| A | 7590 | 6625 | 0 | 0 | 0.00% | 0.00% | 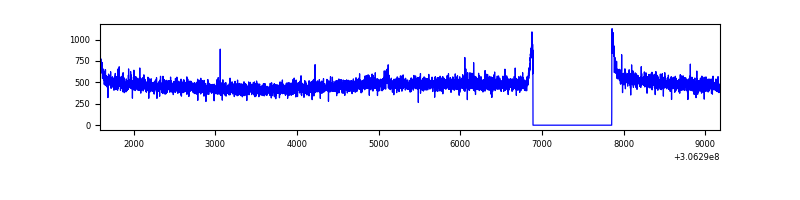 |
| B | 7590 | 6625 | 2 | 2 | 0.03% | 0.03% | 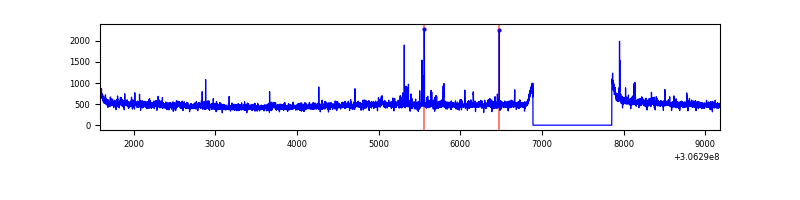 |
| C | 7590 | 6625 | 2 | 2 | 0.03% | 0.03% | 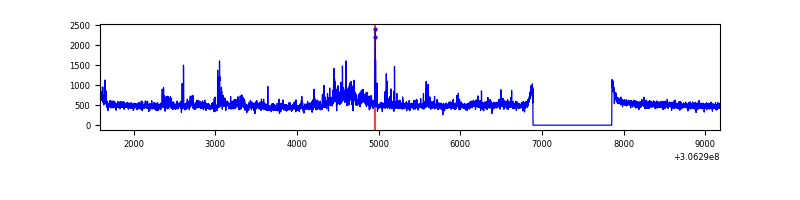 |
| D | 7589 | 6624 | 38 | 38 | 0.50% | 0.57% | 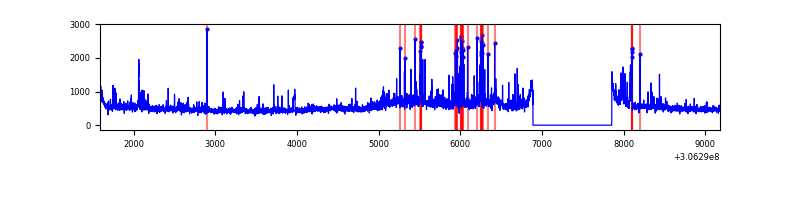 |
Top three noisy pixels from each quadrant. If the there are fewer than three noisy pixels in the level2.evt file, extra rows are filled as -1
| Pixel properties | Quadrant properties | ||||||
|---|---|---|---|---|---|---|---|
| Quadrant | DetID | PixID | Counts | Sigma | Mean | Median | Sigma |
| A | 11 | 47 | 11440 | 65.35 | 809 | 794 | 162.9 |
| A | 13 | 254 | 9569 | 53.86 | 809 | 794 | 162.9 |
| A | 0 | 226 | 6898 | 37.47 | 809 | 794 | 162.9 |
| B | 0 | 230 | 23759 | 147.89 | 812 | 791 | 155.3 |
| B | 12 | 111 | 18845 | 116.25 | 812 | 791 | 155.3 |
| B | 0 | 190 | 17585 | 108.14 | 812 | 791 | 155.3 |
| C | 3 | 233 | 336199 | 1843.86 | 777 | 781 | 181.9 |
| C | 14 | 238 | 122929 | 671.47 | 777 | 781 | 181.9 |
| C | 13 | 61 | 5352 | 25.13 | 777 | 781 | 181.9 |
| D | 1 | 52 | 258799 | 1351.5 | 781 | 761 | 190.9 |
| D | 12 | 235 | 232644 | 1214.51 | 781 | 761 | 190.9 |
| D | 1 | 20 | 109152 | 567.71 | 781 | 761 | 190.9 |
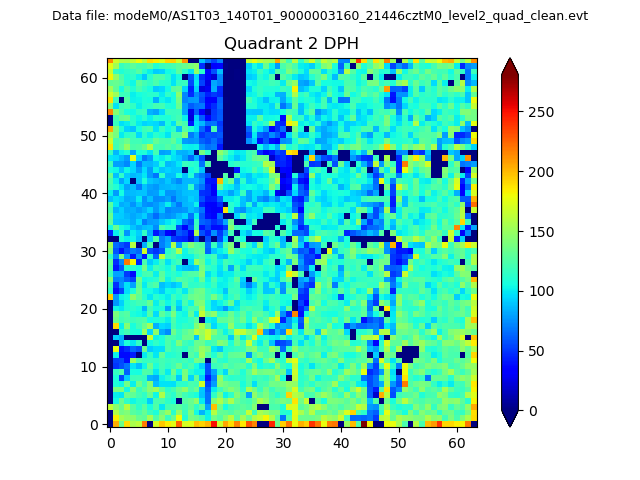
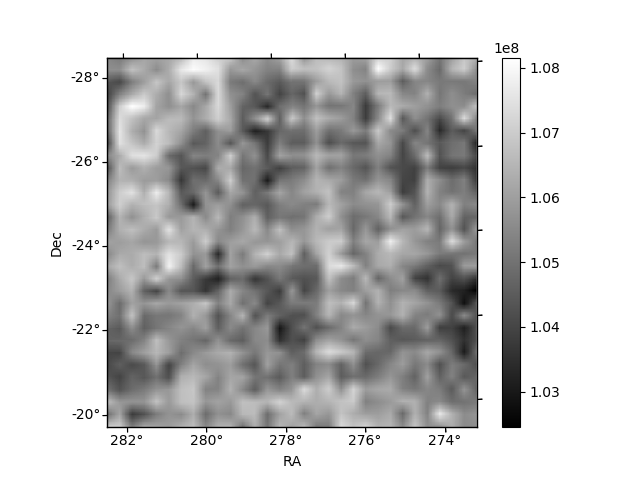
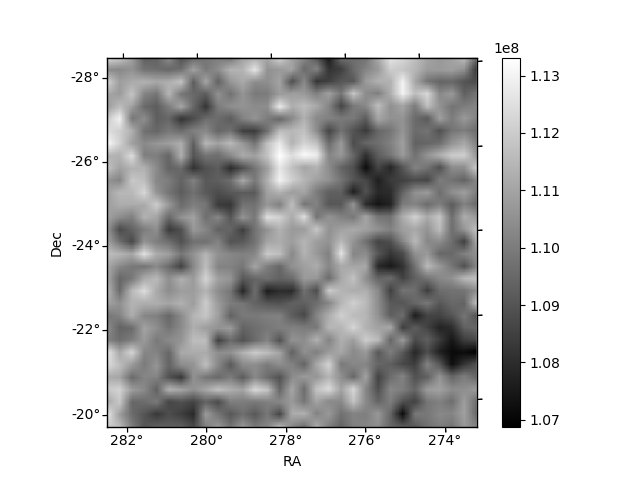
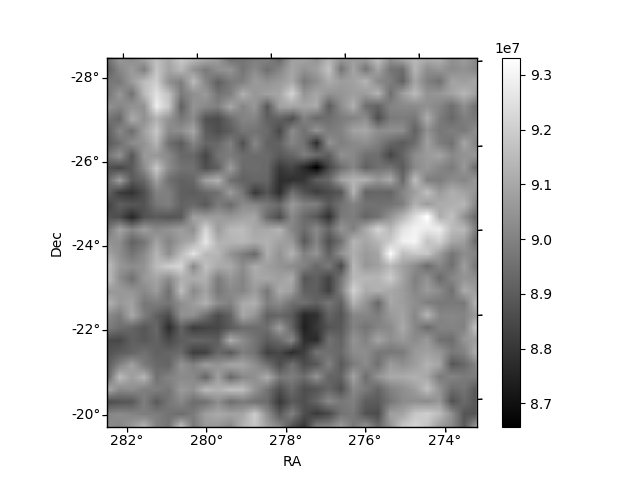
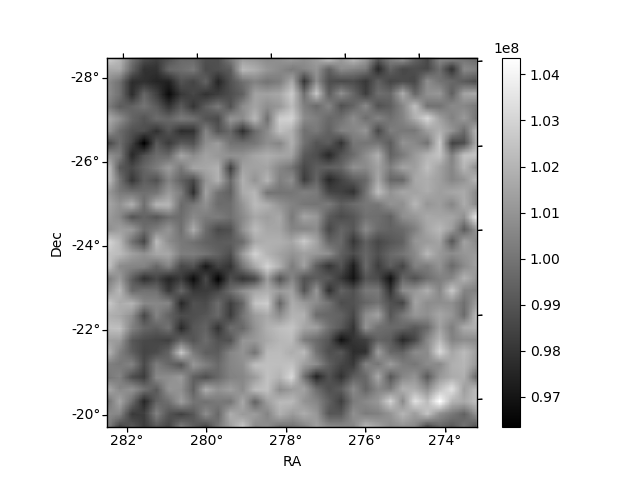
Histogram calculated using DETX and DETY for each event in the final _common_clean file
| Quadrant A | 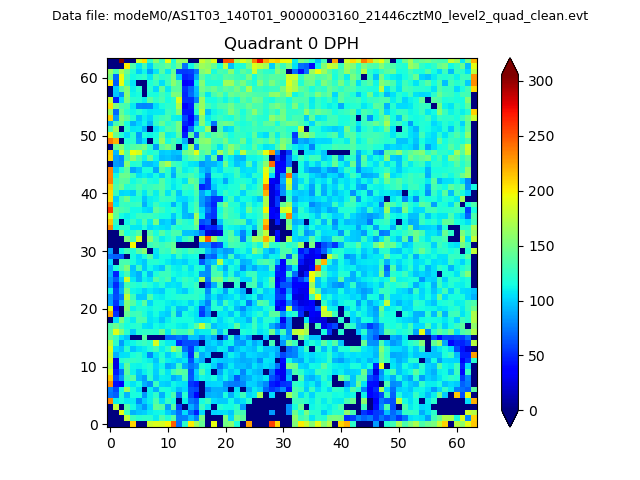 |
 |
Quadrant B |
|---|---|---|---|
| Quadrant D |  |
 |
Quadrant C |
| Plot type | Count rate plots | Images |
|---|---|---|
| Comparison with Poisson distribution Blue bars denote a histogram of data divided into 1 sec bins. Red curve is a Poisson curve with rate = median count rate of data. |
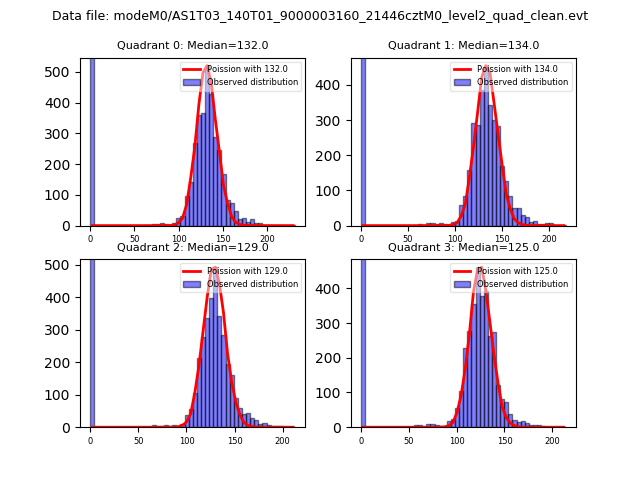 |
 |
| Quadrant-wise count rates Data is divided into 100 sec bins |
 |
|
| Module-wise count rates for Quadrant A Data is divided into 100 sec bins |
 |
 |
| Module-wise count rates for Quadrant B Data is divided into 100 sec bins |
 |
 |
| Module-wise count rates for Quadrant C Data is divided into 100 sec bins |
 |
 |
| Module-wise count rates for Quadrant D Data is divided into 100 sec bins |
 |
 |
| Parameter | Plot |
|---|---|
| CZT HV Monitor |  |
| D_VDD | 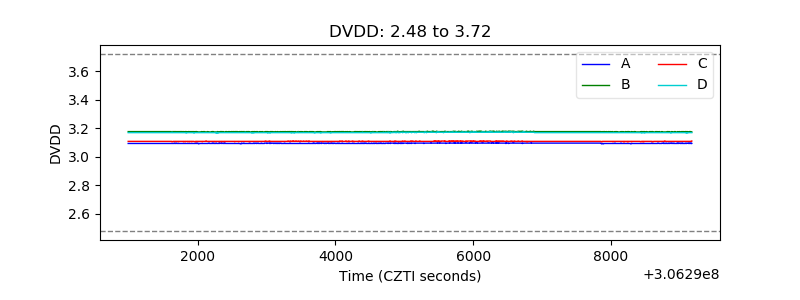 |
| Temperature 1 | 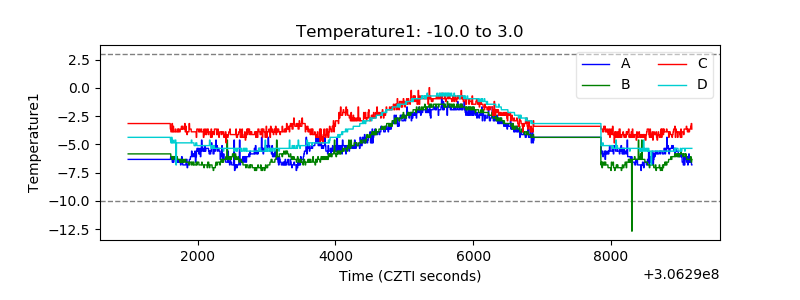 |
| Veto HV Monitor | 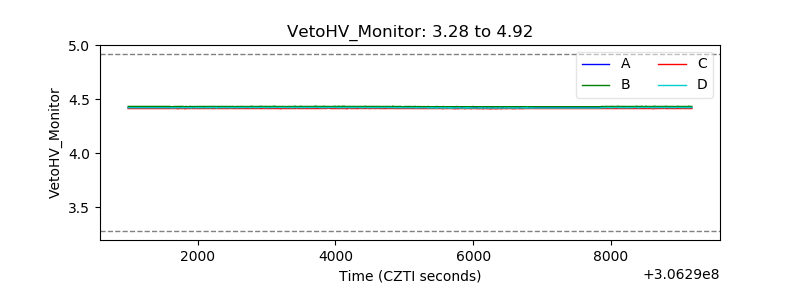 |
| Veto LLD | 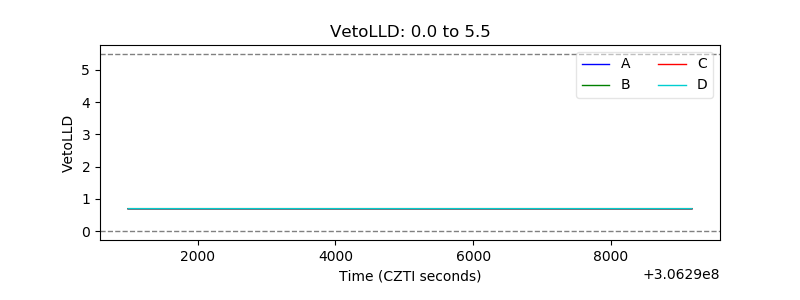 |
| Alpha Counter | 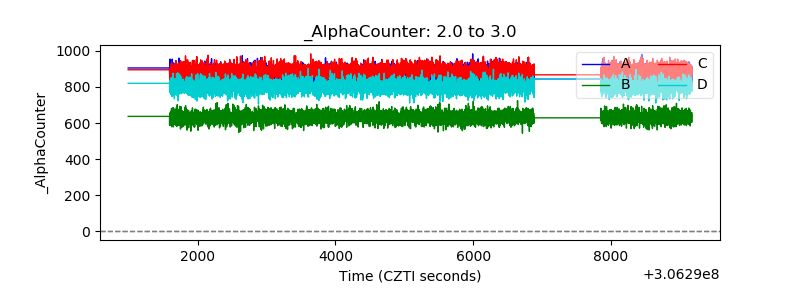 |
| _CPM_Rate | 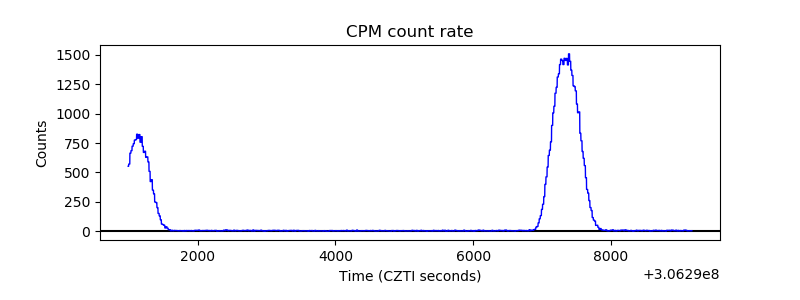 |
| CZT Counter | 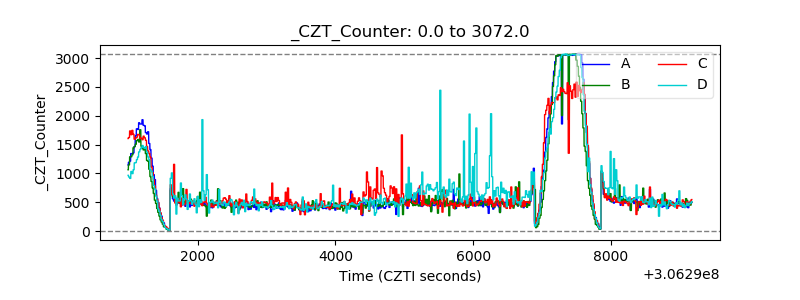 |
| +2.5 Volts monitor |  |
| +5 Volts monitor | 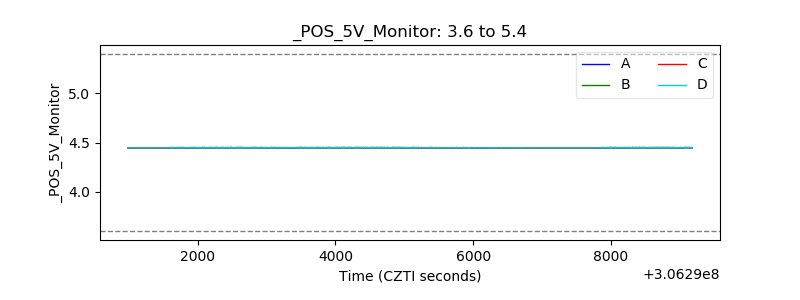 |
| _ROLL_ROT | 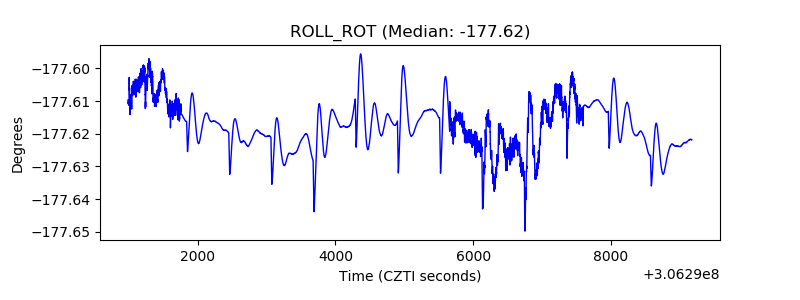 |
| _Roll_DEC | 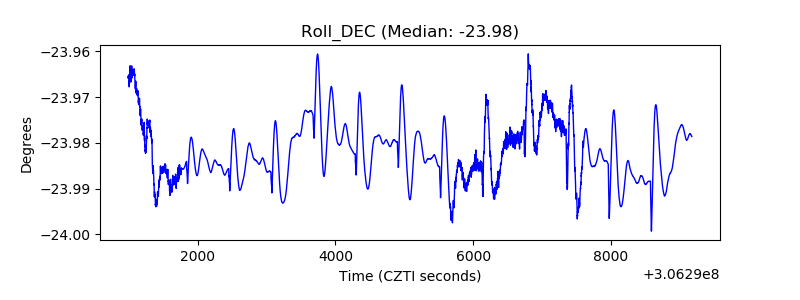 |
| _Roll_RA | 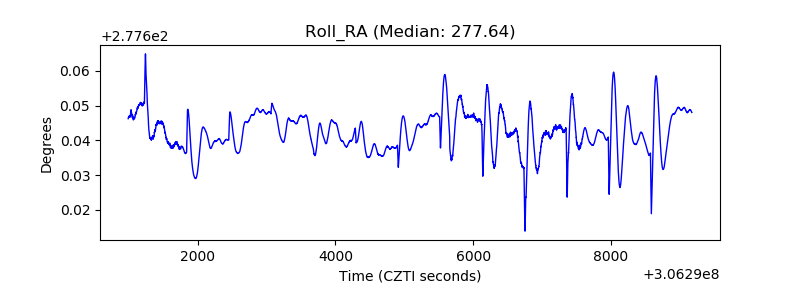 |
| Veto Counter | 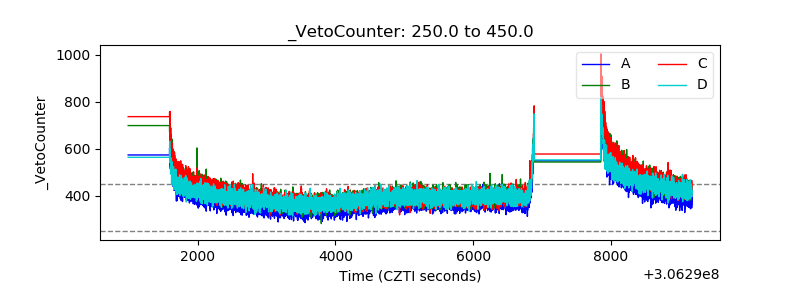 |