| Param | Original file | Final file |
|---|---|---|
| Filename | modeM0/AS1T03_140T01_9000003160_21448cztM0_level2.evt | modeM0/AS1T03_140T01_9000003160_21448cztM0_level2_quad_clean.evt |
| Size (bytes) | 461,638,080 | 61,925,760 |
| Size | 440.3 MB | 59.1 MB |
| Events in quadrant A | 3,071,990 | 369,449 |
| Events in quadrant B | 3,048,924 | 374,949 |
| Events in quadrant C | 3,432,136 | 362,573 |
| Events in quadrant D | 4,017,372 | 345,666 |
| Mode SS | |||
|---|---|---|---|
| Quadrant | BADHDUFLAG | Total packets | Discarded packets |
| A | 0 | 124 | 0 |
| B | 0 | 124 | 0 |
| C | 0 | 124 | 0 |
| D | 0 | 124 | 0 |
| Mode M0 | |||
|---|---|---|---|
| Quadrant | BADHDUFLAG | Total packets | Discarded packets |
| A | 0 | 12656 | 1 |
| B | 0 | 12719 | 1 |
| C | 0 | 14044 | 1 |
| D | 0 | 15841 | 1 |
| Mode M9 | |||
|---|---|---|---|
| Quadrant | BADHDUFLAG | Total packets | Discarded packets |
| A | 0 | 11 | 0 |
| B | 0 | 11 | 0 |
| C | 0 | 11 | 0 |
| D | 0 | 11 | 0 |
| Quadrant | Total seconds | Saturated seconds | Saturation percentage |
|---|---|---|---|
| A | 6041 | 48 | 0.794570% |
| B | 6041 | 53 | 0.877338% |
| C | 6041 | 103 | 1.705016% |
| D | 6041 | 146 | 2.416818% |
Noise dominated data is calculated using 1-second bins in cleaned event files. If a bin has >2000 counts, and if more than 50% of those come from <1% of pixels, then it is considered to be noise-dominated and hence unusable.
| Quadrant | # 1 sec bins | Bins with >0 counts | Bins with >2000 counts | High rate bins dominated by noise | Noise dominated (total time) | Noise dominated (detector-on time) | Marked lightcurve |
|---|---|---|---|---|---|---|---|
| A | 7151 | 6041 | 0 | 0 | 0.00% | 0.00% | 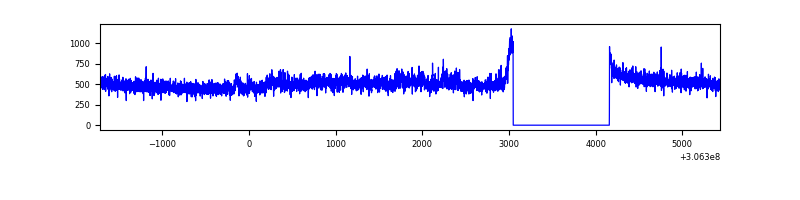 |
| B | 7151 | 6041 | 2 | 2 | 0.03% | 0.03% | 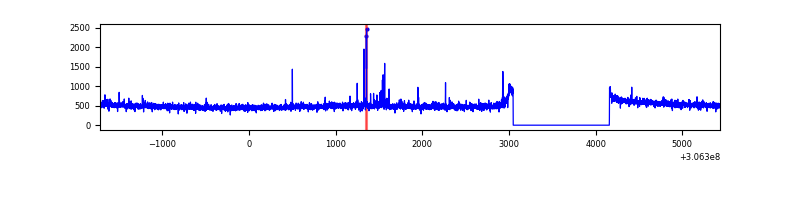 |
| C | 7151 | 6041 | 6 | 6 | 0.08% | 0.10% | 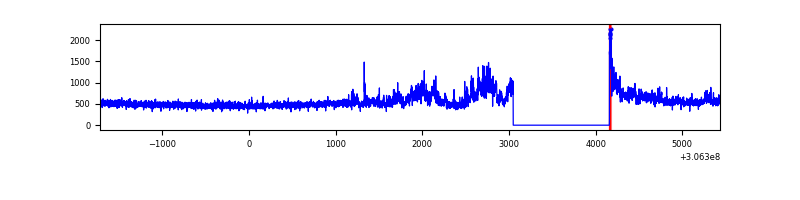 |
| D | 7151 | 6041 | 91 | 91 | 1.27% | 1.51% | 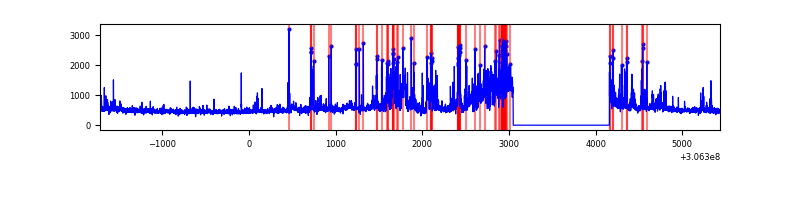 |
Top three noisy pixels from each quadrant. If the there are fewer than three noisy pixels in the level2.evt file, extra rows are filled as -1
| Pixel properties | Quadrant properties | ||||||
|---|---|---|---|---|---|---|---|
| Quadrant | DetID | PixID | Counts | Sigma | Mean | Median | Sigma |
| A | 11 | 47 | 129952 | 845.48 | 762 | 748 | 152.8 |
| A | 13 | 254 | 9847 | 59.54 | 762 | 748 | 152.8 |
| A | 0 | 226 | 6597 | 38.27 | 762 | 748 | 152.8 |
| B | 0 | 229 | 26974 | 181.59 | 763 | 745 | 144.4 |
| B | 12 | 111 | 17130 | 113.44 | 763 | 745 | 144.4 |
| B | 11 | 111 | 15098 | 99.37 | 763 | 745 | 144.4 |
| C | 3 | 233 | 468178 | 2758.19 | 730 | 734 | 169.5 |
| C | 14 | 238 | 116562 | 683.45 | 730 | 734 | 169.5 |
| C | 13 | 61 | 5124 | 25.9 | 730 | 734 | 169.5 |
| D | 14 | 34 | 412093 | 2357.95 | 730 | 710 | 174.5 |
| D | 1 | 52 | 402902 | 2305.27 | 730 | 710 | 174.5 |
| D | 12 | 235 | 188268 | 1075.04 | 730 | 710 | 174.5 |
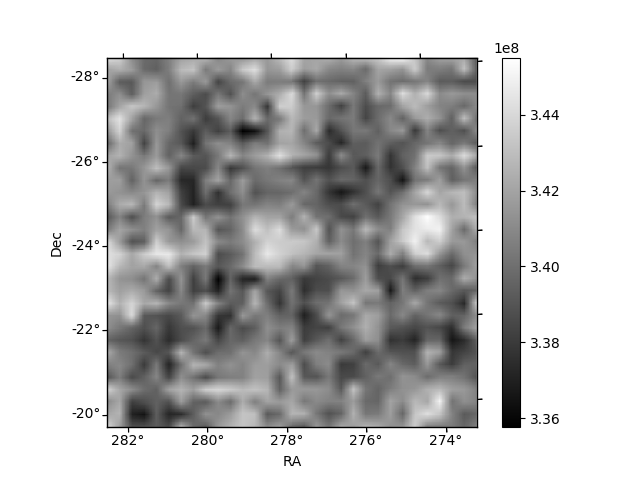
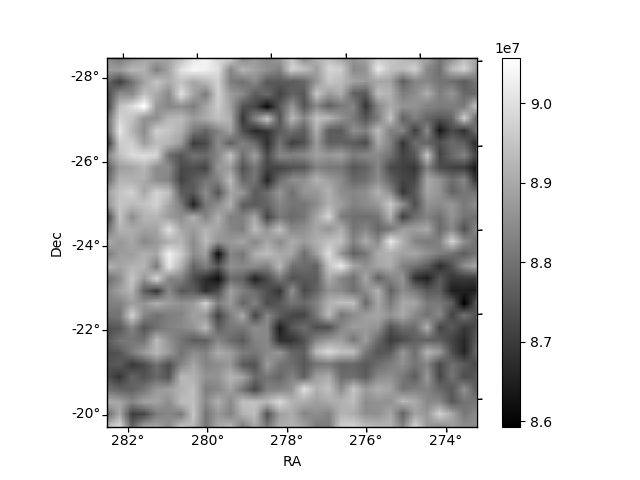
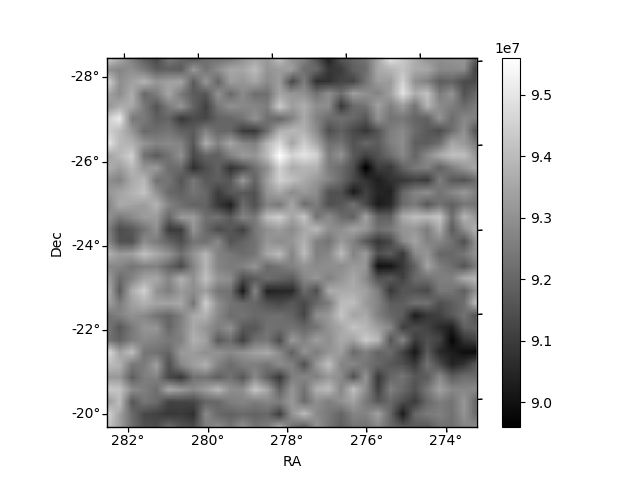
Histogram calculated using DETX and DETY for each event in the final _common_clean file
| Quadrant A | 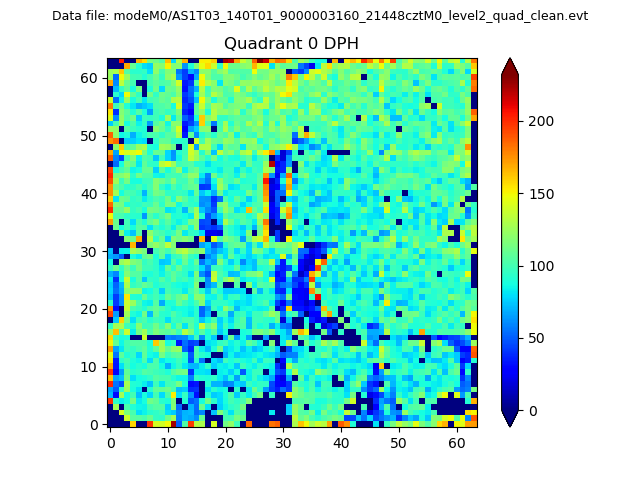 |
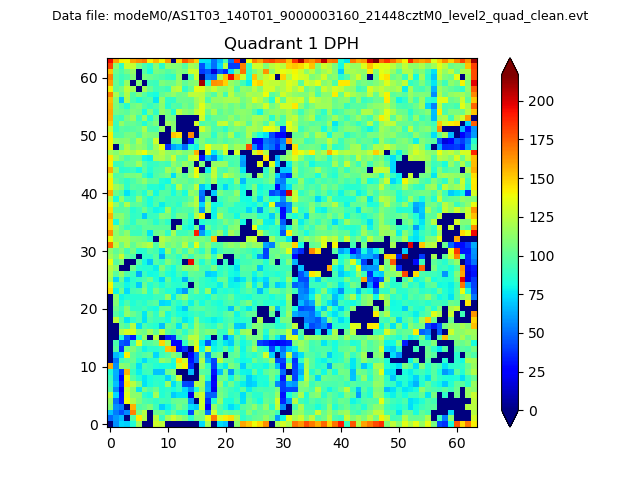 |
Quadrant B |
|---|---|---|---|
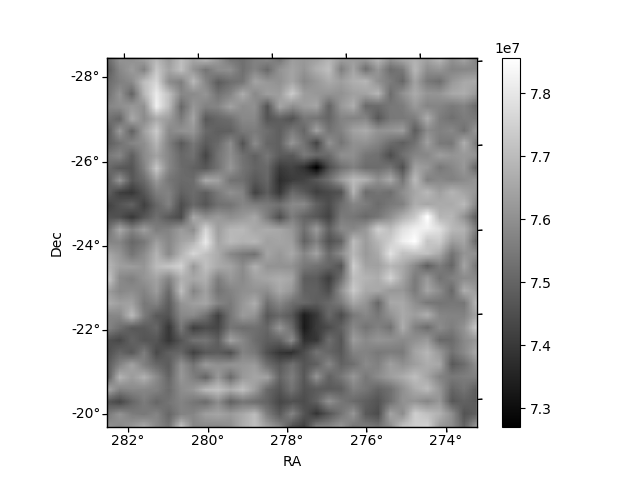
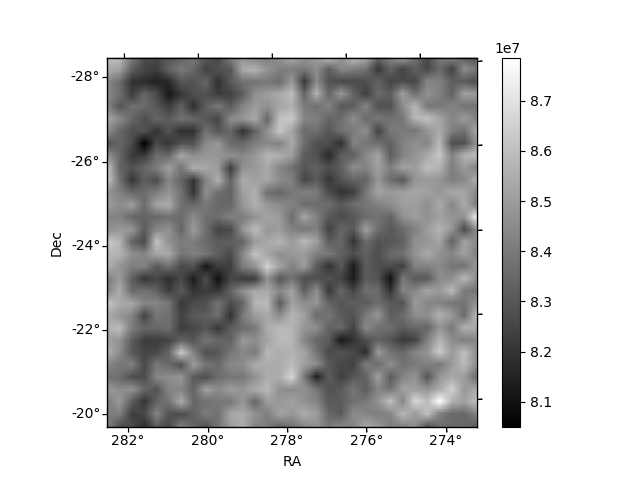
| Quadrant D | 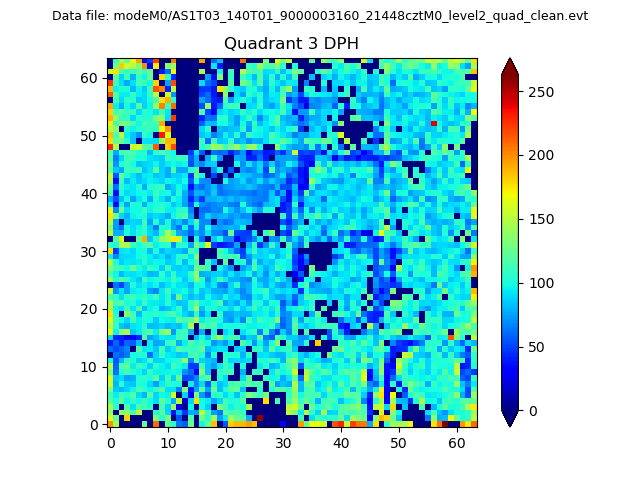 |
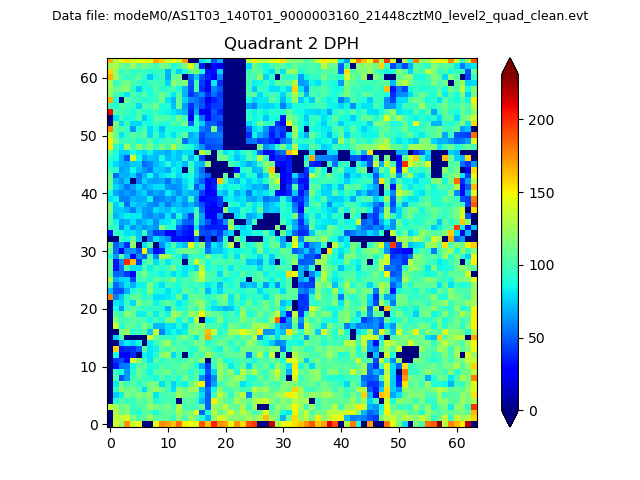 |
Quadrant C |
| Plot type | Count rate plots | Images |
|---|---|---|
| Comparison with Poisson distribution Blue bars denote a histogram of data divided into 1 sec bins. Red curve is a Poisson curve with rate = median count rate of data. |
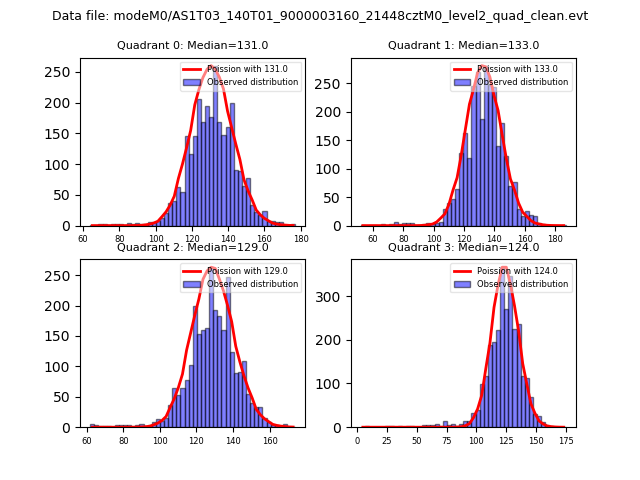 |
 |
| Quadrant-wise count rates Data is divided into 100 sec bins |
 |
|
| Module-wise count rates for Quadrant A Data is divided into 100 sec bins |
 |
 |
| Module-wise count rates for Quadrant B Data is divided into 100 sec bins |
 |
 |
| Module-wise count rates for Quadrant C Data is divided into 100 sec bins |
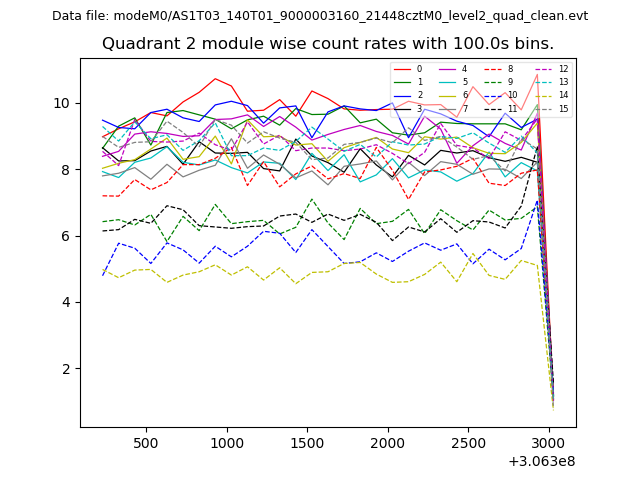 |
 |
| Module-wise count rates for Quadrant D Data is divided into 100 sec bins |
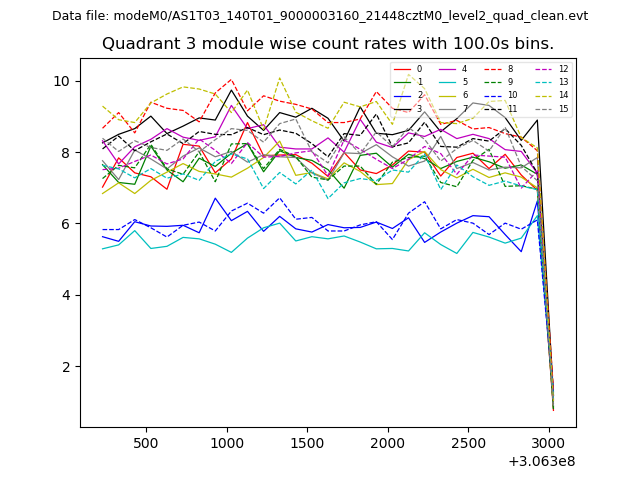 |
 |
| Parameter | Plot |
|---|---|
| CZT HV Monitor | 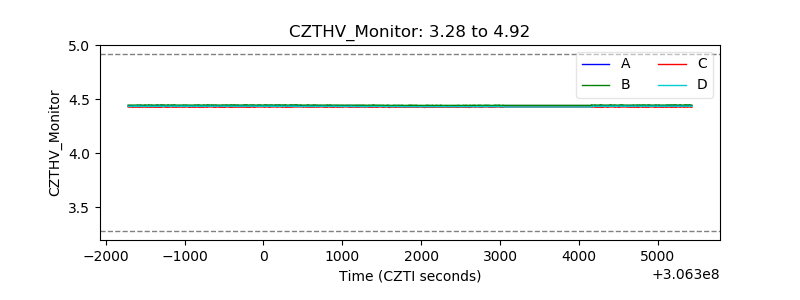 |
| D_VDD | 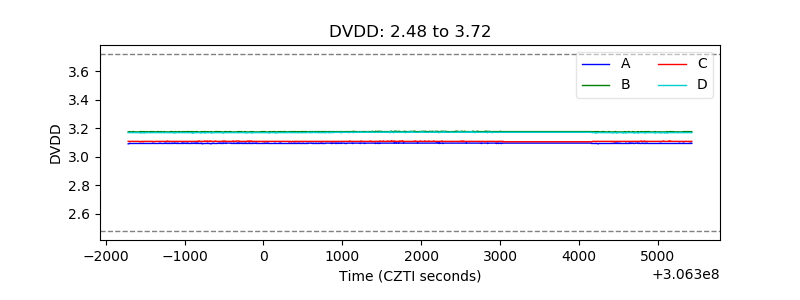 |
| Temperature 1 | 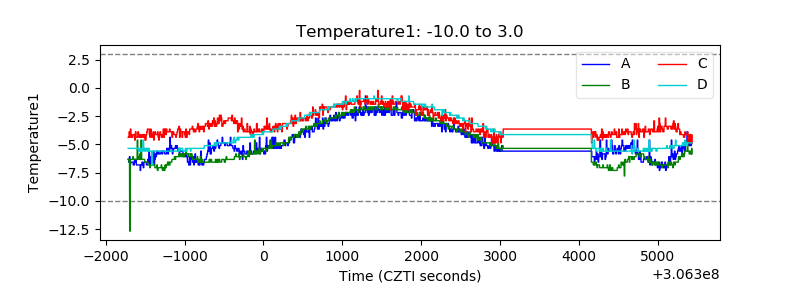 |
| Veto HV Monitor | 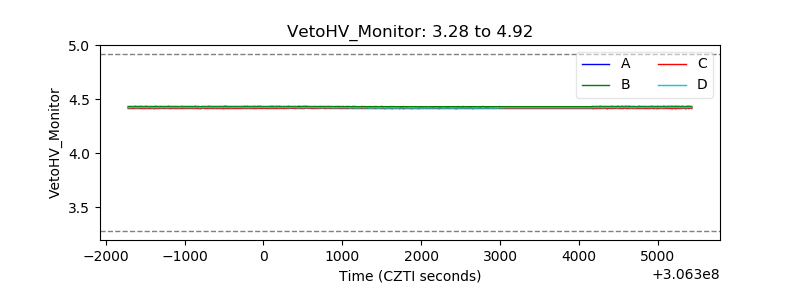 |
| Veto LLD |  |
| Alpha Counter | 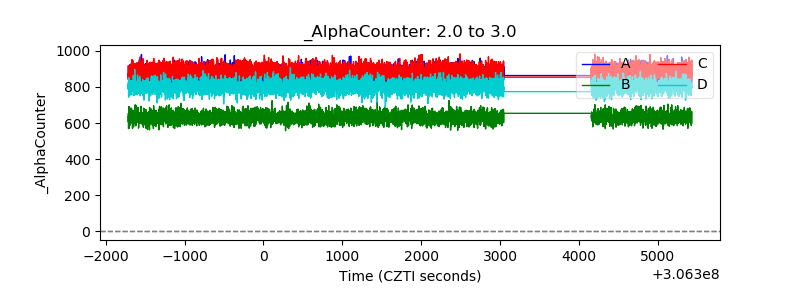 |
| _CPM_Rate | 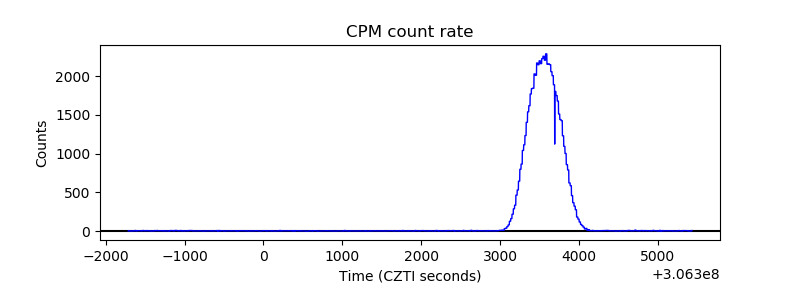 |
| CZT Counter | 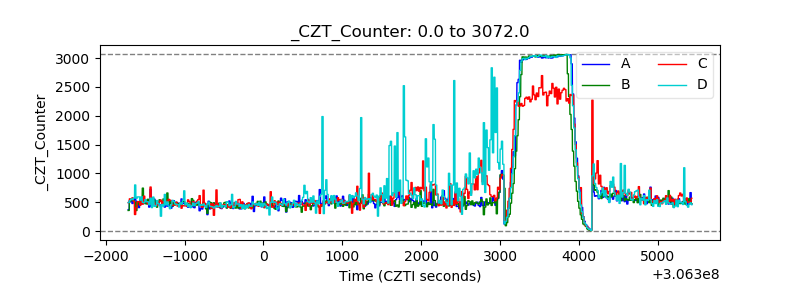 |
| +2.5 Volts monitor |  |
| +5 Volts monitor |  |
| _ROLL_ROT | 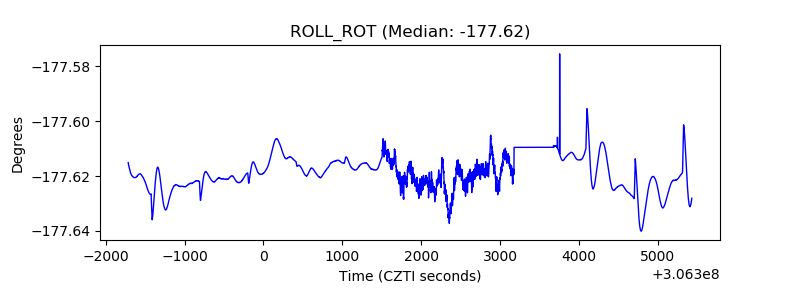 |
| _Roll_DEC | 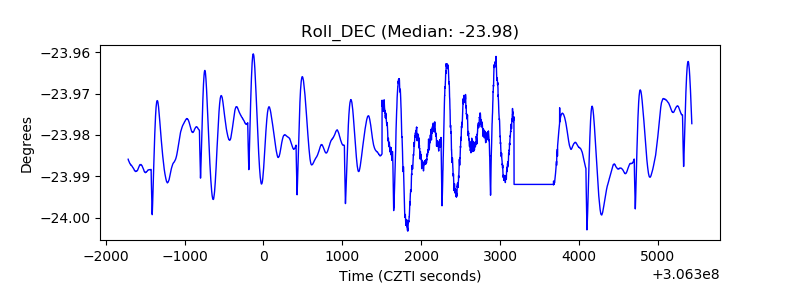 |
| _Roll_RA | 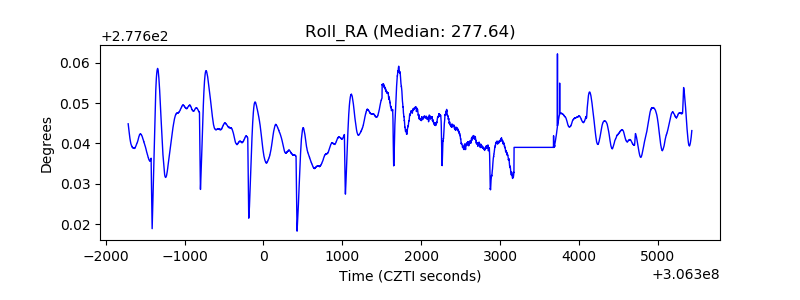 |
| Veto Counter |  |