| Param | Original file | Final file |
|---|---|---|
| Filename | modeM0/AS1T03_140T01_9000003160_21450cztM0_level2.evt | modeM0/AS1T03_140T01_9000003160_21450cztM0_level2_quad_clean.evt |
| Size (bytes) | 282,257,280 | 49,763,520 |
| Size | 269.2 MB | 47.5 MB |
| Events in quadrant A | 2,044,756 | 316,004 |
| Events in quadrant B | 2,014,994 | 321,284 |
| Events in quadrant C | 2,021,790 | 309,341 |
| Events in quadrant D | 2,215,858 | 300,195 |
| Mode SS | |||
|---|---|---|---|
| Quadrant | BADHDUFLAG | Total packets | Discarded packets |
| A | 0 | 72 | 0 |
| B | 0 | 72 | 0 |
| C | 0 | 72 | 0 |
| D | 0 | 72 | 0 |
| Mode M0 | |||
|---|---|---|---|
| Quadrant | BADHDUFLAG | Total packets | Discarded packets |
| A | 0 | 8282 | 1 |
| B | 0 | 8145 | 1 |
| C | 0 | 8169 | 1 |
| D | 0 | 8789 | 1 |
| Mode M9 | |||
|---|---|---|---|
| Quadrant | BADHDUFLAG | Total packets | Discarded packets |
| A | 0 | 1 | 0 |
| B | 0 | 2 | 0 |
| C | 0 | 2 | 0 |
| D | 0 | 2 | 0 |
| Quadrant | Total seconds | Saturated seconds | Saturation percentage |
|---|---|---|---|
| A | 3677 | 23 | 0.625510% |
| B | 3677 | 25 | 0.679902% |
| C | 3677 | 48 | 1.305412% |
| D | 3677 | 21 | 0.571118% |
Noise dominated data is calculated using 1-second bins in cleaned event files. If a bin has >2000 counts, and if more than 50% of those come from <1% of pixels, then it is considered to be noise-dominated and hence unusable.
| Quadrant | # 1 sec bins | Bins with >0 counts | Bins with >2000 counts | High rate bins dominated by noise | Noise dominated (total time) | Noise dominated (detector-on time) | Marked lightcurve |
|---|---|---|---|---|---|---|---|
| A | 3677 | 3677 | 0 | 0 | 0.00% | 0.00% | 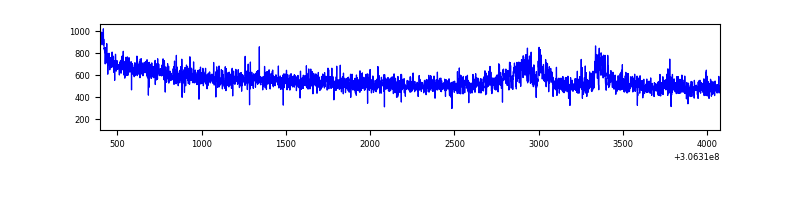 |
| B | 3677 | 3677 | 3 | 3 | 0.08% | 0.08% | 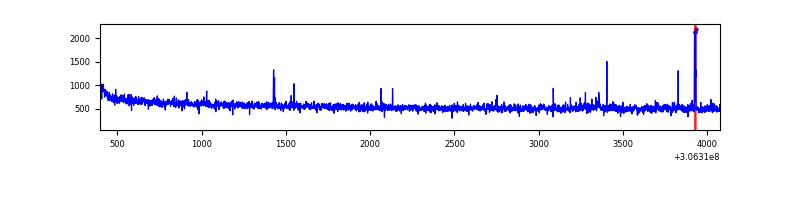 |
| C | 3677 | 3677 | 0 | 0 | 0.00% | 0.00% | 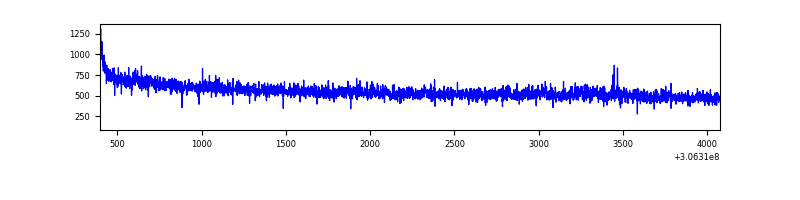 |
| D | 3677 | 3677 | 14 | 14 | 0.38% | 0.38% | 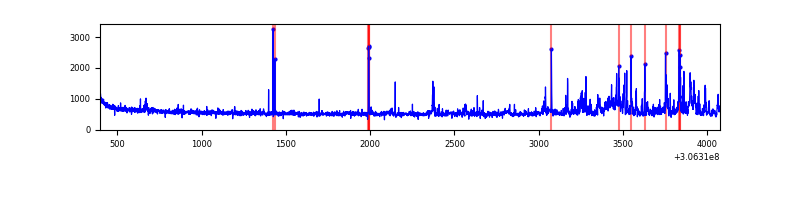 |
Top three noisy pixels from each quadrant. If the there are fewer than three noisy pixels in the level2.evt file, extra rows are filled as -1
| Pixel properties | Quadrant properties | ||||||
|---|---|---|---|---|---|---|---|
| Quadrant | DetID | PixID | Counts | Sigma | Mean | Median | Sigma |
| A | 11 | 47 | 82354 | 818.13 | 509 | 502 | 100.0 |
| A | 13 | 254 | 5493 | 49.89 | 509 | 502 | 100.0 |
| A | 0 | 226 | 4442 | 39.38 | 509 | 502 | 100.0 |
| B | 0 | 189 | 12072 | 123.45 | 504 | 494 | 93.8 |
| B | 0 | 230 | 11050 | 112.55 | 504 | 494 | 93.8 |
| B | 12 | 111 | 10730 | 109.14 | 504 | 494 | 93.8 |
| C | 14 | 238 | 79427 | 704.54 | 485 | 489 | 112.0 |
| C | 3 | 233 | 51089 | 451.62 | 485 | 489 | 112.0 |
| C | 13 | 61 | 3384 | 25.84 | 485 | 489 | 112.0 |
| D | 7 | 38 | 104197 | 871.5 | 494 | 480 | 119.0 |
| D | 12 | 235 | 86270 | 720.87 | 494 | 480 | 119.0 |
| D | 14 | 35 | 75266 | 628.4 | 494 | 480 | 119.0 |
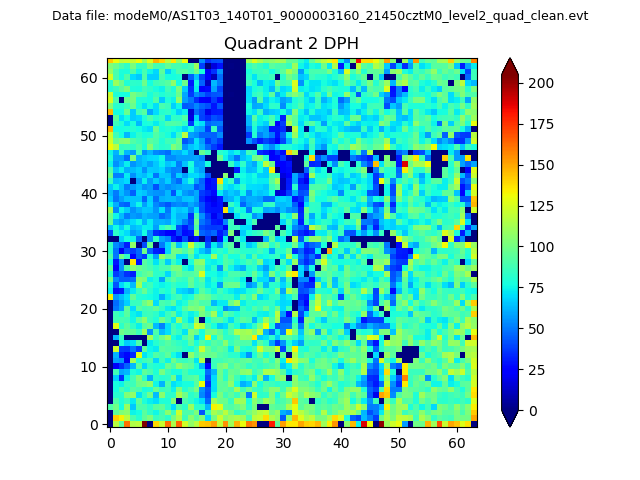
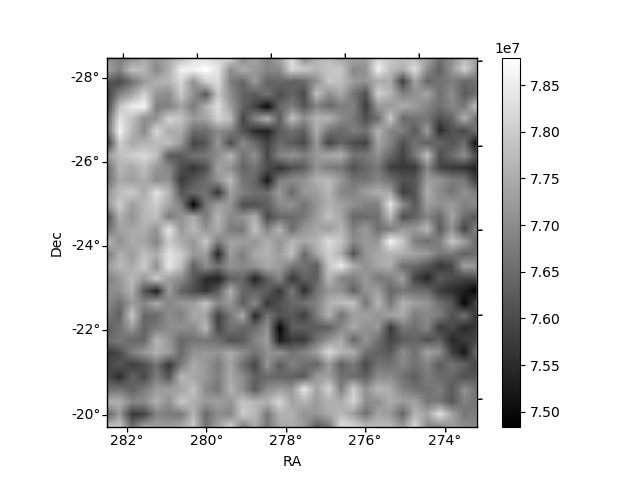
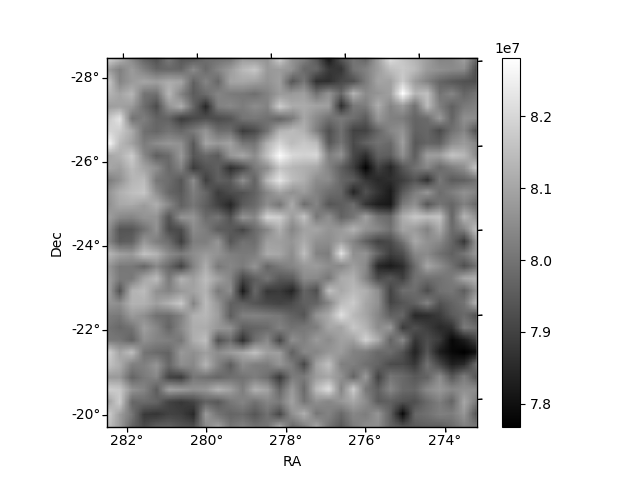
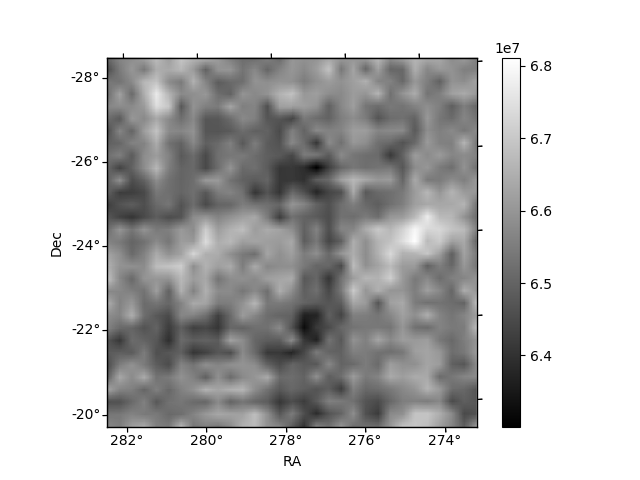
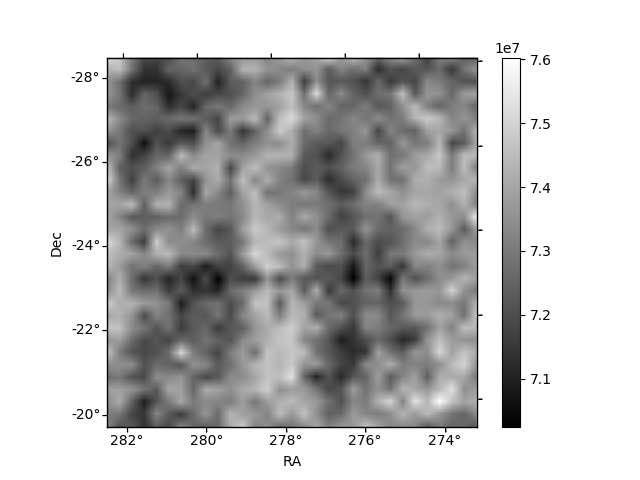
Histogram calculated using DETX and DETY for each event in the final _common_clean file
| Quadrant A |  |
 |
Quadrant B |
|---|---|---|---|
| Quadrant D |  |
 |
Quadrant C |
| Plot type | Count rate plots | Images |
|---|---|---|
| Comparison with Poisson distribution Blue bars denote a histogram of data divided into 1 sec bins. Red curve is a Poisson curve with rate = median count rate of data. |
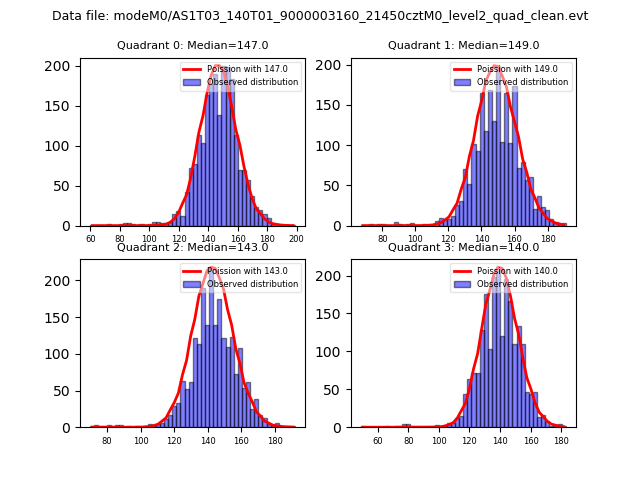 |
 |
| Quadrant-wise count rates Data is divided into 100 sec bins |
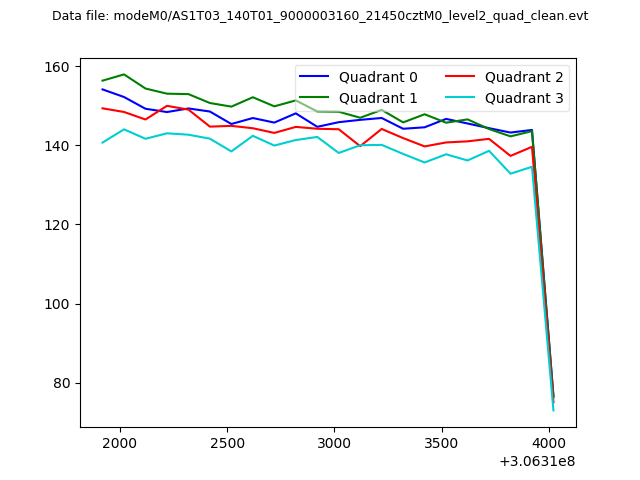 |
|
| Module-wise count rates for Quadrant A Data is divided into 100 sec bins |
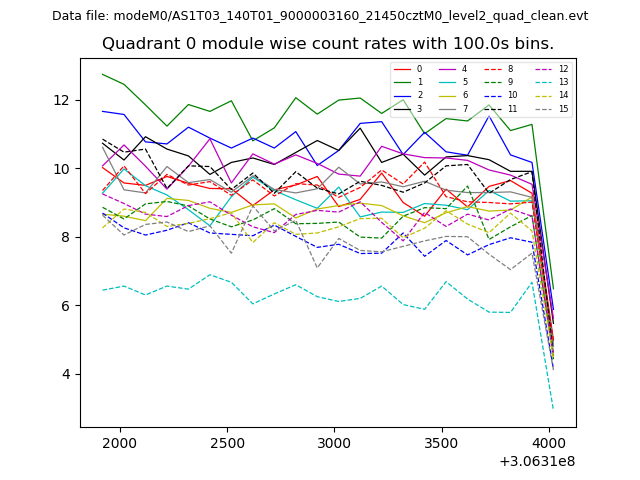 |
 |
| Module-wise count rates for Quadrant B Data is divided into 100 sec bins |
 |
 |
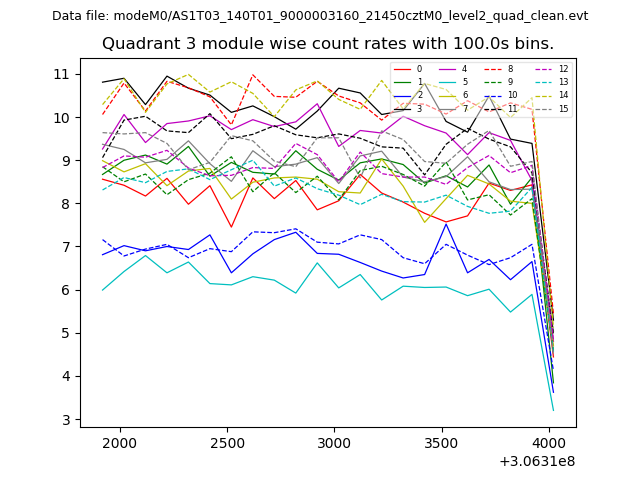
| Module-wise count rates for Quadrant C Data is divided into 100 sec bins |
 |
 |
| Module-wise count rates for Quadrant D Data is divided into 100 sec bins |
 |
 |
| Parameter | Plot |
|---|---|
| CZT HV Monitor |  |
| D_VDD | 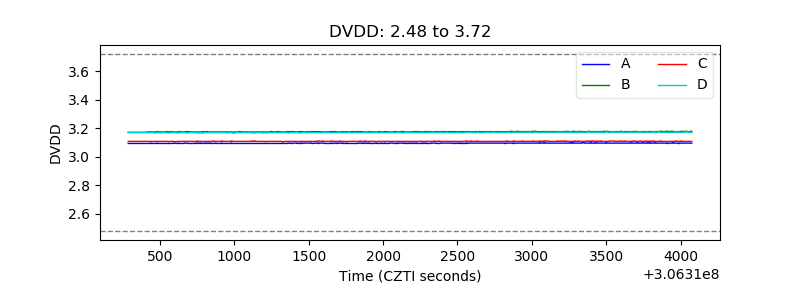 |
| Temperature 1 | 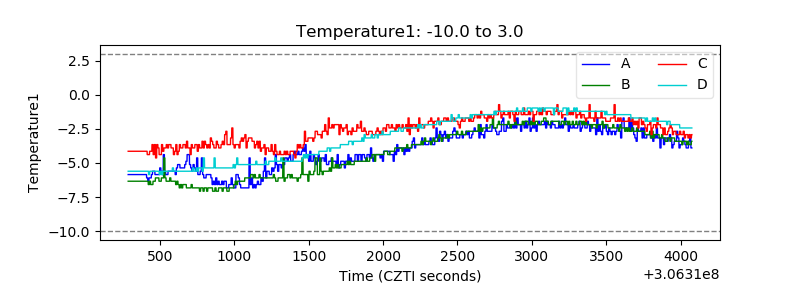 |
| Veto HV Monitor | 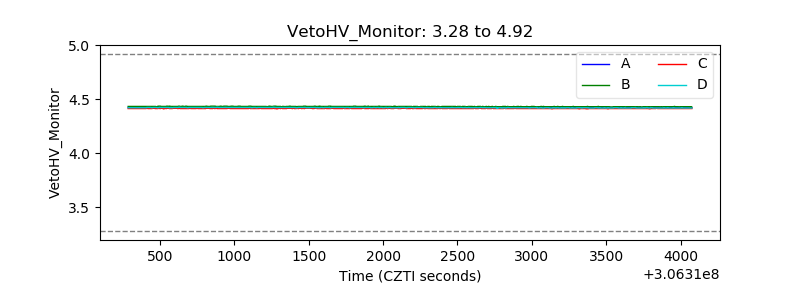 |
| Veto LLD | 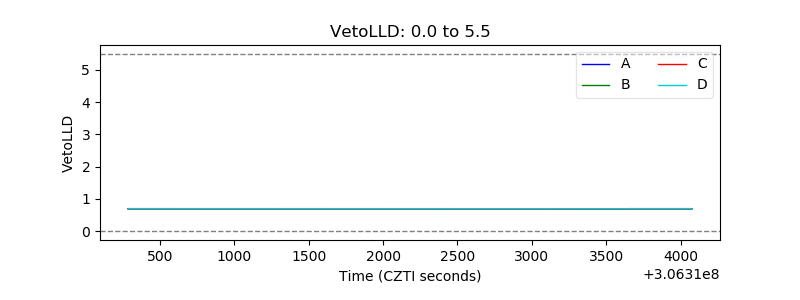 |
| Alpha Counter | 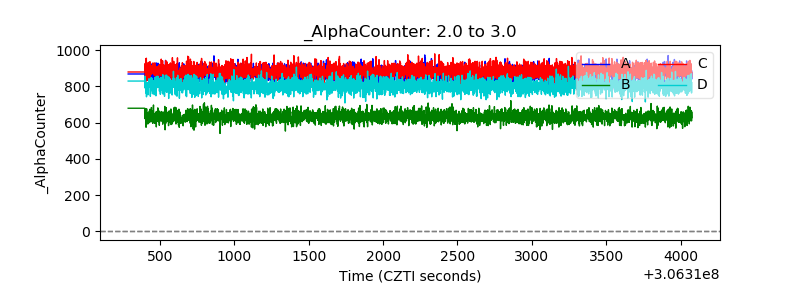 |
| _CPM_Rate | 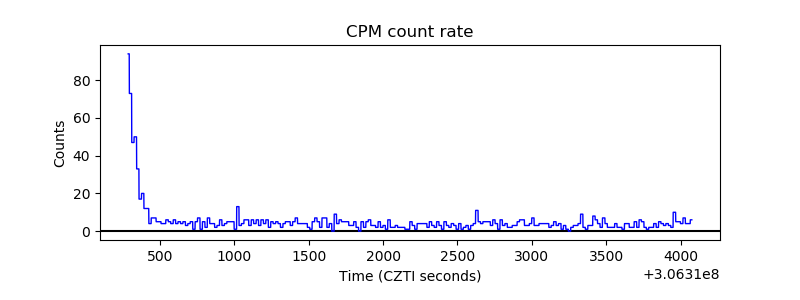 |
| CZT Counter | 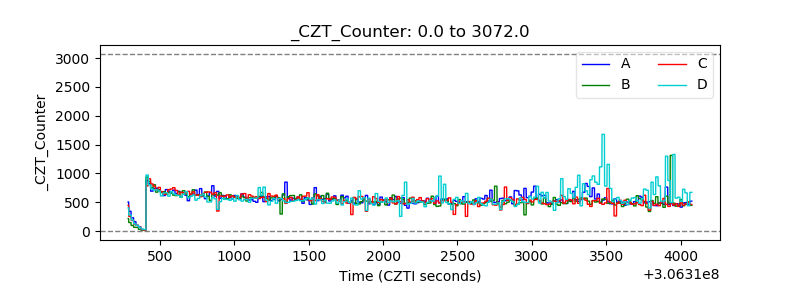 |
| +2.5 Volts monitor |  |
| +5 Volts monitor | 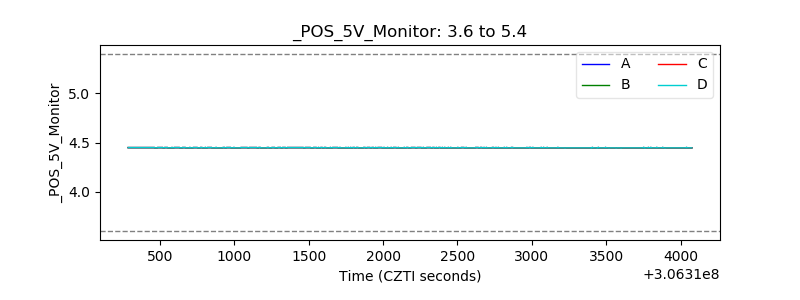 |
| _ROLL_ROT | 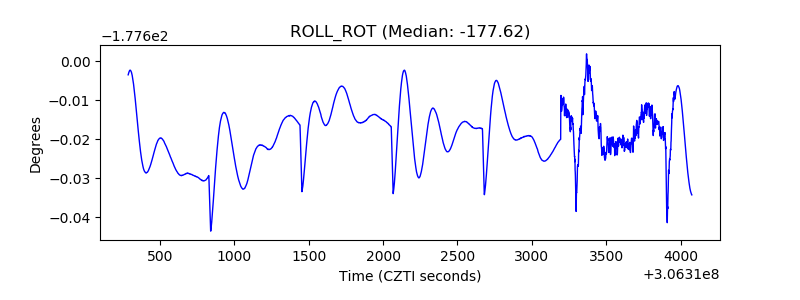 |
| _Roll_DEC | 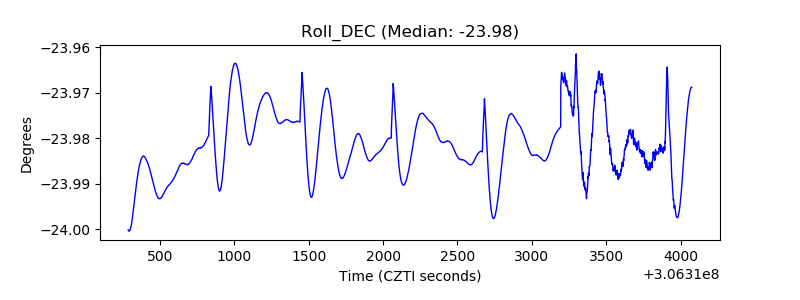 |
| _Roll_RA | 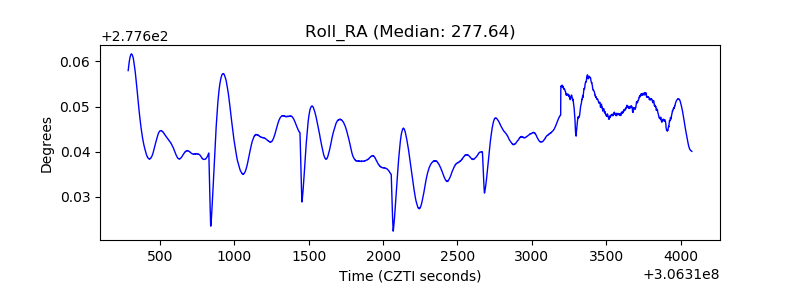 |
| Veto Counter | 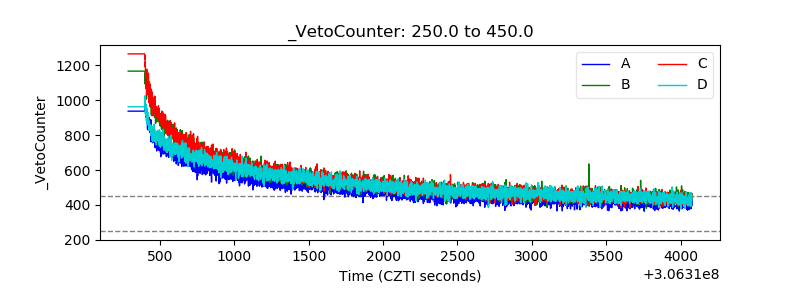 |