| Param | Original file | Final file |
|---|---|---|
| Filename | modeM0/AS1A05_117T01_9000003166cztM0_level2.fits | modeM0/AS1A05_117T01_9000003166cztM0_level2_quad_clean.evt |
| Size (bytes) | 409,055,040 | 410,978,880 |
| Size | 390.1 MB | 391.9 MB |
| Events in quadrant A | 2,505,014 | 2,493,898 |
| Events in quadrant B | 2,406,078 | 2,498,918 |
| Events in quadrant C | 2,433,548 | 2,376,607 |
| Events in quadrant D | 2,107,066 | 2,140,943 |
| Mode SS | |||
|---|---|---|---|
| Quadrant | BADHDUFLAG | Total packets | Discarded packets |
| A | 0 | 876 | 0 |
| B | 0 | 876 | 0 |
| C | 0 | 876 | 0 |
| D | 0 | 876 | 0 |
| Mode M9 | |||
|---|---|---|---|
| Quadrant | BADHDUFLAG | Total packets | Discarded packets |
| A | 0 | 50 | 0 |
| B | 0 | 50 | 0 |
| C | 0 | 50 | 0 |
| D | 0 | 50 | 0 |
| Mode M0 | |||
|---|---|---|---|
| Quadrant | BADHDUFLAG | Total packets | Discarded packets |
| A | 0 | 88350 | 0 |
| B | 0 | 88611 | 0 |
| C | 0 | 89047 | 0 |
| D | 0 | 115115 | 0 |
| Quadrant | Total seconds | Saturated seconds | Saturation percentage |
|---|---|---|---|
| A | 42754 | 421 | 0.984703% |
| B | 42754 | 546 | 1.277073% |
| C | 42754 | 621 | 1.452496% |
| D | 42754 | 1608 | 3.761052% |
Noise dominated data is calculated using 1-second bins in cleaned event files. If a bin has >2000 counts, and if more than 50% of those come from <1% of pixels, then it is considered to be noise-dominated and hence unusable.
| Quadrant | # 1 sec bins | Bins with >0 counts | Bins with >2000 counts | High rate bins dominated by noise | Noise dominated (total time) | Noise dominated (detector-on time) | Marked lightcurve |
|---|---|---|---|---|---|---|---|
| A | 47998 | 42744 | 0 | 0 | 0.00% | 0.00% |  |
| B | 47999 | 42745 | 0 | 0 | 0.00% | 0.00% |  |
| C | 47998 | 42744 | 0 | 0 | 0.00% | 0.00% |  |
| D | 47998 | 42741 | 0 | 0 | 0.00% | 0.00% |  |
Top three noisy pixels from each quadrant. If the there are fewer than three noisy pixels in the level2.evt file, extra rows are filled as -1
| Pixel properties | Quadrant properties | ||||||
|---|---|---|---|---|---|---|---|
| Quadrant | DetID | PixID | Counts | Sigma | Mean | Median | Sigma |
| A | 0 | 29 | 2441 | 11.18 | 651 | 608 | 164.0 |
| A | 7 | 110 | 2081 | 8.98 | 651 | 608 | 164.0 |
| A | 0 | 30 | 1944 | 8.15 | 651 | 608 | 164.0 |
| B | 2 | 9 | 2021 | 11.09 | 633 | 602 | 127.9 |
| B | 2 | 8 | 1655 | 8.23 | 633 | 602 | 127.9 |
| B | 14 | 254 | 1614 | 7.91 | 633 | 602 | 127.9 |
| C | 1 | 80 | 1951 | 8.21 | 640 | 596 | 165.1 |
| C | 1 | 81 | 1923 | 8.04 | 640 | 596 | 165.1 |
| C | 12 | 241 | 1709 | 6.74 | 640 | 596 | 165.1 |
| D | 3 | 14 | 1623 | 6.7 | 601 | 547 | 160.7 |
| D | 10 | 189 | 1483 | 5.82 | 601 | 547 | 160.7 |
| D | 6 | 38 | 1453 | 5.64 | 601 | 547 | 160.7 |
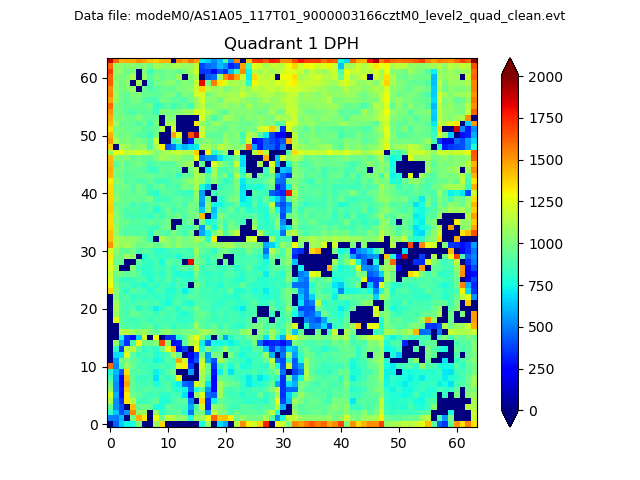
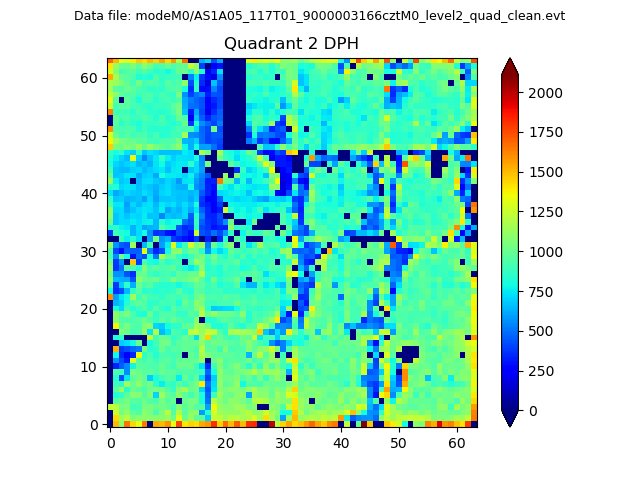
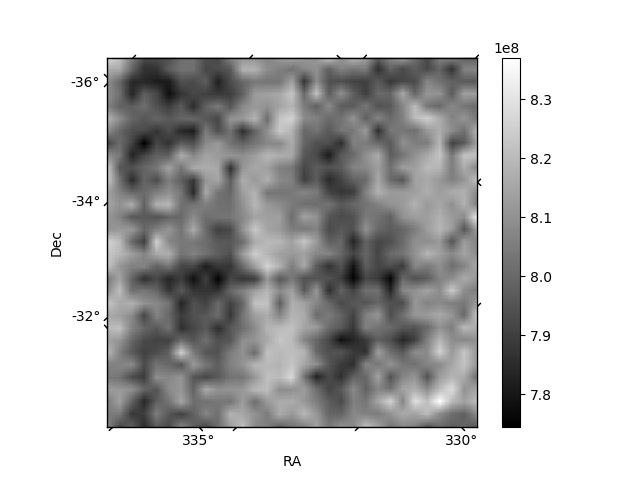
Histogram calculated using DETX and DETY for each event in the final _common_clean file
| Quadrant A |  |
 |
Quadrant B |
|---|---|---|---|
| Quadrant D | 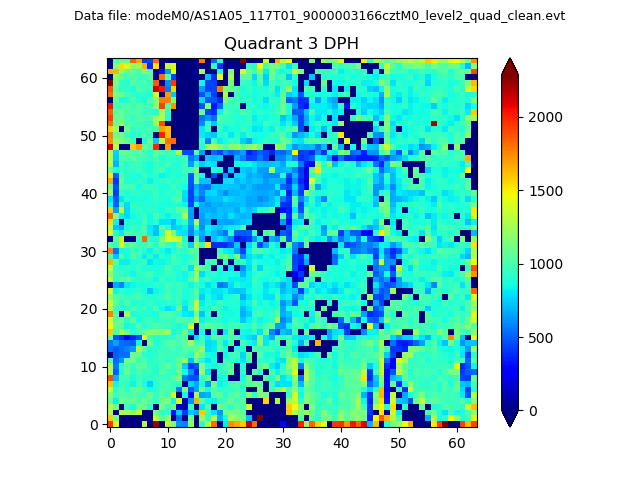 |
 |
Quadrant C |
| Plot type | Count rate plots | Images |
|---|---|---|
| Comparison with Poisson distribution Blue bars denote a histogram of data divided into 1 sec bins. Red curve is a Poisson curve with rate = median count rate of data. |
 |
 |
| Quadrant-wise count rates Data is divided into 100 sec bins |
 |
|
| Module-wise count rates for Quadrant A Data is divided into 100 sec bins |
 |
 |
| Module-wise count rates for Quadrant B Data is divided into 100 sec bins |
 |
 |
| Module-wise count rates for Quadrant C Data is divided into 100 sec bins |
 |
 |
| Module-wise count rates for Quadrant D Data is divided into 100 sec bins |
 |
 |
| Parameter | Plot |
|---|---|
| CZT HV Monitor |  |
| D_VDD |  |
| Temperature 1 |  |
| Veto HV Monitor |  |
| Veto LLD | 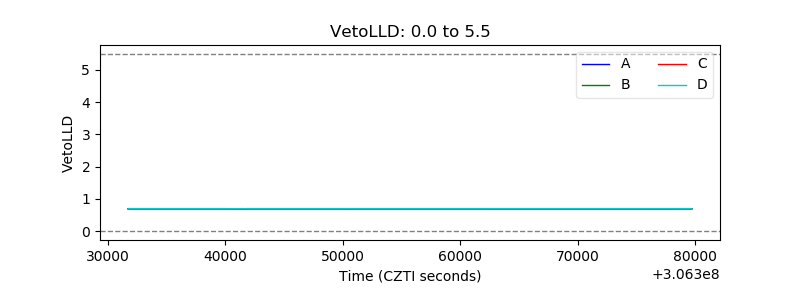 |
| Alpha Counter |  |
| _CPM_Rate |  |
| CZT Counter | 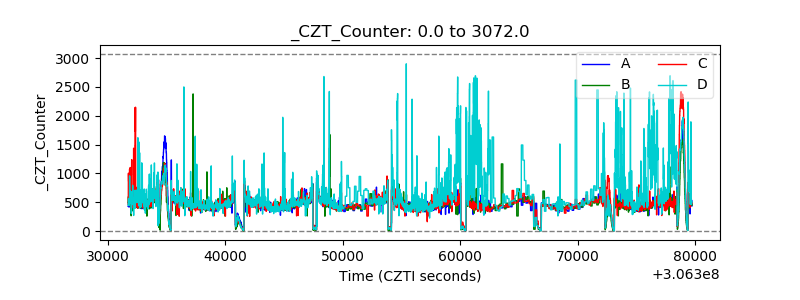 |
| +2.5 Volts monitor |  |
| +5 Volts monitor |  |
| _ROLL_ROT |  |
| _Roll_DEC |  |
| _Roll_RA |  |
| Veto Counter |  |