| Param | Original file | Final file |
|---|---|---|
| Filename | modeM0/AS1A05_117T01_9000003166_21454cztM0_level2.evt | modeM0/AS1A05_117T01_9000003166_21454cztM0_level2_quad_clean.evt |
| Size (bytes) | 428,137,920 | 94,034,880 |
| Size | 408.3 MB | 89.7 MB |
| Events in quadrant A | 3,064,481 | 608,793 |
| Events in quadrant B | 3,097,928 | 616,004 |
| Events in quadrant C | 3,050,569 | 593,843 |
| Events in quadrant D | 3,323,019 | 587,901 |
| Mode SS | |||
|---|---|---|---|
| Quadrant | BADHDUFLAG | Total packets | Discarded packets |
| A | 0 | 128 | 0 |
| B | 0 | 128 | 0 |
| C | 0 | 128 | 0 |
| D | 0 | 128 | 0 |
| Mode M9 | |||
|---|---|---|---|
| Quadrant | BADHDUFLAG | Total packets | Discarded packets |
| A | 0 | 7 | 0 |
| B | 0 | 7 | 0 |
| C | 0 | 7 | 0 |
| D | 0 | 7 | 0 |
| Mode M0 | |||
|---|---|---|---|
| Quadrant | BADHDUFLAG | Total packets | Discarded packets |
| A | 0 | 13028 | 1 |
| B | 0 | 13075 | 1 |
| C | 0 | 13084 | 1 |
| D | 0 | 13998 | 1 |
| Quadrant | Total seconds | Saturated seconds | Saturation percentage |
|---|---|---|---|
| A | 6324 | 111 | 1.755218% |
| B | 6325 | 129 | 2.039526% |
| C | 6325 | 121 | 1.913043% |
| D | 6325 | 115 | 1.818182% |
Noise dominated data is calculated using 1-second bins in cleaned event files. If a bin has >2000 counts, and if more than 50% of those come from <1% of pixels, then it is considered to be noise-dominated and hence unusable.
| Quadrant | # 1 sec bins | Bins with >0 counts | Bins with >2000 counts | High rate bins dominated by noise | Noise dominated (total time) | Noise dominated (detector-on time) | Marked lightcurve |
|---|---|---|---|---|---|---|---|
| A | 7059 | 6324 | 0 | 0 | 0.00% | 0.00% | 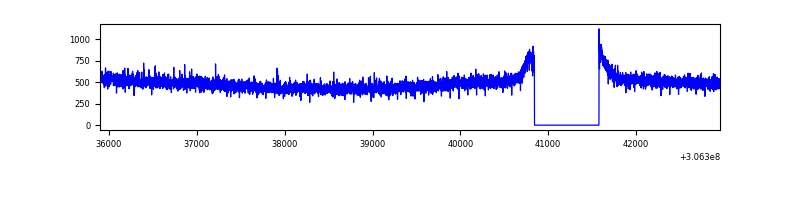 |
| B | 7060 | 6325 | 1 | 1 | 0.01% | 0.02% | 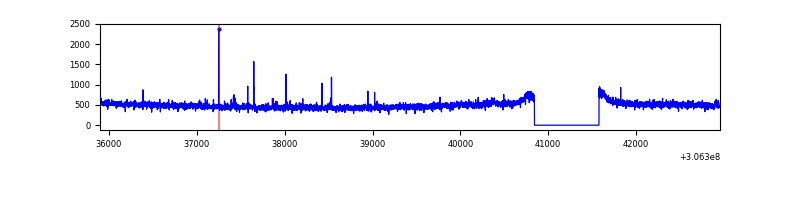 |
| C | 7060 | 6325 | 0 | 0 | 0.00% | 0.00% | 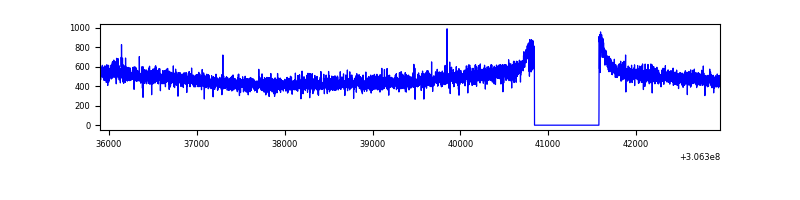 |
| D | 7060 | 6325 | 20 | 20 | 0.28% | 0.32% | 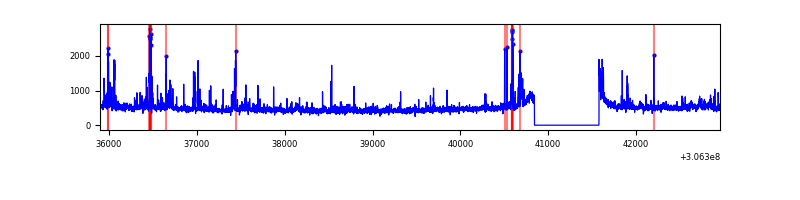 |
Top three noisy pixels from each quadrant. If the there are fewer than three noisy pixels in the level2.evt file, extra rows are filled as -1
| Pixel properties | Quadrant properties | ||||||
|---|---|---|---|---|---|---|---|
| Quadrant | DetID | PixID | Counts | Sigma | Mean | Median | Sigma |
| A | 11 | 47 | 26977 | 165.43 | 788 | 772 | 158.4 |
| A | 13 | 254 | 9749 | 56.67 | 788 | 772 | 158.4 |
| A | 0 | 226 | 6908 | 38.74 | 788 | 772 | 158.4 |
| B | 12 | 111 | 18468 | 117.89 | 783 | 766 | 150.2 |
| B | 0 | 197 | 17673 | 112.59 | 783 | 766 | 150.2 |
| B | 11 | 111 | 16311 | 103.52 | 783 | 766 | 150.2 |
| C | 14 | 238 | 119675 | 678.88 | 750 | 755 | 175.2 |
| C | 3 | 233 | 8415 | 43.73 | 750 | 755 | 175.2 |
| C | 13 | 61 | 5126 | 24.95 | 750 | 755 | 175.2 |
| D | 12 | 235 | 122605 | 654.4 | 766 | 744 | 186.2 |
| D | 14 | 34 | 90617 | 482.62 | 766 | 744 | 186.2 |
| D | 14 | 35 | 84665 | 450.66 | 766 | 744 | 186.2 |
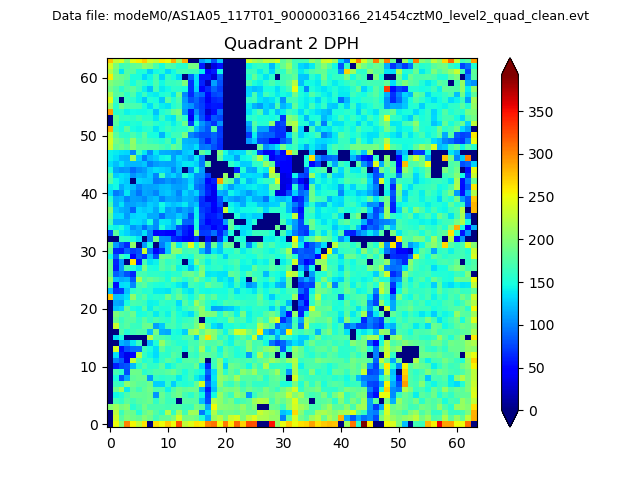
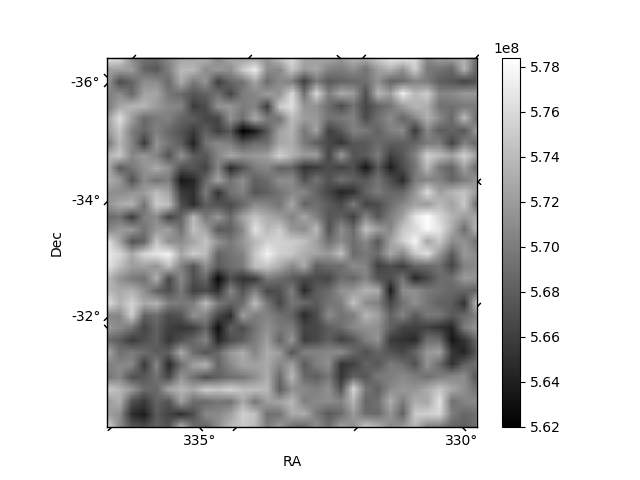
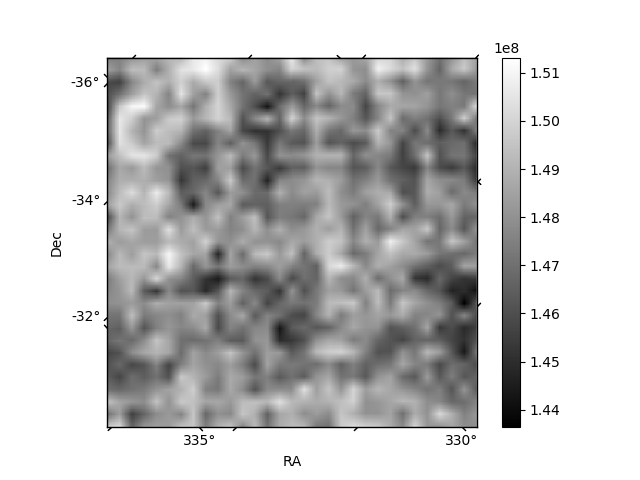
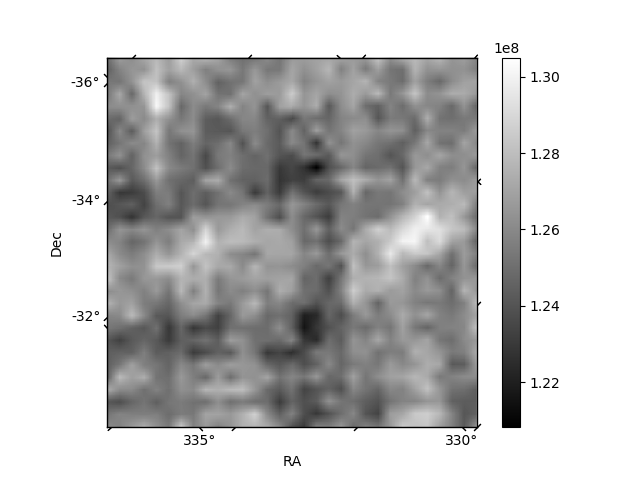
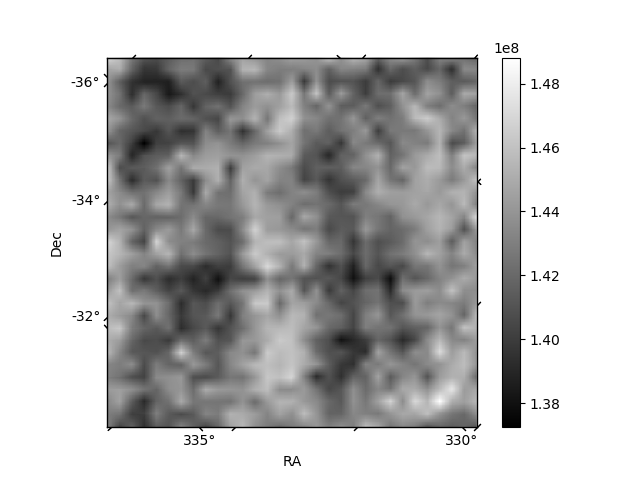
Histogram calculated using DETX and DETY for each event in the final _common_clean file
| Quadrant A | 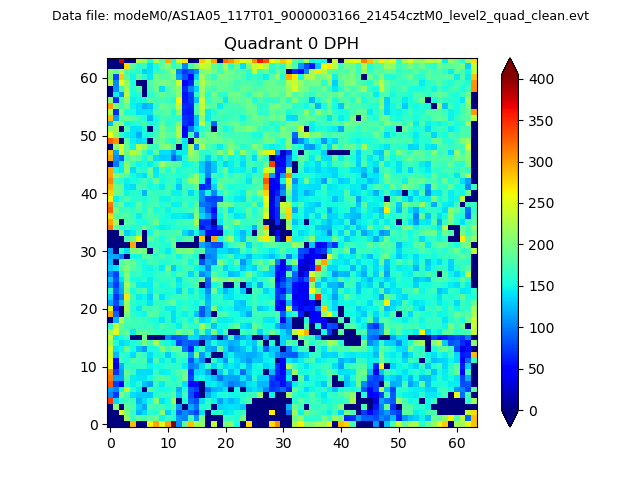 |
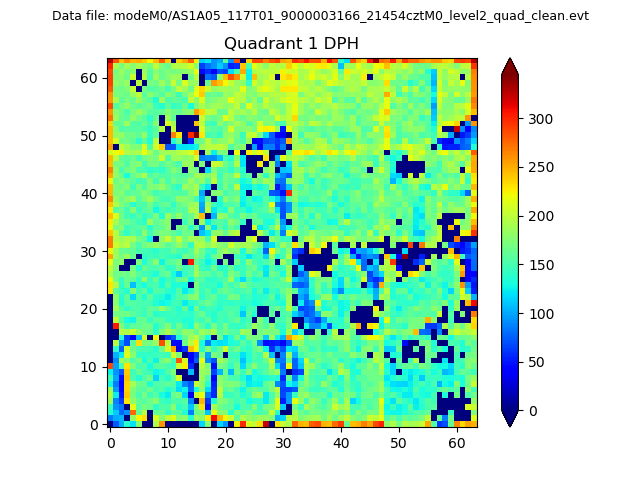 |
Quadrant B |
|---|---|---|---|
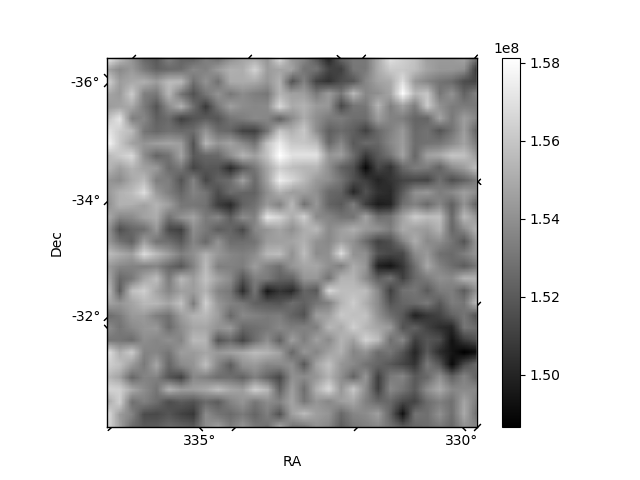
| Quadrant D | 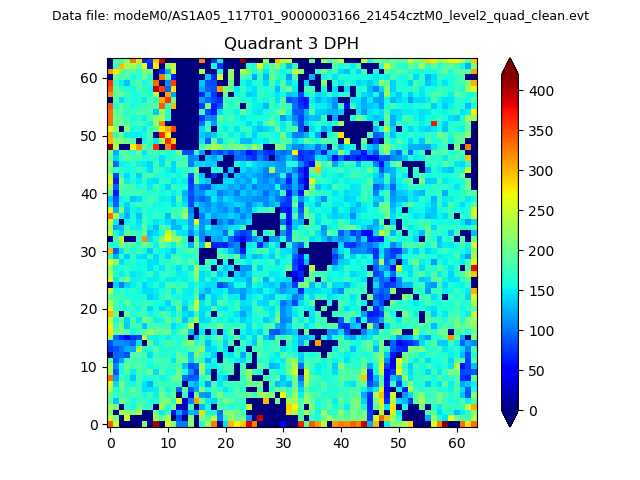 |
 |
Quadrant C |
| Plot type | Count rate plots | Images |
|---|---|---|
| Comparison with Poisson distribution Blue bars denote a histogram of data divided into 1 sec bins. Red curve is a Poisson curve with rate = median count rate of data. |
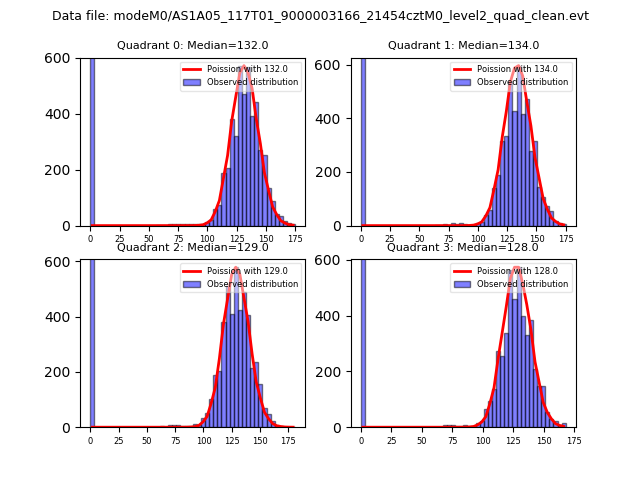 |
 |
| Quadrant-wise count rates Data is divided into 100 sec bins |
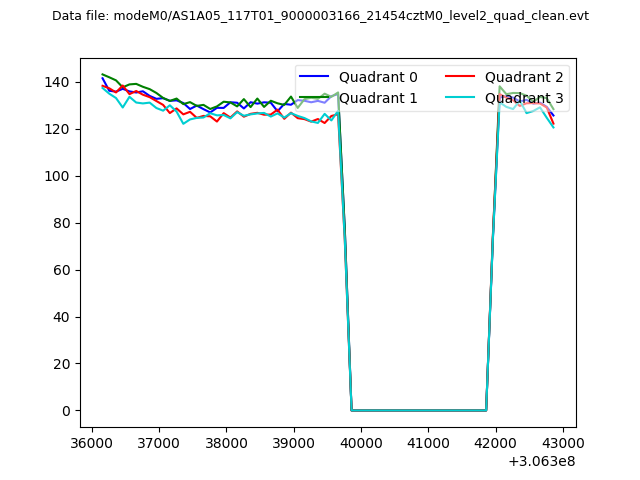 |
|
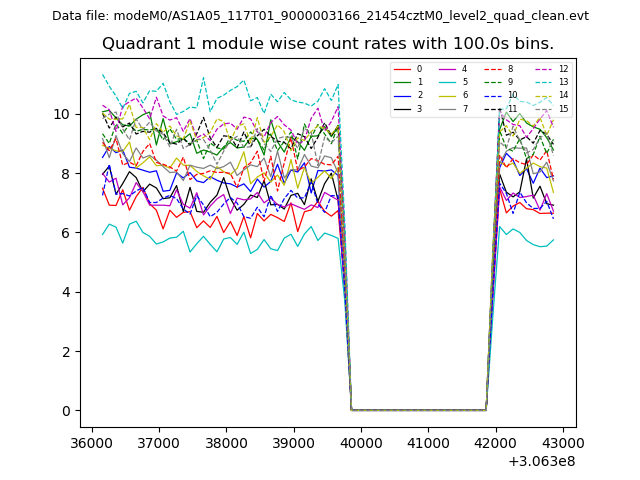
| Module-wise count rates for Quadrant A Data is divided into 100 sec bins |
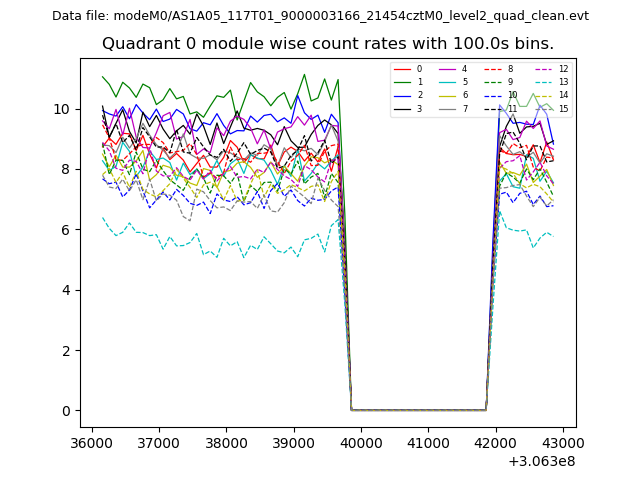 |
 |
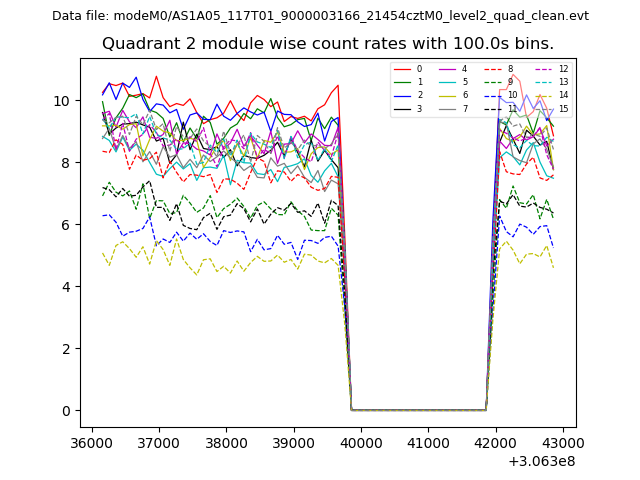
| Module-wise count rates for Quadrant B Data is divided into 100 sec bins |
 |
 |
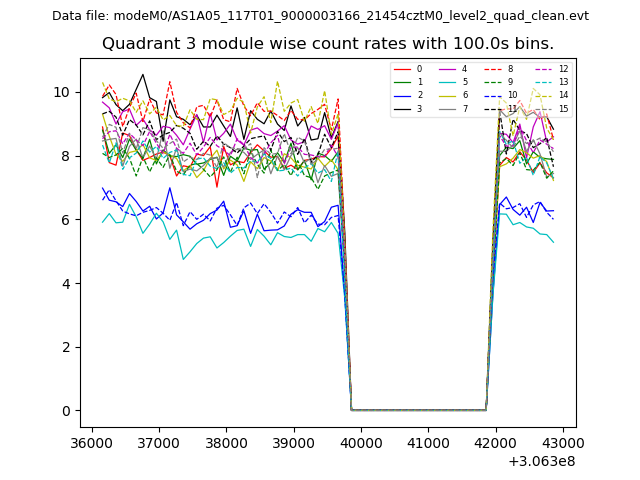
| Module-wise count rates for Quadrant C Data is divided into 100 sec bins |
 |
 |
| Module-wise count rates for Quadrant D Data is divided into 100 sec bins |
 |
 |
| Parameter | Plot |
|---|---|
| CZT HV Monitor | 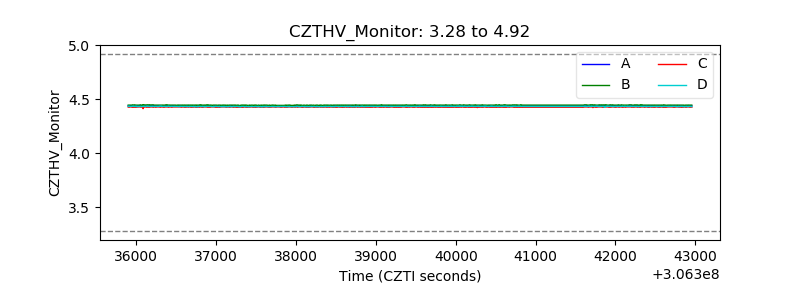 |
| D_VDD | 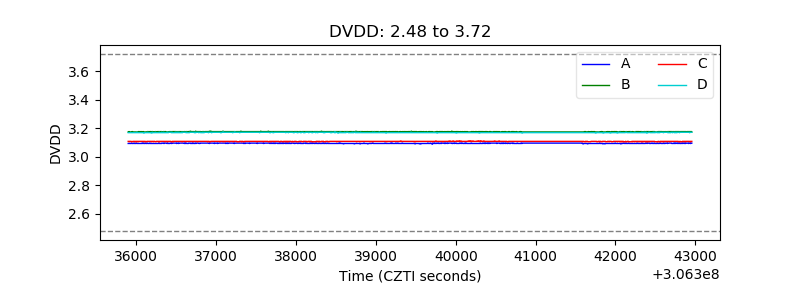 |
| Temperature 1 | 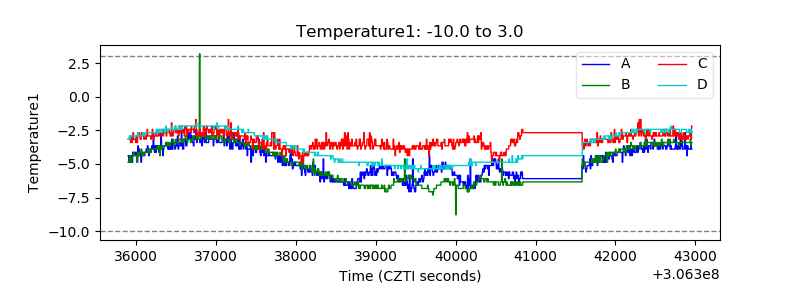 |
| Veto HV Monitor | 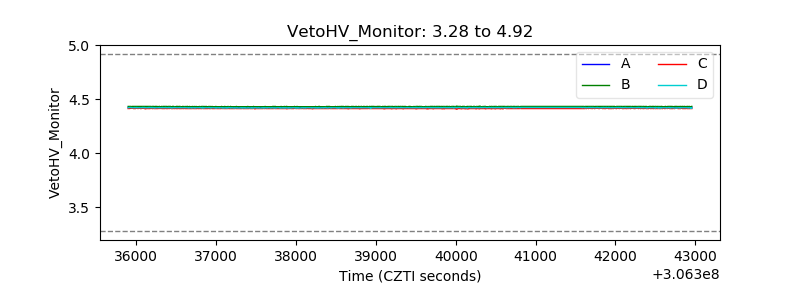 |
| Veto LLD | 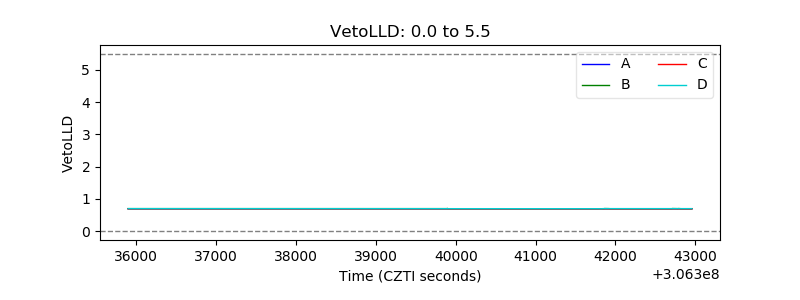 |
| Alpha Counter |  |
| _CPM_Rate | 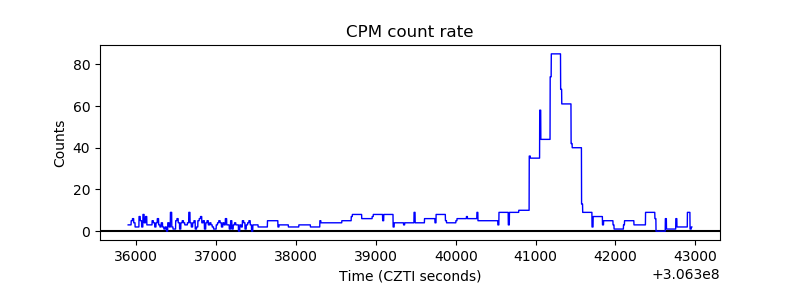 |
| CZT Counter | 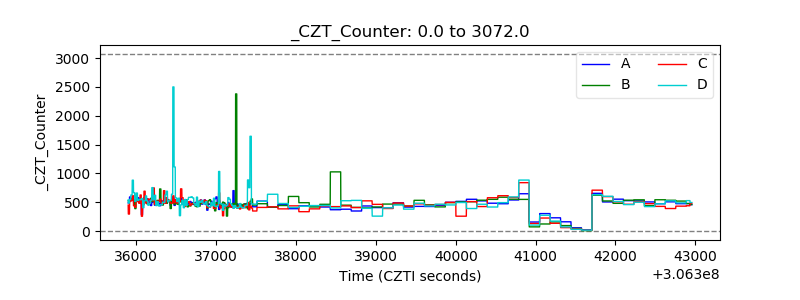 |
| +2.5 Volts monitor |  |
| +5 Volts monitor | 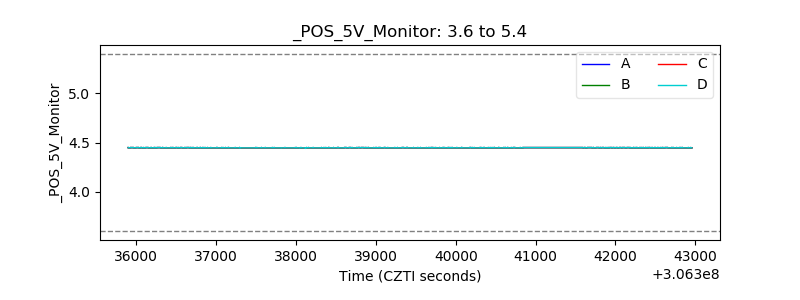 |
| _ROLL_ROT | 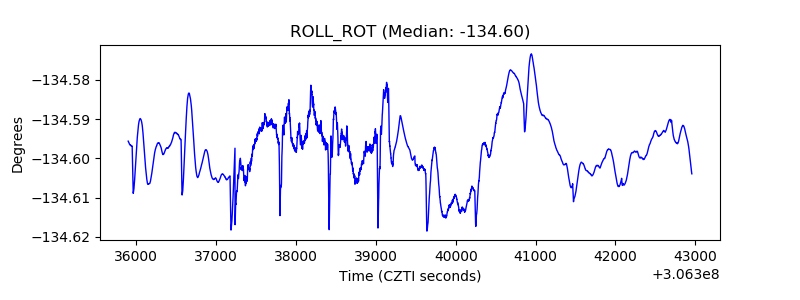 |
| _Roll_DEC | 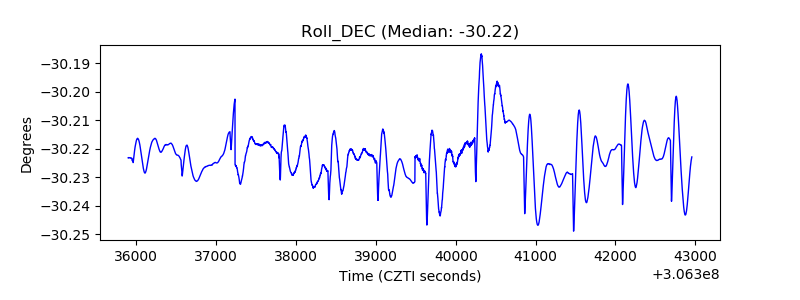 |
| _Roll_RA | 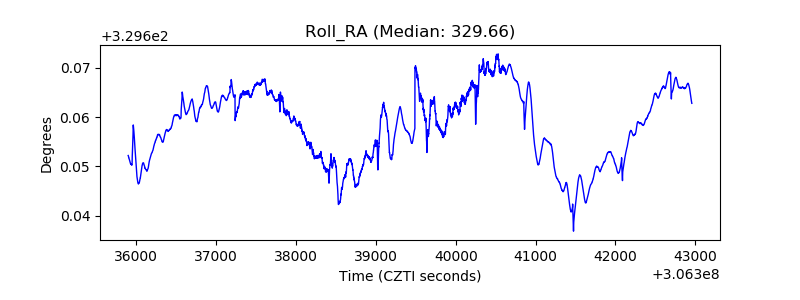 |
| Veto Counter | 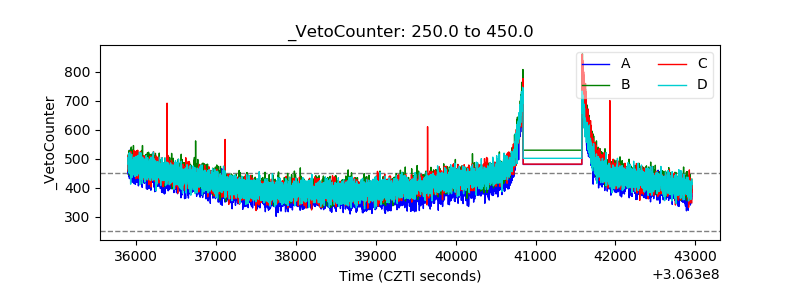 |