| Param | Original file | Final file |
|---|---|---|
| Filename | modeM0/AS1A05_117T01_9000003166_21455cztM0_level2.evt | modeM0/AS1A05_117T01_9000003166_21455cztM0_level2_quad_clean.evt |
| Size (bytes) | 477,253,440 | 103,006,080 |
| Size | 455.1 MB | 98.2 MB |
| Events in quadrant A | 3,378,770 | 665,041 |
| Events in quadrant B | 3,447,035 | 671,719 |
| Events in quadrant C | 3,375,566 | 648,653 |
| Events in quadrant D | 3,771,256 | 641,338 |
| Mode SS | |||
|---|---|---|---|
| Quadrant | BADHDUFLAG | Total packets | Discarded packets |
| A | 0 | 144 | 0 |
| B | 0 | 144 | 0 |
| C | 0 | 144 | 0 |
| D | 0 | 144 | 0 |
| Mode M9 | |||
|---|---|---|---|
| Quadrant | BADHDUFLAG | Total packets | Discarded packets |
| A | 0 | 3 | 0 |
| B | 0 | 3 | 0 |
| C | 0 | 3 | 0 |
| D | 0 | 3 | 0 |
| Mode M0 | |||
|---|---|---|---|
| Quadrant | BADHDUFLAG | Total packets | Discarded packets |
| A | 0 | 14604 | 2 |
| B | 0 | 14743 | 2 |
| C | 0 | 14644 | 2 |
| D | 0 | 15936 | 2 |
| Quadrant | Total seconds | Saturated seconds | Saturation percentage |
|---|---|---|---|
| A | 7075 | 96 | 1.356890% |
| B | 7076 | 124 | 1.752402% |
| C | 7076 | 117 | 1.653477% |
| D | 7076 | 87 | 1.229508% |
Noise dominated data is calculated using 1-second bins in cleaned event files. If a bin has >2000 counts, and if more than 50% of those come from <1% of pixels, then it is considered to be noise-dominated and hence unusable.
| Quadrant | # 1 sec bins | Bins with >0 counts | Bins with >2000 counts | High rate bins dominated by noise | Noise dominated (total time) | Noise dominated (detector-on time) | Marked lightcurve |
|---|---|---|---|---|---|---|---|
| A | 7415 | 7076 | 0 | 0 | 0.00% | 0.00% | 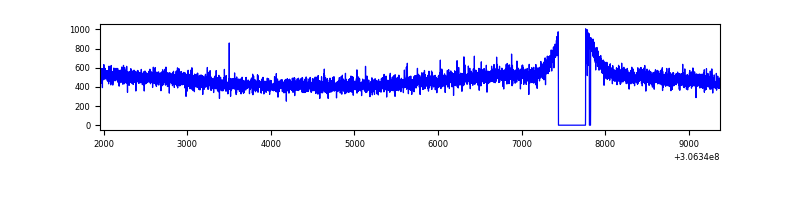 |
| B | 7416 | 7076 | 7 | 7 | 0.09% | 0.10% | 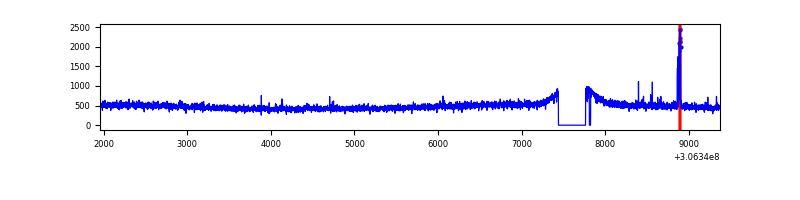 |
| C | 7416 | 7077 | 0 | 0 | 0.00% | 0.00% | 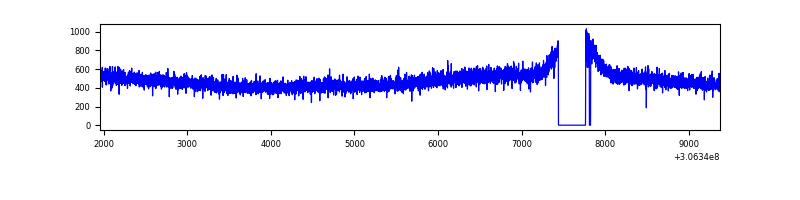 |
| D | 7416 | 7077 | 34 | 34 | 0.46% | 0.48% | 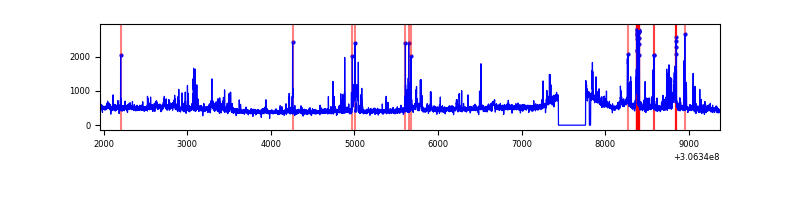 |
Top three noisy pixels from each quadrant. If the there are fewer than three noisy pixels in the level2.evt file, extra rows are filled as -1
| Pixel properties | Quadrant properties | ||||||
|---|---|---|---|---|---|---|---|
| Quadrant | DetID | PixID | Counts | Sigma | Mean | Median | Sigma |
| A | 13 | 254 | 11091 | 58.35 | 874 | 856 | 175.4 |
| A | 11 | 47 | 9759 | 50.75 | 874 | 856 | 175.4 |
| A | 3 | 137 | 7811 | 39.65 | 874 | 856 | 175.4 |
| B | 0 | 197 | 53446 | 313.77 | 866 | 845 | 167.6 |
| B | 12 | 111 | 20488 | 117.17 | 866 | 845 | 167.6 |
| B | 11 | 111 | 18488 | 105.24 | 866 | 845 | 167.6 |
| C | 14 | 238 | 131374 | 669.89 | 830 | 838 | 194.9 |
| C | 13 | 61 | 5770 | 25.31 | 830 | 838 | 194.9 |
| C | 8 | 128 | 5269 | 22.74 | 830 | 838 | 194.9 |
| D | 12 | 235 | 141239 | 684.58 | 846 | 822 | 205.1 |
| D | 14 | 34 | 130202 | 630.77 | 846 | 822 | 205.1 |
| D | 1 | 20 | 78077 | 376.65 | 846 | 822 | 205.1 |
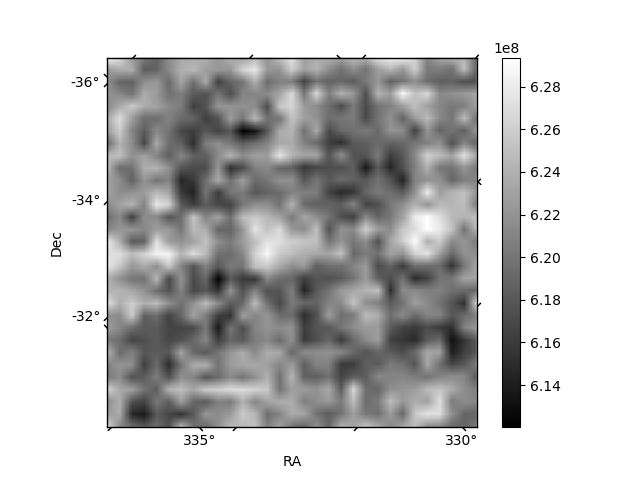
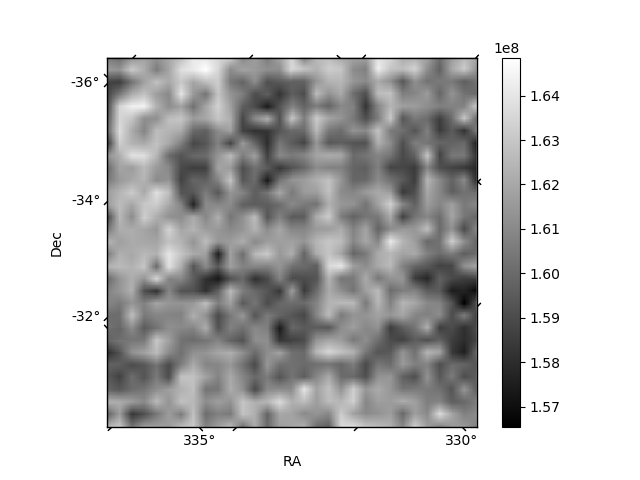
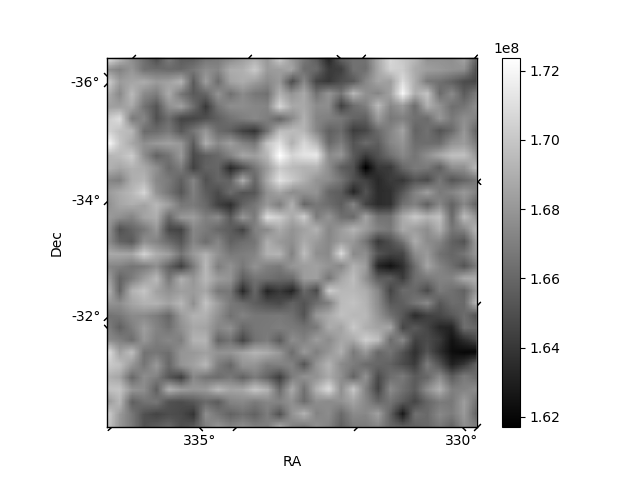
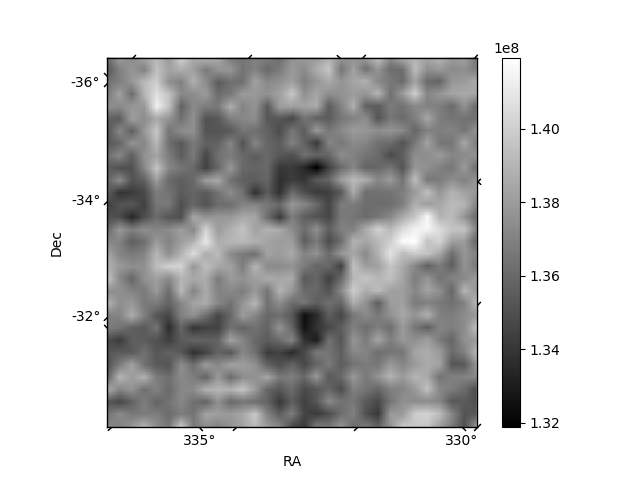
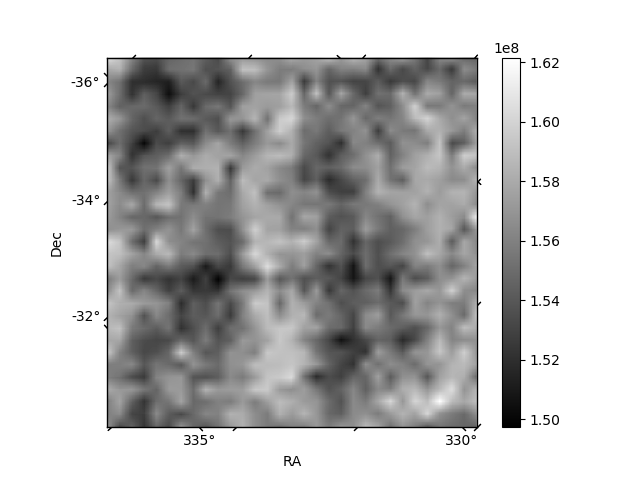
Histogram calculated using DETX and DETY for each event in the final _common_clean file
| Quadrant A | 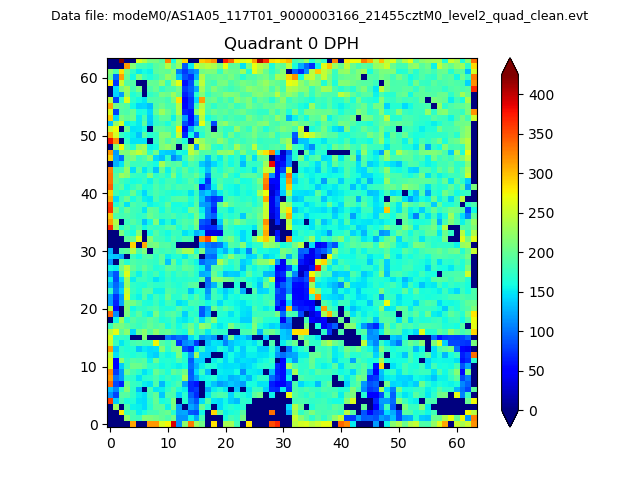 |
 |
Quadrant B |
|---|---|---|---|
| Quadrant D | 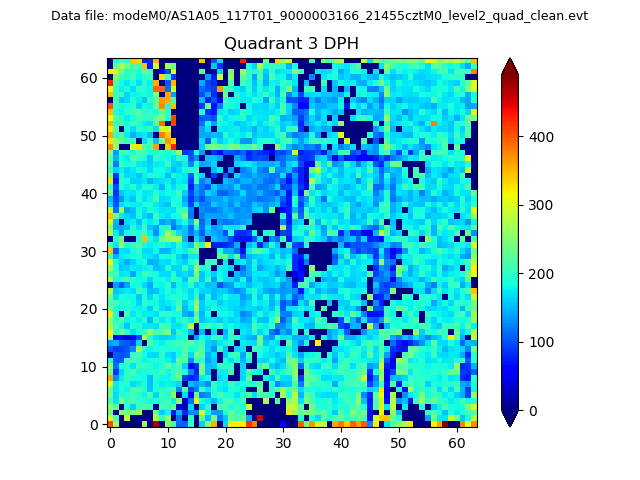 |
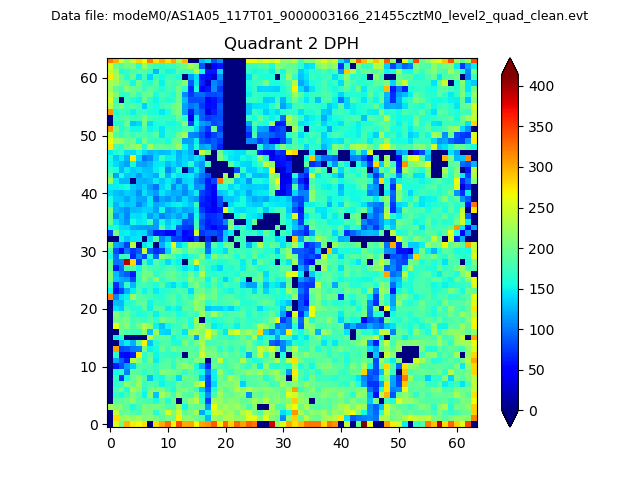 |
Quadrant C |
| Plot type | Count rate plots | Images |
|---|---|---|
| Comparison with Poisson distribution Blue bars denote a histogram of data divided into 1 sec bins. Red curve is a Poisson curve with rate = median count rate of data. |
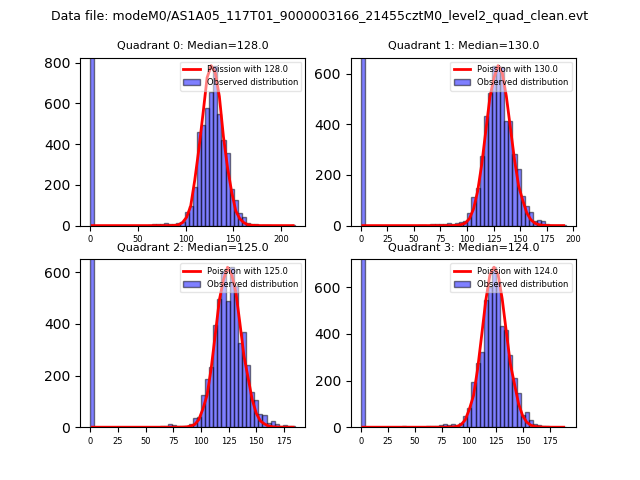 |
 |
| Quadrant-wise count rates Data is divided into 100 sec bins |
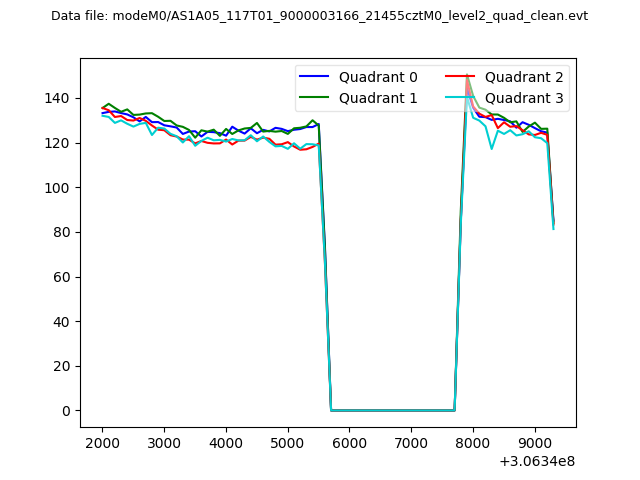 |
|
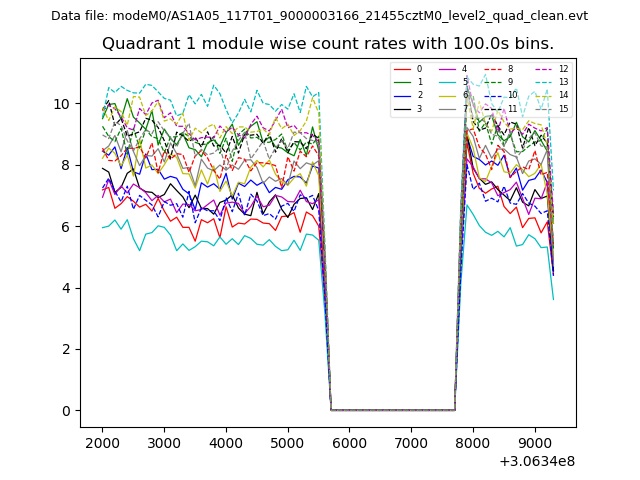
| Module-wise count rates for Quadrant A Data is divided into 100 sec bins |
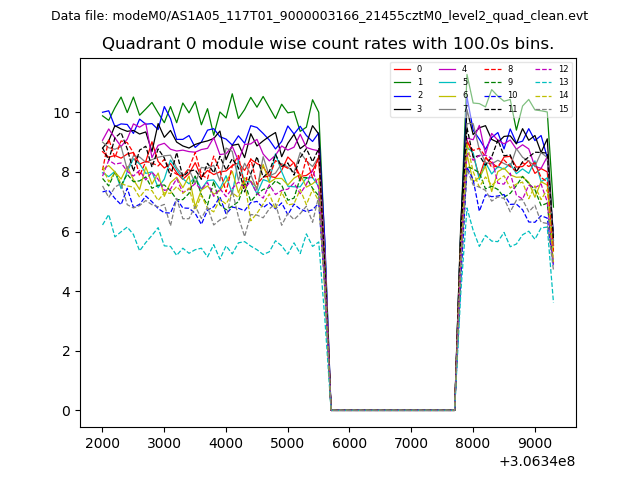 |
 |
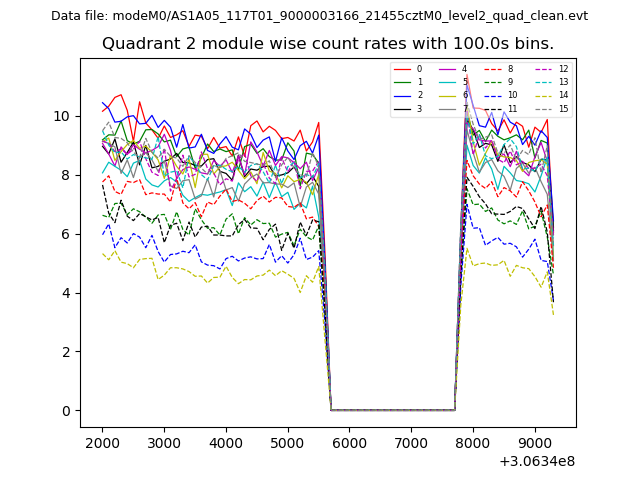
| Module-wise count rates for Quadrant B Data is divided into 100 sec bins |
 |
 |
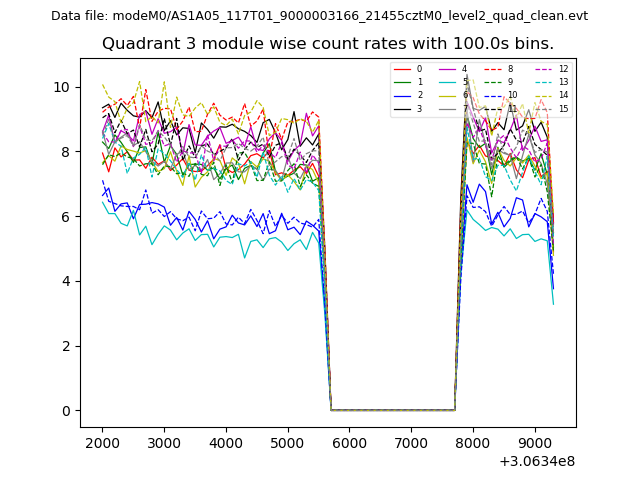
| Module-wise count rates for Quadrant C Data is divided into 100 sec bins |
 |
 |
| Module-wise count rates for Quadrant D Data is divided into 100 sec bins |
 |
 |
| Parameter | Plot |
|---|---|
| CZT HV Monitor | 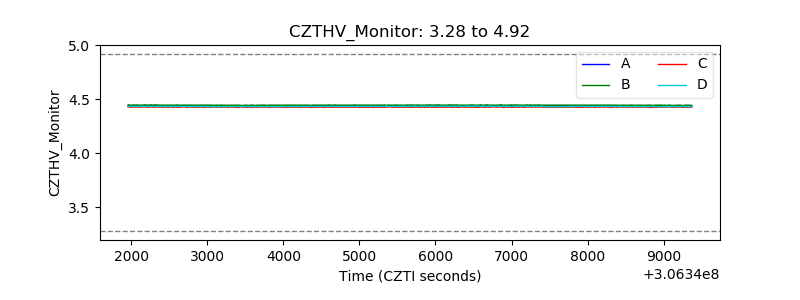 |
| D_VDD | 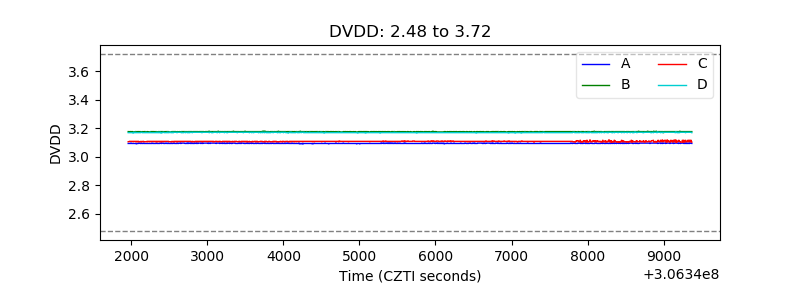 |
| Temperature 1 | 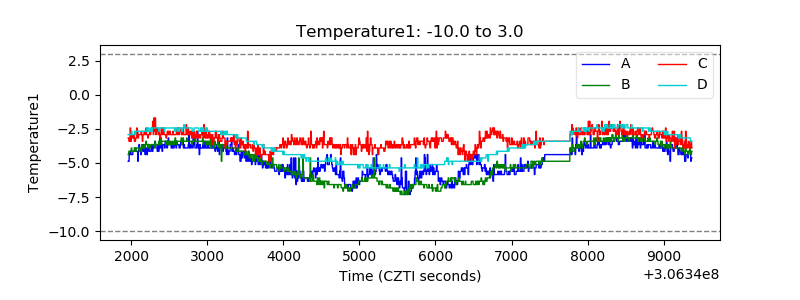 |
| Veto HV Monitor | 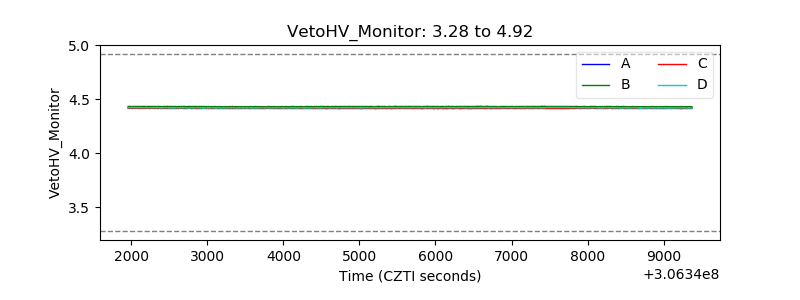 |
| Veto LLD | 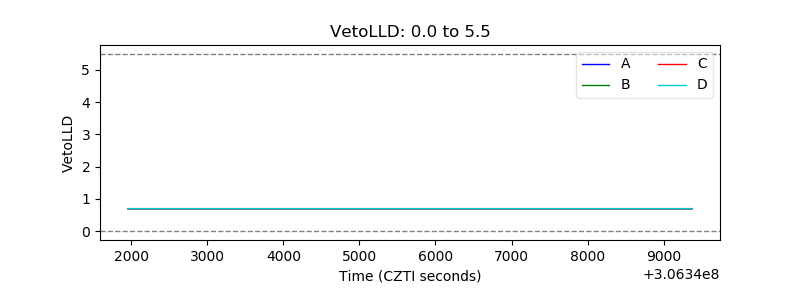 |
| Alpha Counter |  |
| _CPM_Rate | 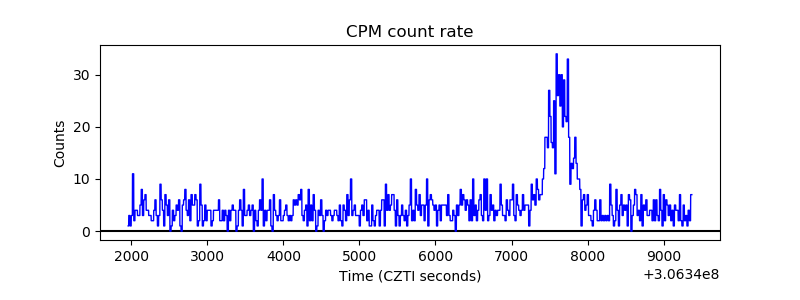 |
| CZT Counter | 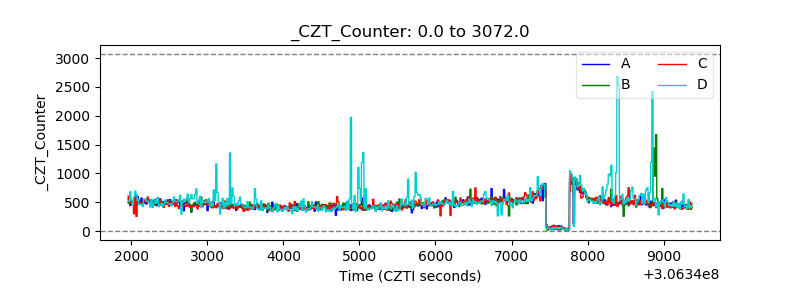 |
| +2.5 Volts monitor |  |
| +5 Volts monitor | 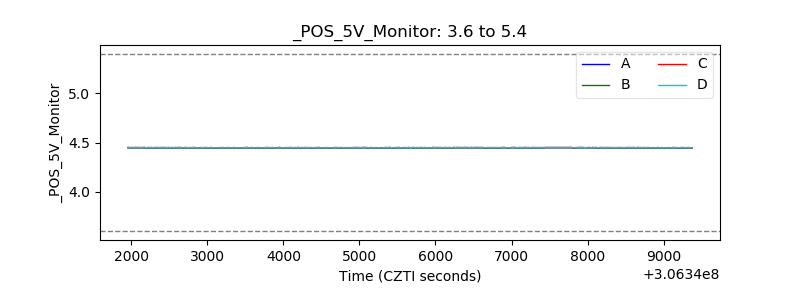 |
| _ROLL_ROT | 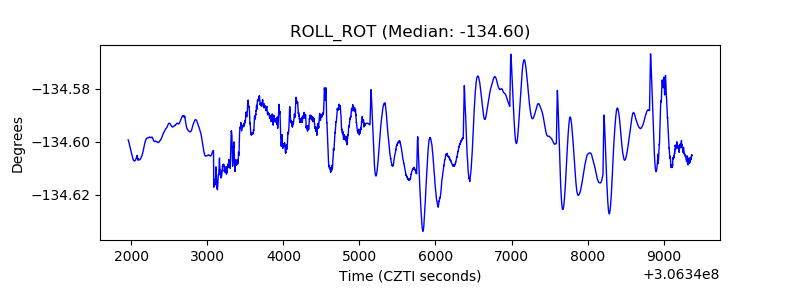 |
| _Roll_DEC | 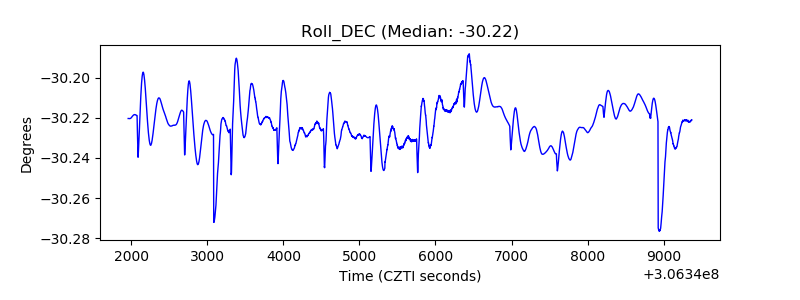 |
| _Roll_RA | 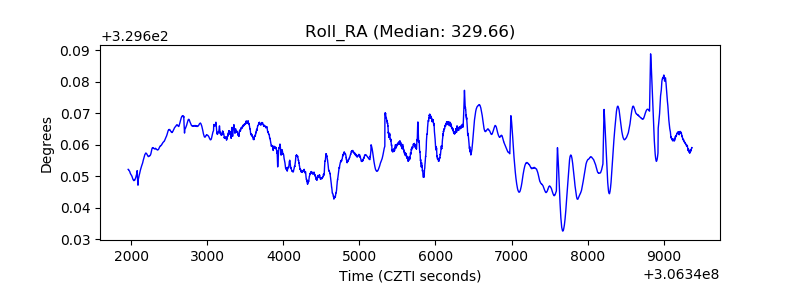 |
| Veto Counter | 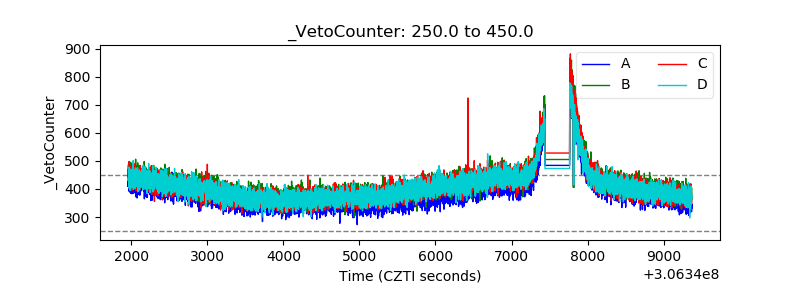 |