| Param | Original file | Final file |
|---|---|---|
| Filename | modeM0/AS1A05_117T01_9000003166_21459cztM0_level2.evt | modeM0/AS1A05_117T01_9000003166_21459cztM0_level2_quad_clean.evt |
| Size (bytes) | 945,616,320 | 165,827,520 |
| Size | 901.8 MB | 158.1 MB |
| Events in quadrant A | 6,079,663 | 1,058,784 |
| Events in quadrant B | 6,024,795 | 1,070,677 |
| Events in quadrant C | 5,916,555 | 1,029,341 |
| Events in quadrant D | 9,752,502 | 979,936 |
| Mode SS | |||
|---|---|---|---|
| Quadrant | BADHDUFLAG | Total packets | Discarded packets |
| A | 0 | 264 | 0 |
| B | 0 | 264 | 0 |
| C | 0 | 264 | 0 |
| D | 0 | 264 | 0 |
| Mode M9 | |||
|---|---|---|---|
| Quadrant | BADHDUFLAG | Total packets | Discarded packets |
| A | 0 | 18 | 0 |
| B | 0 | 18 | 0 |
| C | 0 | 18 | 0 |
| D | 0 | 18 | 0 |
| Mode M0 | |||
|---|---|---|---|
| Quadrant | BADHDUFLAG | Total packets | Discarded packets |
| A | 0 | 26512 | 3 |
| B | 0 | 26275 | 3 |
| C | 0 | 26010 | 3 |
| D | 0 | 37754 | 5 |
| Quadrant | Total seconds | Saturated seconds | Saturation percentage |
|---|---|---|---|
| A | 12776 | 50 | 0.391359% |
| B | 12776 | 90 | 0.704446% |
| C | 12777 | 111 | 0.868749% |
| D | 12776 | 593 | 4.641515% |
Noise dominated data is calculated using 1-second bins in cleaned event files. If a bin has >2000 counts, and if more than 50% of those come from <1% of pixels, then it is considered to be noise-dominated and hence unusable.
| Quadrant | # 1 sec bins | Bins with >0 counts | Bins with >2000 counts | High rate bins dominated by noise | Noise dominated (total time) | Noise dominated (detector-on time) | Marked lightcurve |
|---|---|---|---|---|---|---|---|
| A | 14621 | 12778 | 0 | 0 | 0.00% | 0.00% | 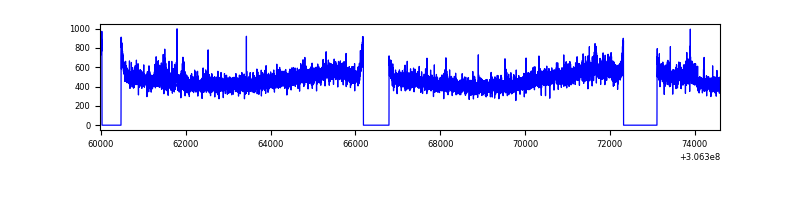 |
| B | 14621 | 12776 | 2 | 2 | 0.01% | 0.02% | 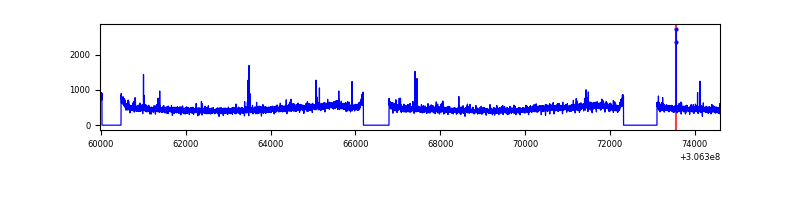 |
| C | 14622 | 12777 | 0 | 0 | 0.00% | 0.00% | 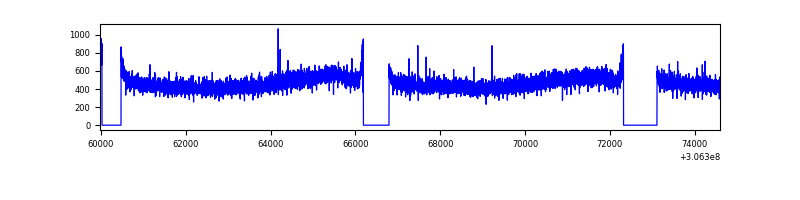 |
| D | 14621 | 12776 | 655 | 655 | 4.48% | 5.13% | 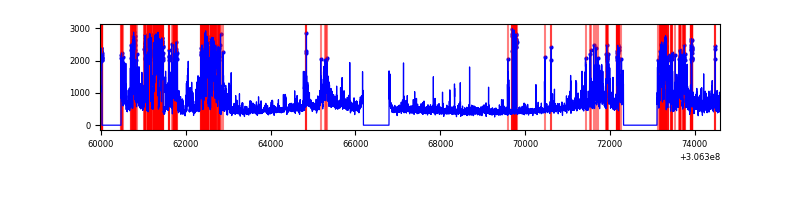 |
Top three noisy pixels from each quadrant. If the there are fewer than three noisy pixels in the level2.evt file, extra rows are filled as -1
| Pixel properties | Quadrant properties | ||||||
|---|---|---|---|---|---|---|---|
| Quadrant | DetID | PixID | Counts | Sigma | Mean | Median | Sigma |
| A | 11 | 47 | 221034 | 720.58 | 1521 | 1490 | 304.7 |
| A | 13 | 254 | 18239 | 54.97 | 1521 | 1490 | 304.7 |
| A | 3 | 137 | 13245 | 38.58 | 1521 | 1490 | 304.7 |
| B | 0 | 197 | 40785 | 135.19 | 1515 | 1475 | 290.8 |
| B | 12 | 111 | 36427 | 120.2 | 1515 | 1475 | 290.8 |
| B | 11 | 111 | 32070 | 105.22 | 1515 | 1475 | 290.8 |
| C | 14 | 238 | 228446 | 665.35 | 1459 | 1469 | 341.1 |
| C | 13 | 61 | 10141 | 25.42 | 1459 | 1469 | 341.1 |
| C | 4 | 175 | 4927 | 10.14 | 1459 | 1469 | 341.1 |
| D | 12 | 235 | 3460952 | 9748.55 | 1455 | 1413 | 354.9 |
| D | 14 | 35 | 330606 | 927.62 | 1455 | 1413 | 354.9 |
| D | 1 | 52 | 222675 | 623.49 | 1455 | 1413 | 354.9 |
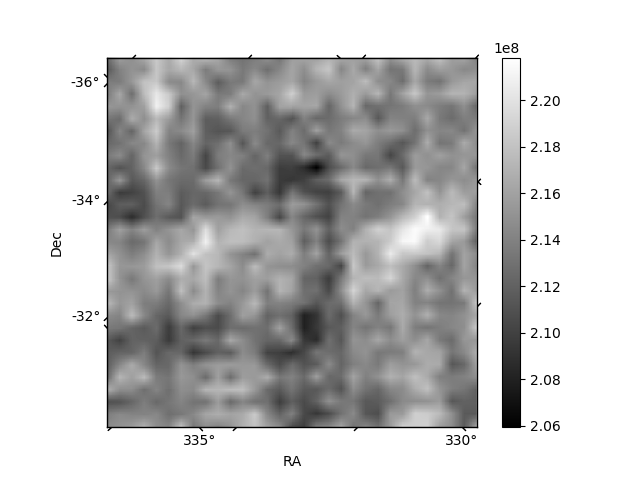
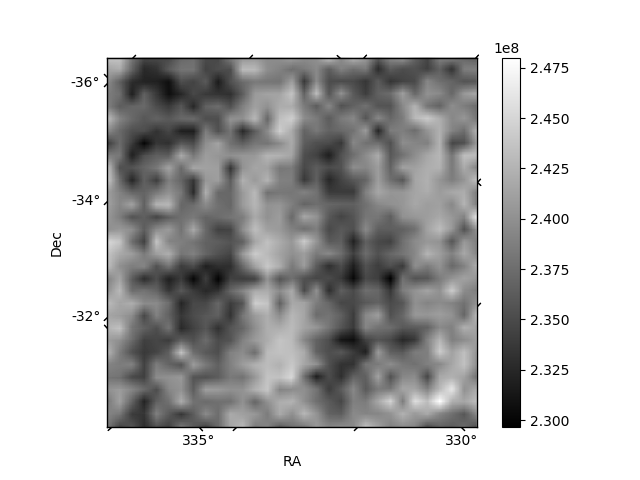
Histogram calculated using DETX and DETY for each event in the final _common_clean file
| Quadrant A |  |
 |
Quadrant B |
|---|---|---|---|
| Quadrant D |  |
 |
Quadrant C |
| Plot type | Count rate plots | Images |
|---|---|---|
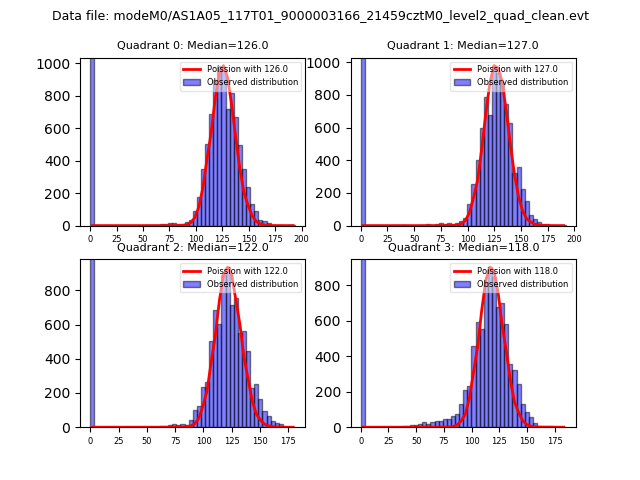
| Comparison with Poisson distribution Blue bars denote a histogram of data divided into 1 sec bins. Red curve is a Poisson curve with rate = median count rate of data. |
 |
 |
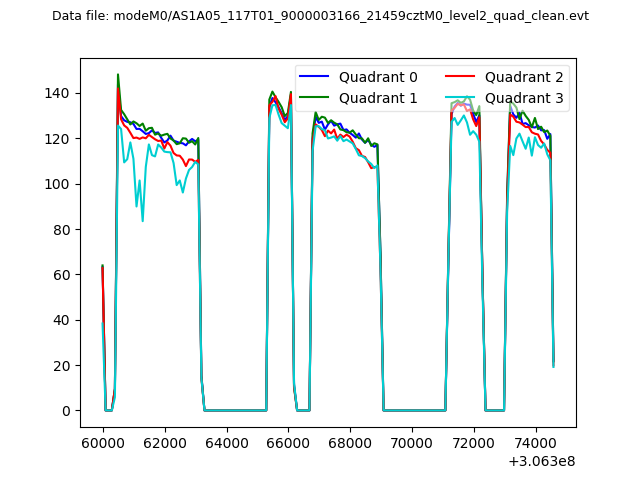
| Quadrant-wise count rates Data is divided into 100 sec bins |
 |
|
| Module-wise count rates for Quadrant A Data is divided into 100 sec bins |
 |
 |
| Module-wise count rates for Quadrant B Data is divided into 100 sec bins |
 |
 |
| Module-wise count rates for Quadrant C Data is divided into 100 sec bins |
 |
 |
| Module-wise count rates for Quadrant D Data is divided into 100 sec bins |
 |
 |
| Parameter | Plot |
|---|---|
| CZT HV Monitor |  |
| D_VDD |  |
| Temperature 1 |  |
| Veto HV Monitor |  |
| Veto LLD |  |
| Alpha Counter | 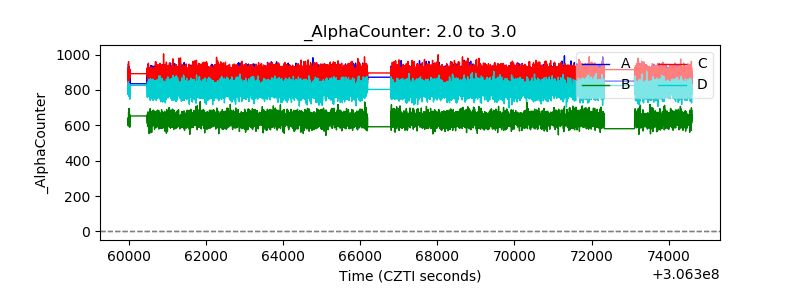 |
| _CPM_Rate | 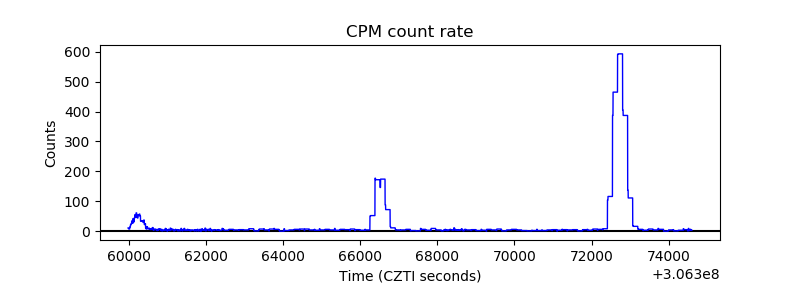 |
| CZT Counter |  |
| +2.5 Volts monitor |  |
| +5 Volts monitor |  |
| _ROLL_ROT |  |
| _Roll_DEC |  |
| _Roll_RA |  |
| Veto Counter |  |