| Param | Original file | Final file |
|---|---|---|
| Filename | modeM0/AS1A05_117T01_9000003166_21460cztM0_level2.evt | modeM0/AS1A05_117T01_9000003166_21460cztM0_level2_quad_clean.evt |
| Size (bytes) | 463,988,160 | 71,879,040 |
| Size | 442.5 MB | 68.5 MB |
| Events in quadrant A | 2,677,407 | 454,351 |
| Events in quadrant B | 2,722,890 | 462,591 |
| Events in quadrant C | 2,653,218 | 446,381 |
| Events in quadrant D | 5,612,067 | 414,998 |
| Mode SS | |||
|---|---|---|---|
| Quadrant | BADHDUFLAG | Total packets | Discarded packets |
| A | 0 | 116 | 0 |
| B | 0 | 116 | 0 |
| C | 0 | 116 | 0 |
| D | 0 | 116 | 0 |
| Mode M9 | |||
|---|---|---|---|
| Quadrant | BADHDUFLAG | Total packets | Discarded packets |
| A | 0 | 13 | 0 |
| B | 0 | 14 | 0 |
| C | 0 | 14 | 0 |
| D | 0 | 14 | 0 |
| Mode M0 | |||
|---|---|---|---|
| Quadrant | BADHDUFLAG | Total packets | Discarded packets |
| A | 0 | 11626 | 2 |
| B | 0 | 11744 | 2 |
| C | 0 | 11527 | 2 |
| D | 0 | 20660 | 2 |
| Quadrant | Total seconds | Saturated seconds | Saturation percentage |
|---|---|---|---|
| A | 5690 | 15 | 0.263620% |
| B | 5690 | 40 | 0.702988% |
| C | 5690 | 38 | 0.667838% |
| D | 5690 | 516 | 9.068541% |
Noise dominated data is calculated using 1-second bins in cleaned event files. If a bin has >2000 counts, and if more than 50% of those come from <1% of pixels, then it is considered to be noise-dominated and hence unusable.
| Quadrant | # 1 sec bins | Bins with >0 counts | Bins with >2000 counts | High rate bins dominated by noise | Noise dominated (total time) | Noise dominated (detector-on time) | Marked lightcurve |
|---|---|---|---|---|---|---|---|
| A | 6610 | 5691 | 0 | 0 | 0.00% | 0.00% | 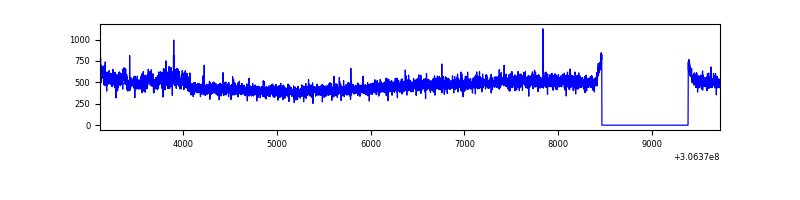 |
| B | 6610 | 5690 | 2 | 2 | 0.03% | 0.04% | 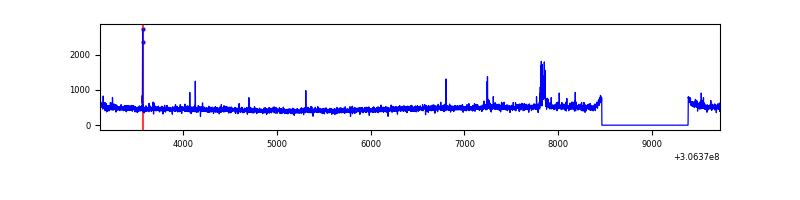 |
| C | 6610 | 5690 | 0 | 0 | 0.00% | 0.00% | 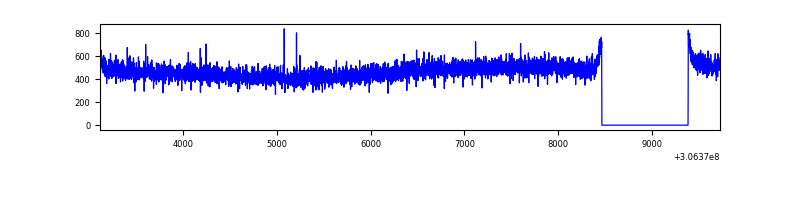 |
| D | 6610 | 5690 | 516 | 516 | 7.81% | 9.07% | 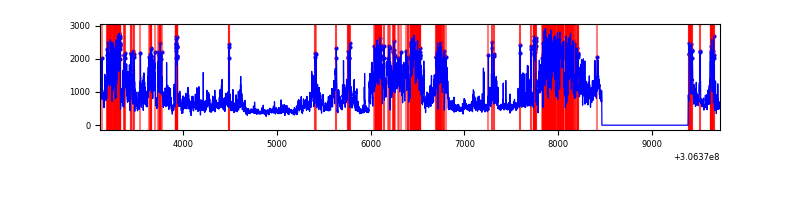 |
Top three noisy pixels from each quadrant. If the there are fewer than three noisy pixels in the level2.evt file, extra rows are filled as -1
| Pixel properties | Quadrant properties | ||||||
|---|---|---|---|---|---|---|---|
| Quadrant | DetID | PixID | Counts | Sigma | Mean | Median | Sigma |
| A | 11 | 47 | 61831 | 447.18 | 679 | 664 | 136.8 |
| A | 13 | 254 | 8488 | 57.2 | 679 | 664 | 136.8 |
| A | 3 | 137 | 5951 | 38.65 | 679 | 664 | 136.8 |
| B | 0 | 197 | 49027 | 370.81 | 676 | 656 | 130.4 |
| B | 12 | 111 | 16212 | 119.25 | 676 | 656 | 130.4 |
| B | 11 | 111 | 14339 | 104.89 | 676 | 656 | 130.4 |
| C | 14 | 238 | 103157 | 663.76 | 654 | 658 | 154.4 |
| C | 13 | 61 | 4465 | 24.65 | 654 | 658 | 154.4 |
| C | 3 | 233 | 1821 | 7.53 | 654 | 658 | 154.4 |
| D | 12 | 235 | 2910875 | 18596.62 | 644 | 626 | 156.5 |
| D | 14 | 35 | 65000 | 411.35 | 644 | 626 | 156.5 |
| D | 1 | 52 | 52390 | 330.77 | 644 | 626 | 156.5 |
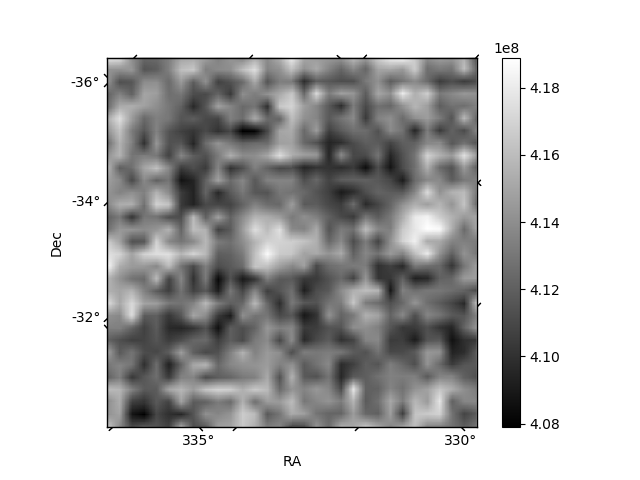
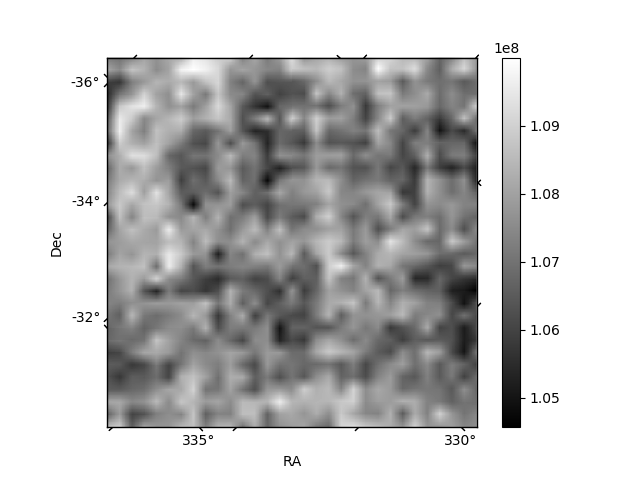
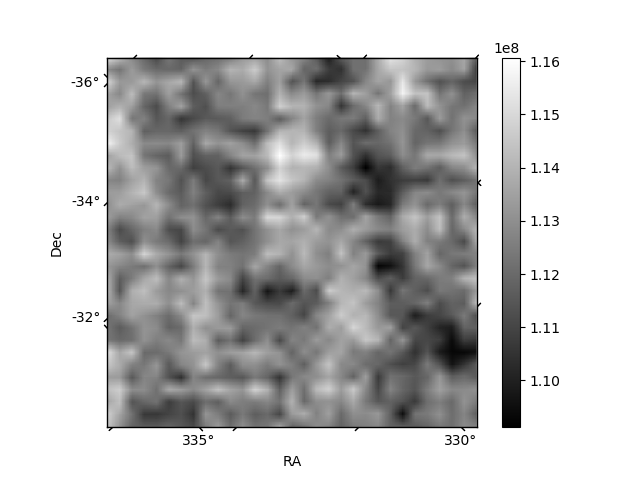
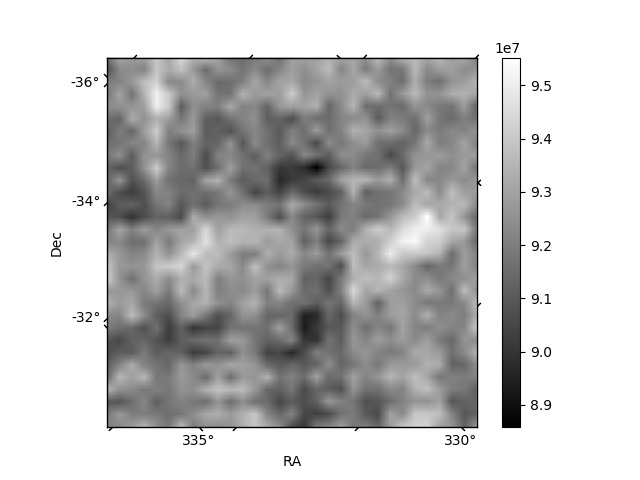
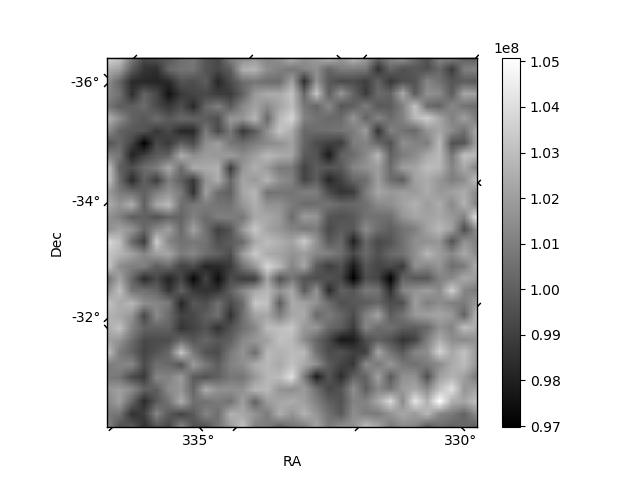
Histogram calculated using DETX and DETY for each event in the final _common_clean file
| Quadrant A | 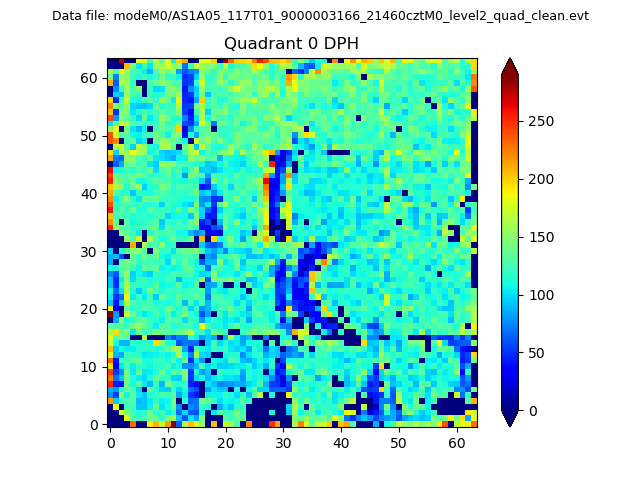 |
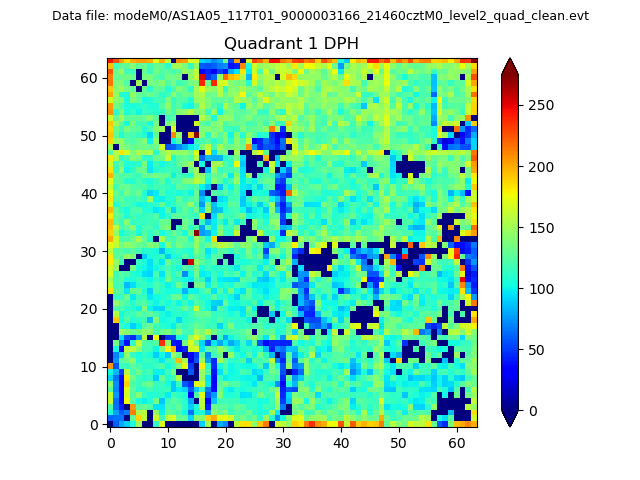 |
Quadrant B |
|---|---|---|---|
| Quadrant D | 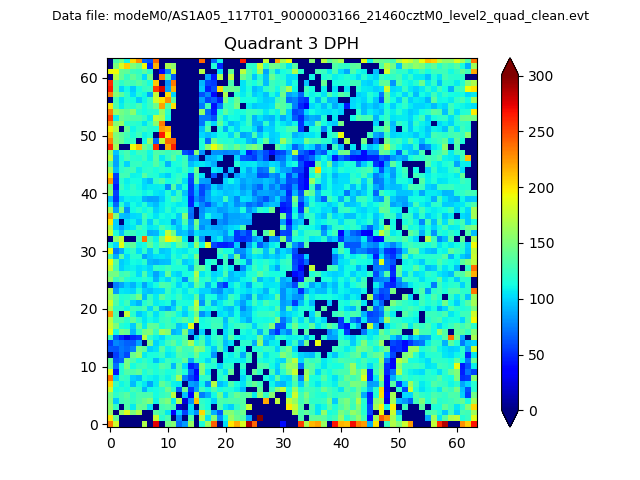 |
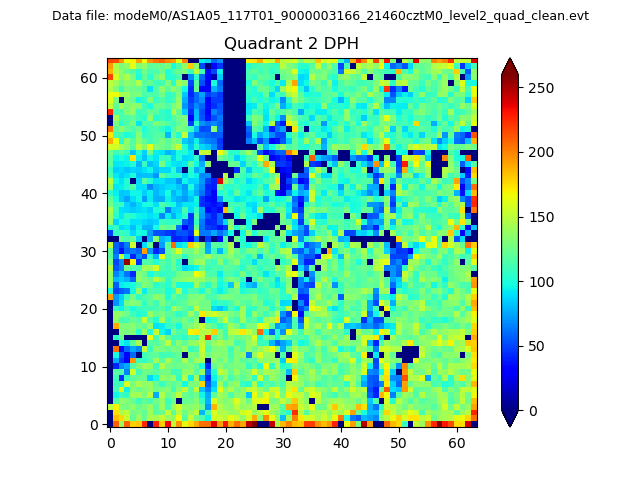 |
Quadrant C |
| Plot type | Count rate plots | Images |
|---|---|---|
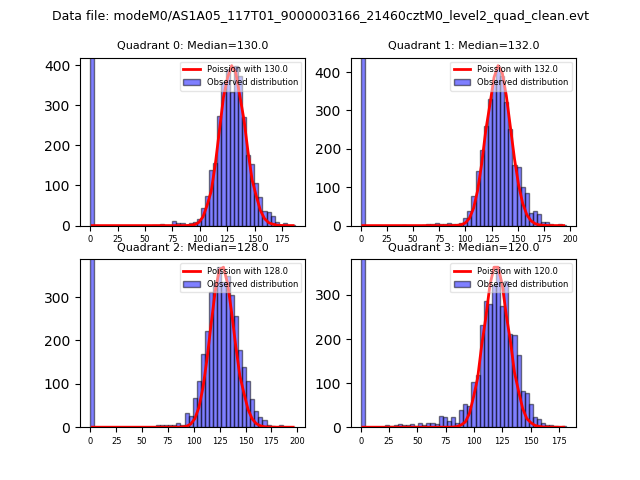
| Comparison with Poisson distribution Blue bars denote a histogram of data divided into 1 sec bins. Red curve is a Poisson curve with rate = median count rate of data. |
 |
 |
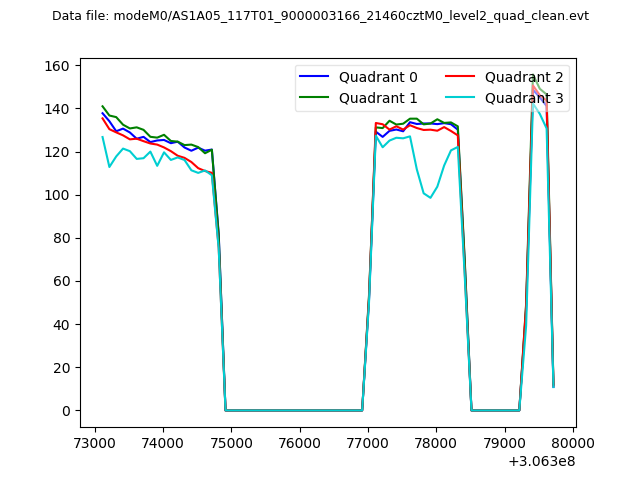
| Quadrant-wise count rates Data is divided into 100 sec bins |
 |
|
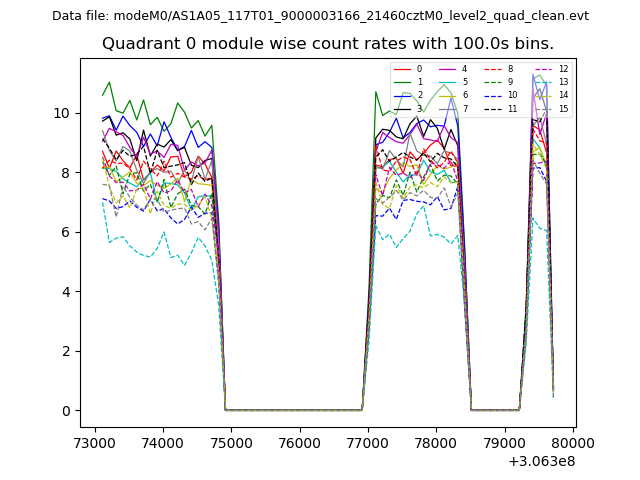
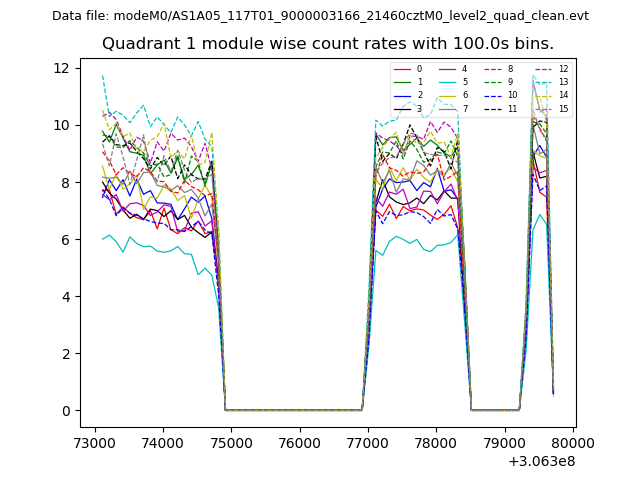
| Module-wise count rates for Quadrant A Data is divided into 100 sec bins |
 |
 |
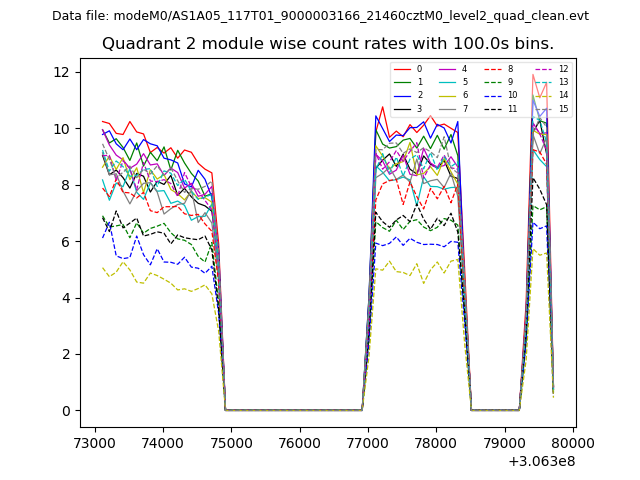
| Module-wise count rates for Quadrant B Data is divided into 100 sec bins |
 |
 |
| Module-wise count rates for Quadrant C Data is divided into 100 sec bins |
 |
 |
| Module-wise count rates for Quadrant D Data is divided into 100 sec bins |
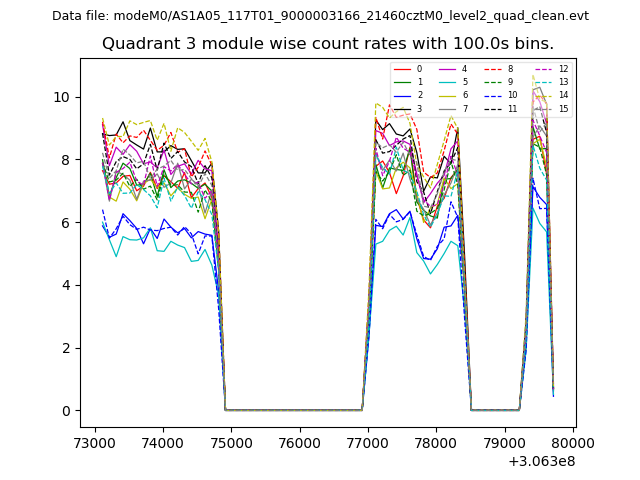 |
 |
| Parameter | Plot |
|---|---|
| CZT HV Monitor | 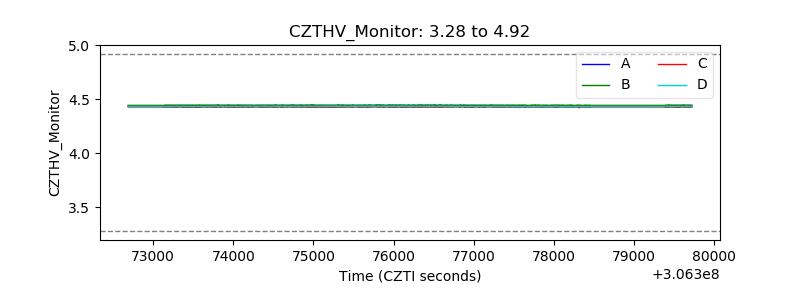 |
| D_VDD | 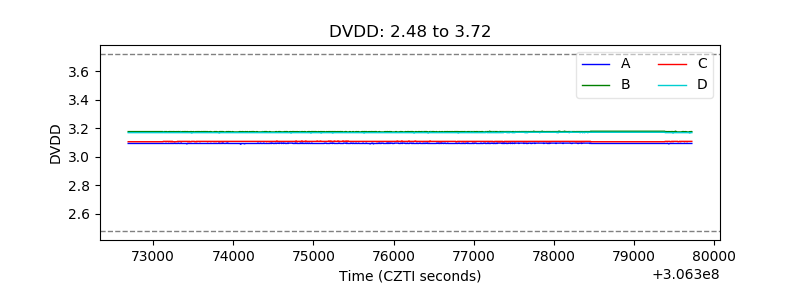 |
| Temperature 1 | 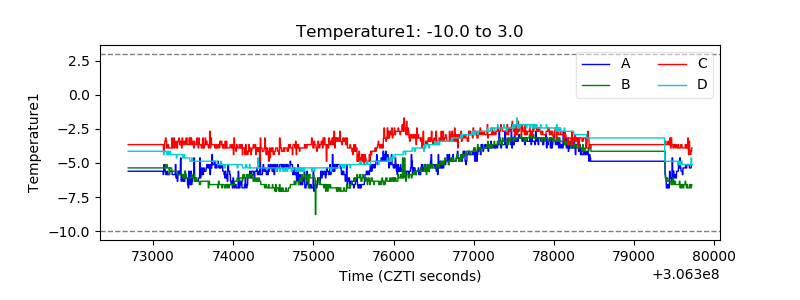 |
| Veto HV Monitor | 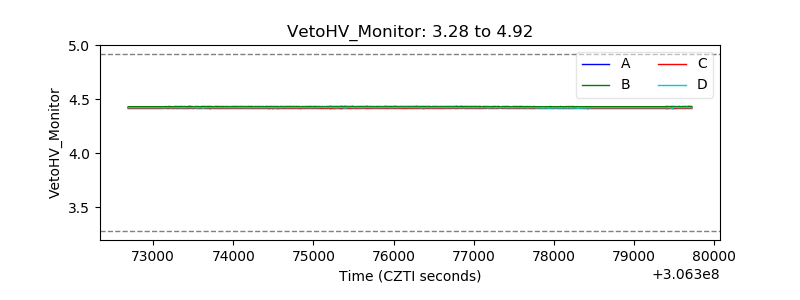 |
| Veto LLD | 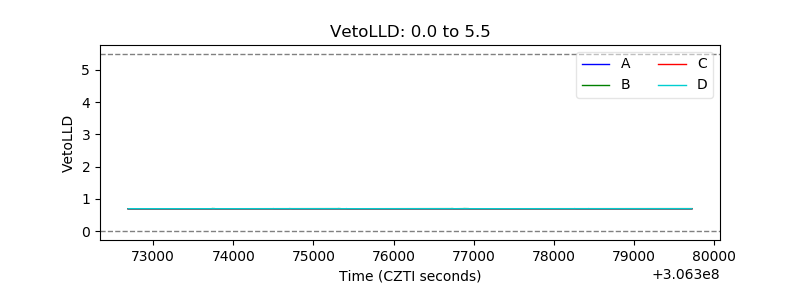 |
| Alpha Counter |  |
| _CPM_Rate |  |
| CZT Counter | 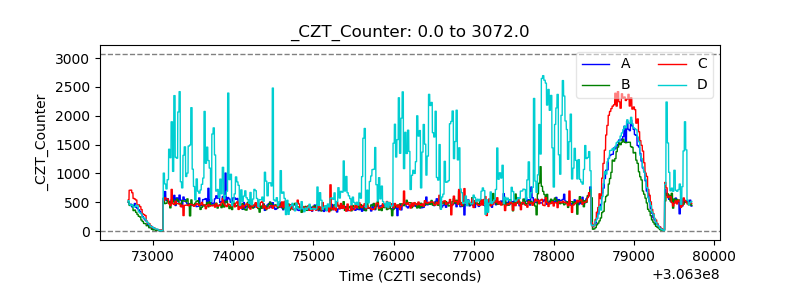 |
| +2.5 Volts monitor |  |
| +5 Volts monitor |  |
| _ROLL_ROT | 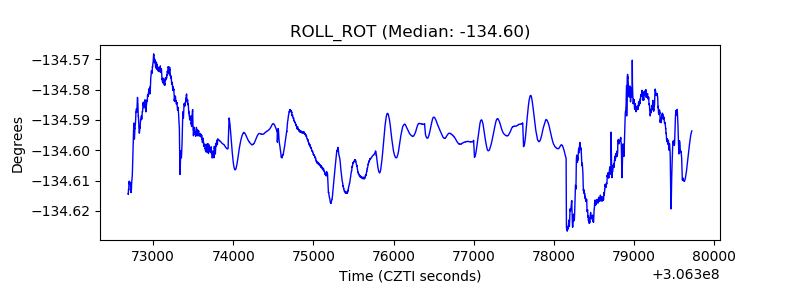 |
| _Roll_DEC | 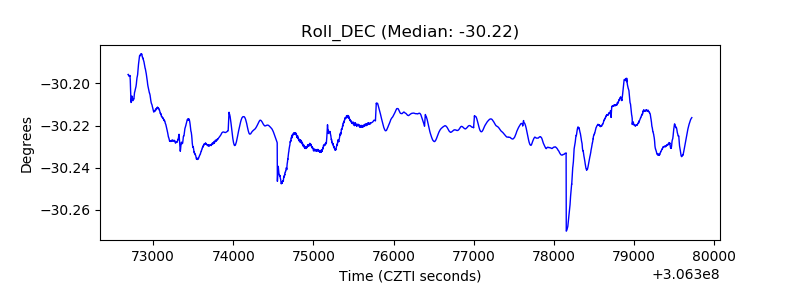 |
| _Roll_RA |  |
| Veto Counter | 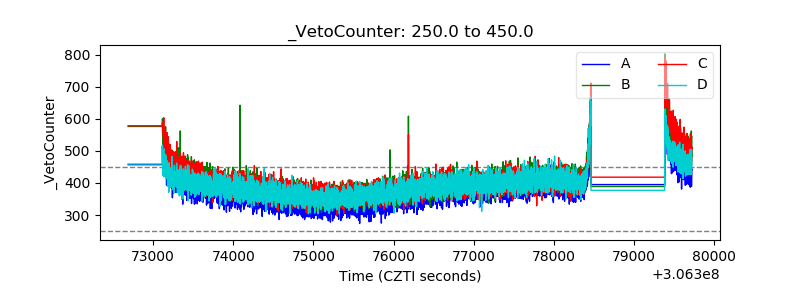 |