| Param | Original file | Final file |
|---|---|---|
| Filename | modeM0/AS1A06_009T05_9000003164cztM0_level2.fits | modeM0/AS1A06_009T05_9000003164cztM0_level2_quad_clean.evt |
| Size (bytes) | 77,086,080 | 41,886,720 |
| Size | 73.5 MB | 39.9 MB |
| Events in quadrant A | 501,888 | 209,956 |
| Events in quadrant B | 469,234 | 206,477 |
| Events in quadrant C | 471,390 | 195,459 |
| Events in quadrant D | 417,386 | 180,535 |
| Mode SS | |||
|---|---|---|---|
| Quadrant | BADHDUFLAG | Total packets | Discarded packets |
| A | 0 | 136 | 0 |
| B | 0 | 136 | 0 |
| C | 0 | 136 | 0 |
| D | 0 | 136 | 0 |
| Mode M0 | |||
|---|---|---|---|
| Quadrant | BADHDUFLAG | Total packets | Discarded packets |
| A | 0 | 16067 | 0 |
| B | 0 | 15412 | 0 |
| C | 0 | 15990 | 0 |
| D | 0 | 18204 | 0 |
| Mode M9 | |||
|---|---|---|---|
| Quadrant | BADHDUFLAG | Total packets | Discarded packets |
| A | 0 | 15 | 0 |
| B | 0 | 15 | 0 |
| C | 0 | 15 | 0 |
| D | 0 | 15 | 0 |
| Quadrant | Total seconds | Saturated seconds | Saturation percentage |
|---|---|---|---|
| A | 6823 | 108 | 1.582881% |
| B | 6823 | 114 | 1.670819% |
| C | 6823 | 133 | 1.949289% |
| D | 6823 | 175 | 2.564854% |
Noise dominated data is calculated using 1-second bins in cleaned event files. If a bin has >2000 counts, and if more than 50% of those come from <1% of pixels, then it is considered to be noise-dominated and hence unusable.
| Quadrant | # 1 sec bins | Bins with >0 counts | Bins with >2000 counts | High rate bins dominated by noise | Noise dominated (total time) | Noise dominated (detector-on time) | Marked lightcurve |
|---|---|---|---|---|---|---|---|
| A | 8092 | 6821 | 0 | 0 | 0.00% | 0.00% |  |
| B | 8091 | 6820 | 0 | 0 | 0.00% | 0.00% |  |
| C | 8092 | 6821 | 0 | 0 | 0.00% | 0.00% |  |
| D | 8091 | 6820 | 0 | 0 | 0.00% | 0.00% |  |
Top three noisy pixels from each quadrant. If the there are fewer than three noisy pixels in the level2.evt file, extra rows are filled as -1
| Pixel properties | Quadrant properties | ||||||
|---|---|---|---|---|---|---|---|
| Quadrant | DetID | PixID | Counts | Sigma | Mean | Median | Sigma |
| A | 0 | 29 | 431 | 9.3 | 130 | 124 | 33.0 |
| A | 7 | 110 | 398 | 8.3 | 130 | 124 | 33.0 |
| A | 9 | 19 | 366 | 7.33 | 130 | 124 | 33.0 |
| B | 2 | 9 | 397 | 10.53 | 124 | 120 | 26.3 |
| B | 5 | 128 | 319 | 7.56 | 124 | 120 | 26.3 |
| B | 13 | 245 | 315 | 7.41 | 124 | 120 | 26.3 |
| C | 1 | 81 | 363 | 7.4 | 124 | 118 | 33.1 |
| C | 1 | 80 | 359 | 7.28 | 124 | 118 | 33.1 |
| C | 7 | 111 | 307 | 5.71 | 124 | 118 | 33.1 |
| D | 7 | 3 | 321 | 6.52 | 119 | 110 | 32.4 |
| D | 4 | 246 | 316 | 6.36 | 119 | 110 | 32.4 |
| D | 6 | 67 | 310 | 6.18 | 119 | 110 | 32.4 |
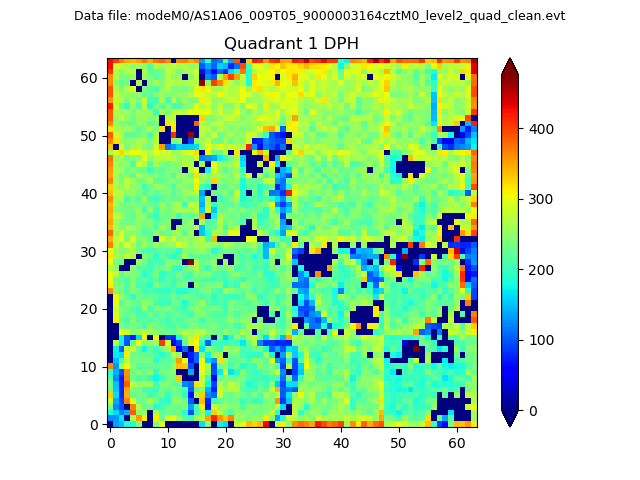
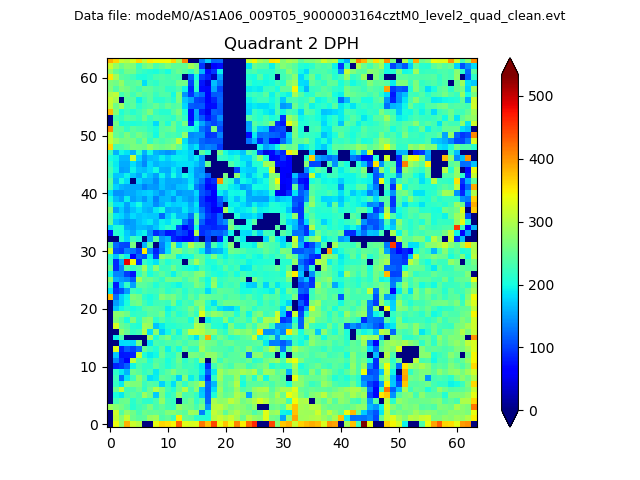
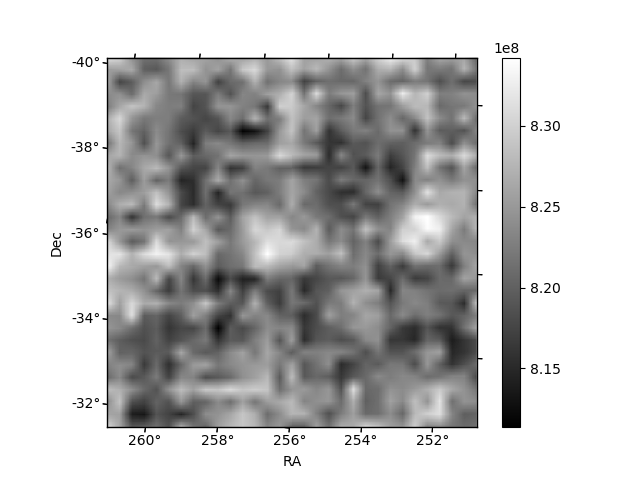
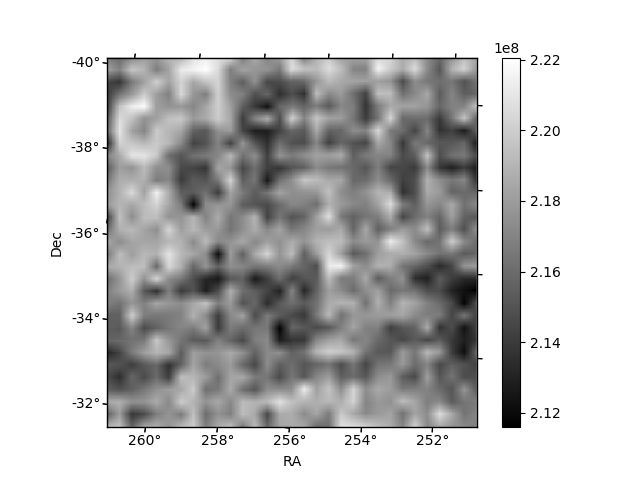
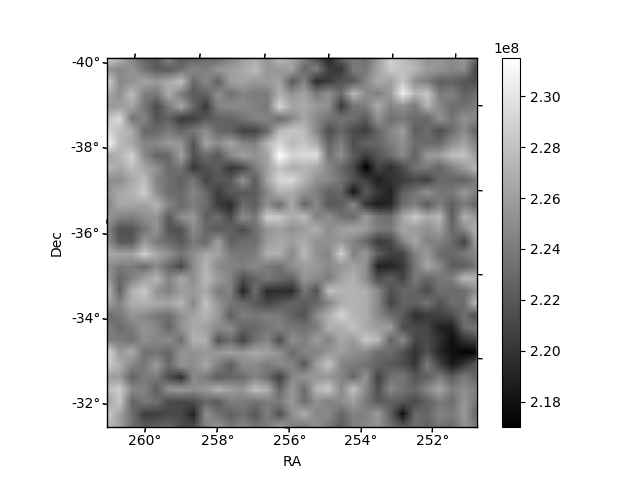
Histogram calculated using DETX and DETY for each event in the final _common_clean file
| Quadrant A |  |
 |
Quadrant B |
|---|---|---|---|
| Quadrant D | 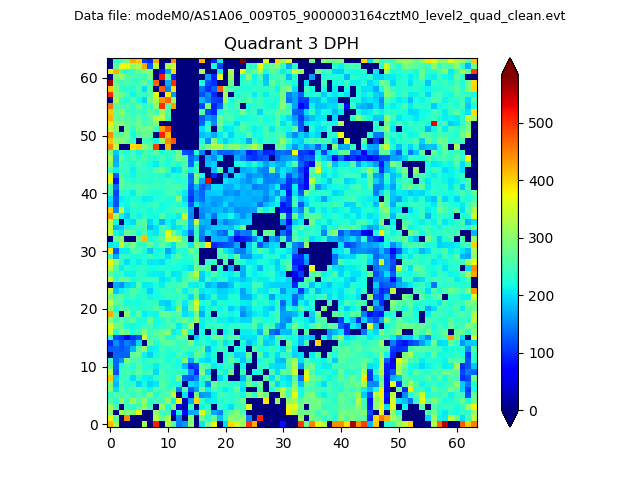 |
 |
Quadrant C |
| Plot type | Count rate plots | Images |
|---|---|---|
| Comparison with Poisson distribution Blue bars denote a histogram of data divided into 1 sec bins. Red curve is a Poisson curve with rate = median count rate of data. |
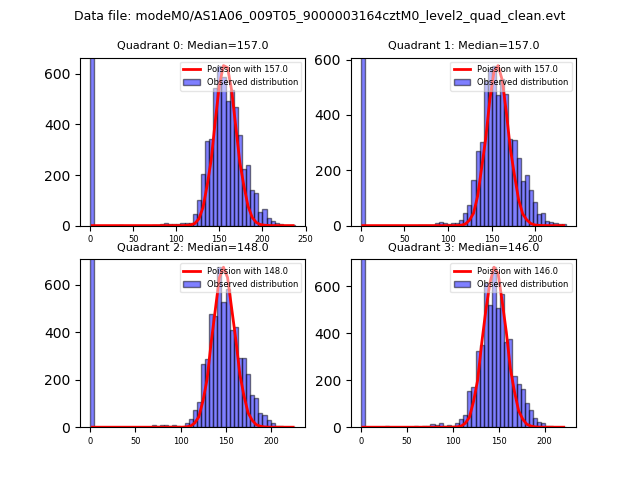 |
 |
| Quadrant-wise count rates Data is divided into 100 sec bins |
 |
|
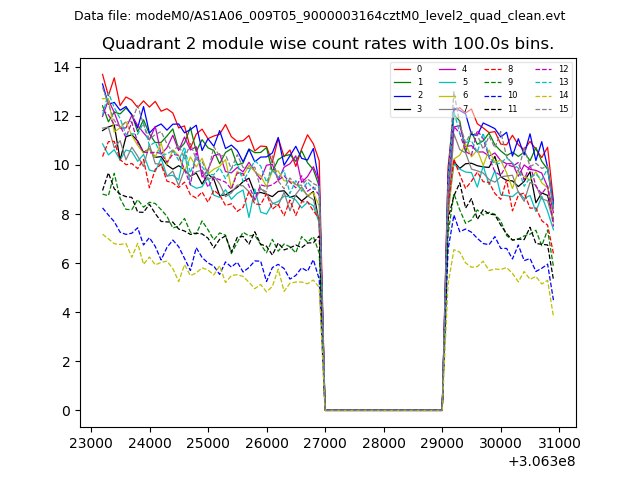
| Module-wise count rates for Quadrant A Data is divided into 100 sec bins |
 |
 |
| Module-wise count rates for Quadrant B Data is divided into 100 sec bins |
 |
 |
| Module-wise count rates for Quadrant C Data is divided into 100 sec bins |
 |
 |
| Module-wise count rates for Quadrant D Data is divided into 100 sec bins |
 |
 |
| Parameter | Plot |
|---|---|
| CZT HV Monitor |  |
| D_VDD | 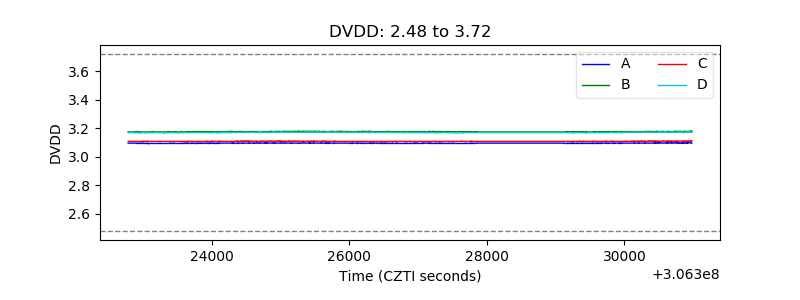 |
| Temperature 1 |  |
| Veto HV Monitor |  |
| Veto LLD |  |
| Alpha Counter | 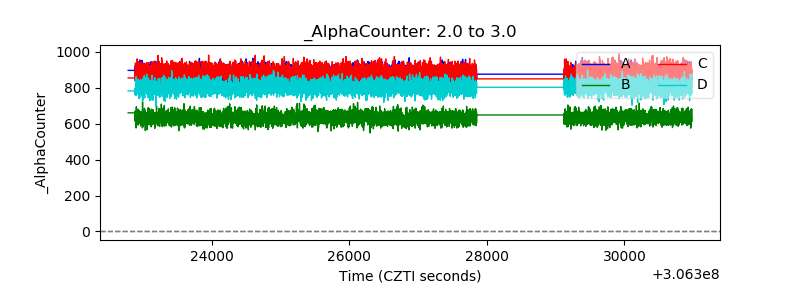 |
| _CPM_Rate | 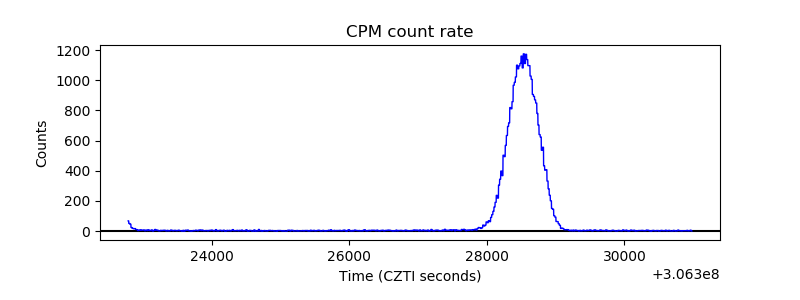 |
| CZT Counter |  |
| +2.5 Volts monitor |  |
| +5 Volts monitor | 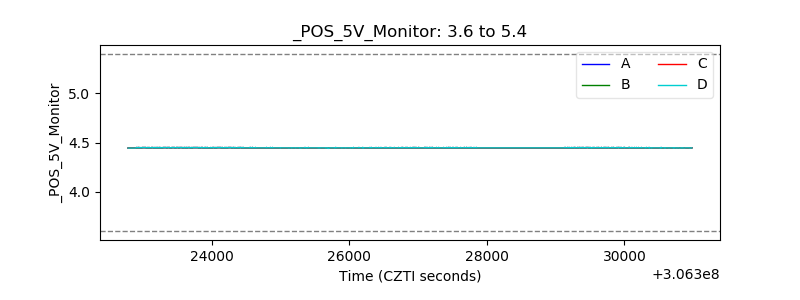 |
| _ROLL_ROT |  |
| _Roll_DEC |  |
| _Roll_RA |  |
| Veto Counter |  |