| Param | Original file | Final file |
|---|---|---|
| Filename | modeM0/AS1A06_009T05_9000003164_21452cztM0_level2.evt | modeM0/AS1A06_009T05_9000003164_21452cztM0_level2_quad_clean.evt |
| Size (bytes) | 475,580,160 | 118,267,200 |
| Size | 453.5 MB | 112.8 MB |
| Events in quadrant A | 3,455,943 | 815,160 |
| Events in quadrant B | 3,265,474 | 820,615 |
| Events in quadrant C | 3,278,345 | 771,595 |
| Events in quadrant D | 3,996,055 | 755,582 |
| Mode SS | |||
|---|---|---|---|
| Quadrant | BADHDUFLAG | Total packets | Discarded packets |
| A | 0 | 122 | 0 |
| B | 0 | 122 | 0 |
| C | 0 | 122 | 0 |
| D | 0 | 122 | 0 |
| Mode M0 | |||
|---|---|---|---|
| Quadrant | BADHDUFLAG | Total packets | Discarded packets |
| A | 0 | 14106 | 1 |
| B | 0 | 13389 | 1 |
| C | 0 | 13600 | 3 |
| D | 0 | 15923 | 1 |
| Mode M9 | |||
|---|---|---|---|
| Quadrant | BADHDUFLAG | Total packets | Discarded packets |
| A | 0 | 13 | 0 |
| B | 0 | 13 | 0 |
| C | 0 | 13 | 0 |
| D | 0 | 13 | 0 |
| Quadrant | Total seconds | Saturated seconds | Saturation percentage |
|---|---|---|---|
| A | 6002 | 99 | 1.649450% |
| B | 6003 | 106 | 1.765784% |
| C | 6002 | 116 | 1.932689% |
| D | 6002 | 156 | 2.599134% |
Noise dominated data is calculated using 1-second bins in cleaned event files. If a bin has >2000 counts, and if more than 50% of those come from <1% of pixels, then it is considered to be noise-dominated and hence unusable.
| Quadrant | # 1 sec bins | Bins with >0 counts | Bins with >2000 counts | High rate bins dominated by noise | Noise dominated (total time) | Noise dominated (detector-on time) | Marked lightcurve |
|---|---|---|---|---|---|---|---|
| A | 7272 | 6002 | 0 | 0 | 0.00% | 0.00% |  |
| B | 7273 | 6003 | 2 | 2 | 0.03% | 0.03% | 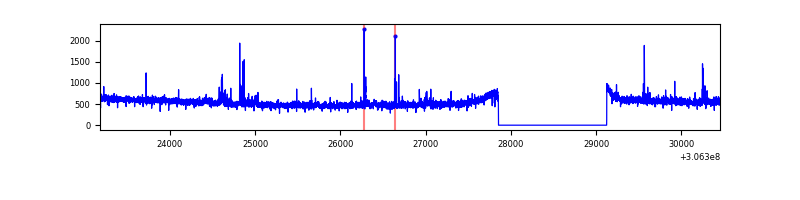 |
| C | 7271 | 6001 | 0 | 0 | 0.00% | 0.00% |  |
| D | 7272 | 6002 | 73 | 73 | 1.00% | 1.22% | 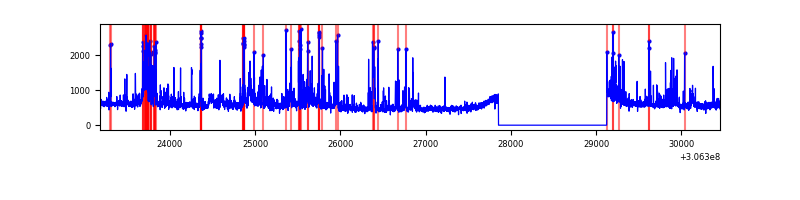 |
Top three noisy pixels from each quadrant. If the there are fewer than three noisy pixels in the level2.evt file, extra rows are filled as -1
| Pixel properties | Quadrant properties | ||||||
|---|---|---|---|---|---|---|---|
| Quadrant | DetID | PixID | Counts | Sigma | Mean | Median | Sigma |
| A | 11 | 47 | 276971 | 1684.52 | 824 | 810 | 163.9 |
| A | 13 | 254 | 9602 | 53.63 | 824 | 810 | 163.9 |
| A | 0 | 226 | 7171 | 38.8 | 824 | 810 | 163.9 |
| B | 0 | 229 | 36926 | 242.75 | 808 | 793 | 148.8 |
| B | 0 | 190 | 28025 | 182.95 | 808 | 793 | 148.8 |
| B | 12 | 111 | 17114 | 109.65 | 808 | 793 | 148.8 |
| C | 3 | 233 | 154368 | 870.68 | 769 | 777 | 176.4 |
| C | 14 | 238 | 124633 | 702.12 | 769 | 777 | 176.4 |
| C | 13 | 61 | 5491 | 26.72 | 769 | 777 | 176.4 |
| D | 7 | 38 | 214385 | 1128.13 | 789 | 769 | 189.4 |
| D | 1 | 20 | 151434 | 795.68 | 789 | 769 | 189.4 |
| D | 12 | 235 | 124256 | 652.15 | 789 | 769 | 189.4 |
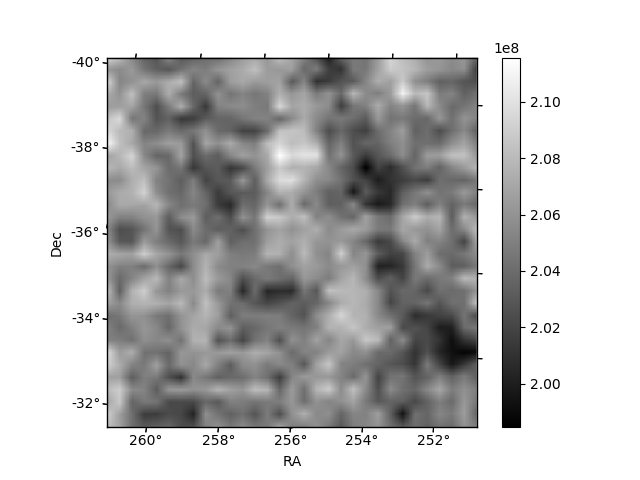
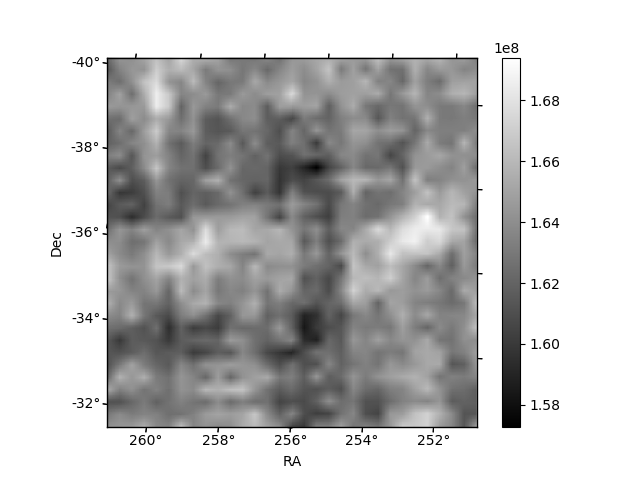
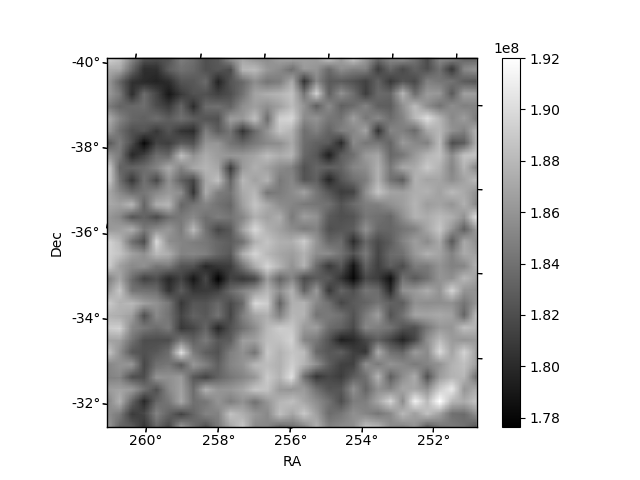
Histogram calculated using DETX and DETY for each event in the final _common_clean file
| Quadrant A | 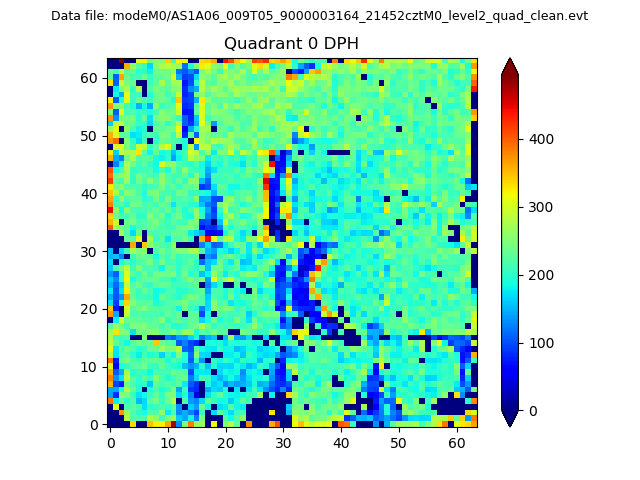 |
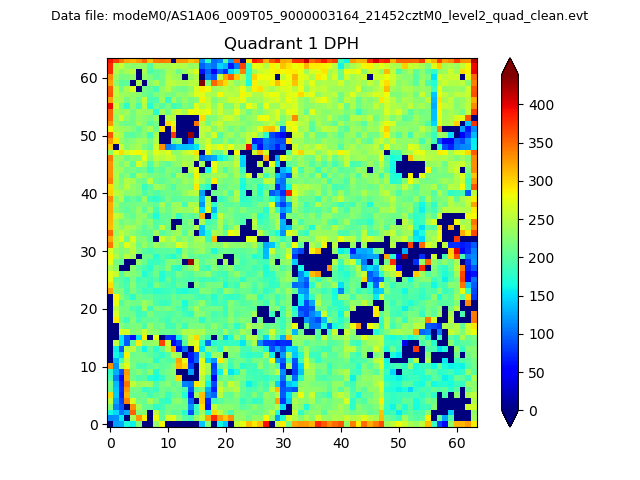 |
Quadrant B |
|---|---|---|---|
| Quadrant D | 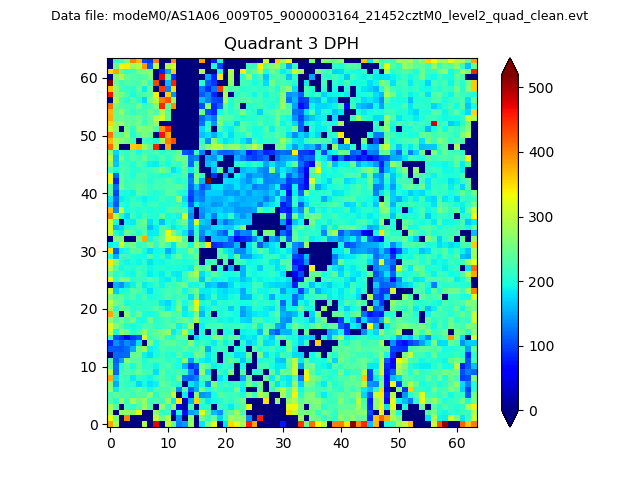 |
 |
Quadrant C |
| Plot type | Count rate plots | Images |
|---|---|---|
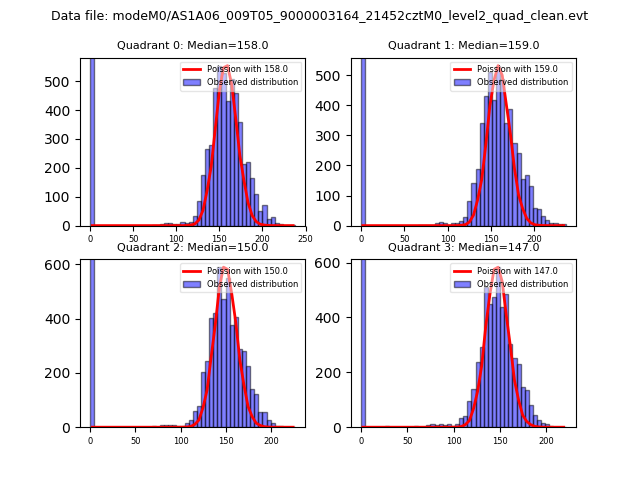
| Comparison with Poisson distribution Blue bars denote a histogram of data divided into 1 sec bins. Red curve is a Poisson curve with rate = median count rate of data. |
 |
 |
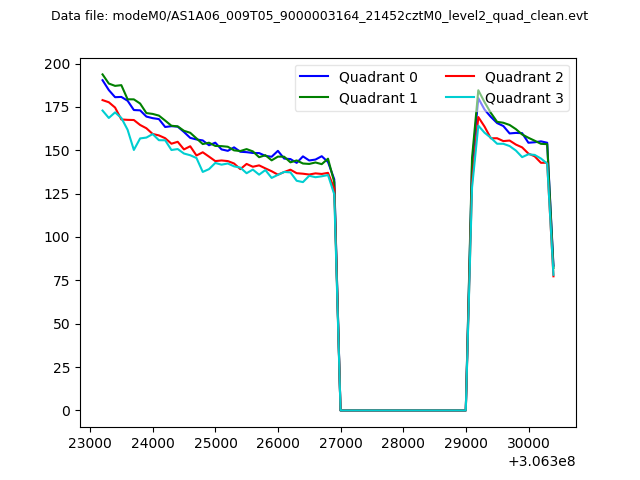
| Quadrant-wise count rates Data is divided into 100 sec bins |
 |
|
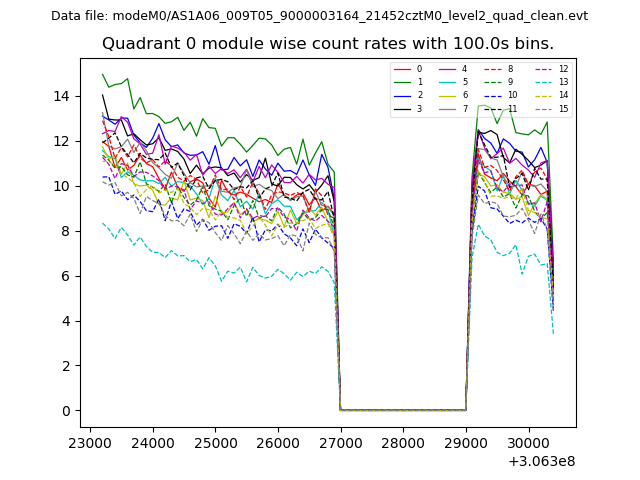
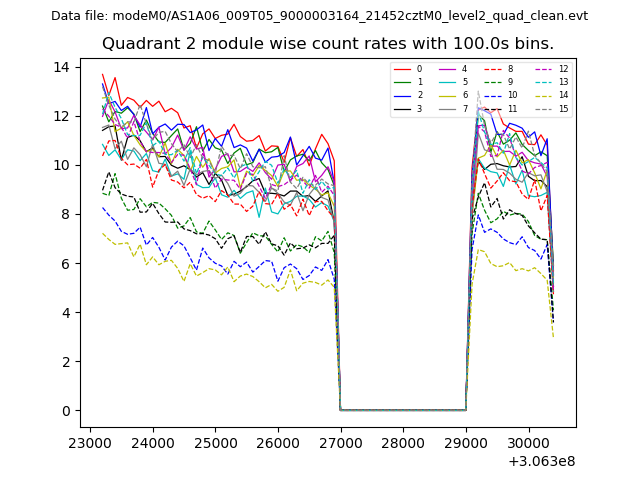
| Module-wise count rates for Quadrant A Data is divided into 100 sec bins |
 |
 |
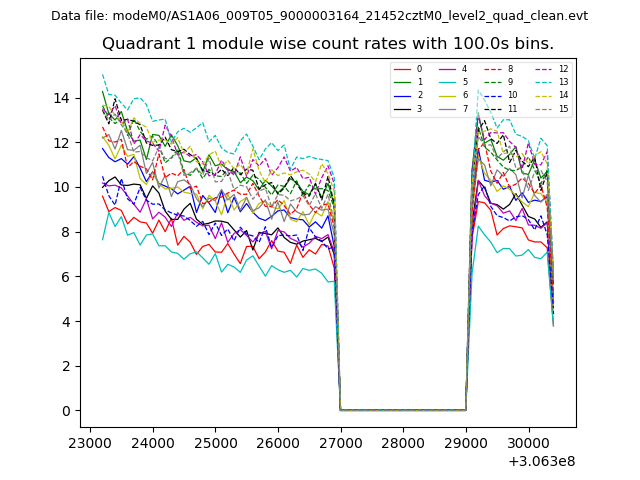
| Module-wise count rates for Quadrant B Data is divided into 100 sec bins |
 |
 |
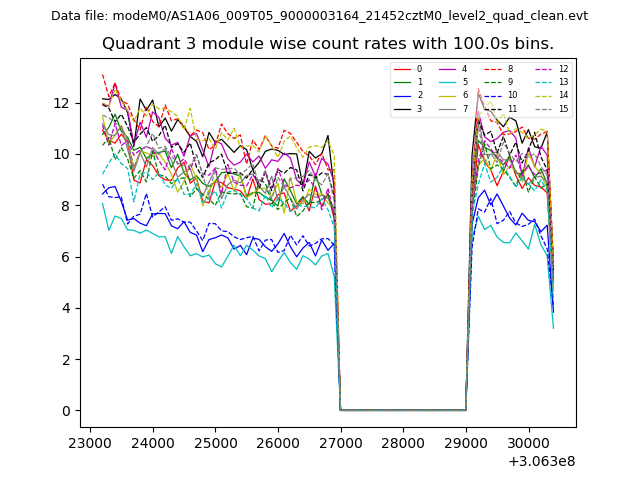
| Module-wise count rates for Quadrant C Data is divided into 100 sec bins |
 |
 |
| Module-wise count rates for Quadrant D Data is divided into 100 sec bins |
 |
 |
| Parameter | Plot |
|---|---|
| CZT HV Monitor | 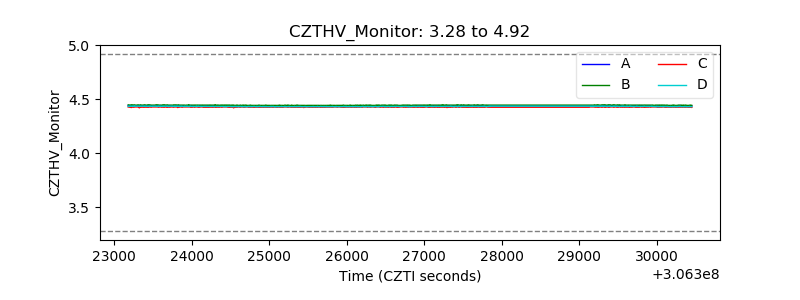 |
| D_VDD | 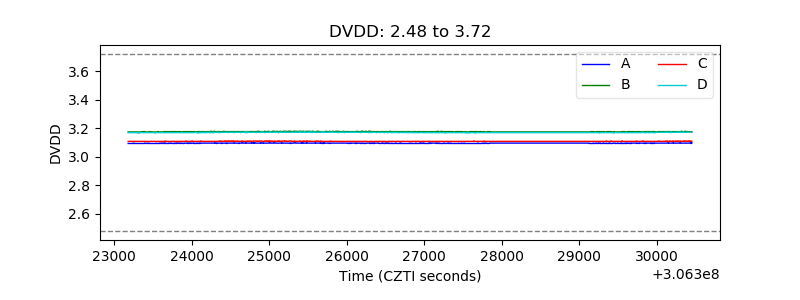 |
| Temperature 1 | 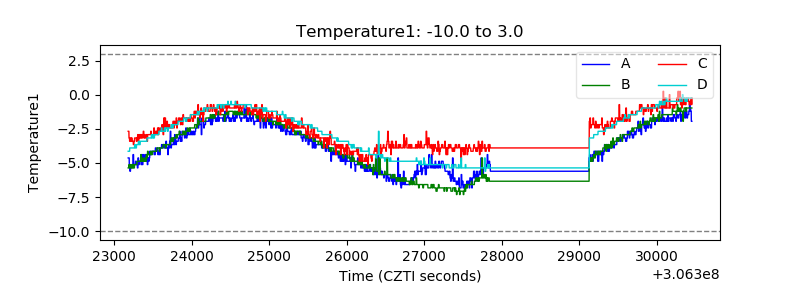 |
| Veto HV Monitor | 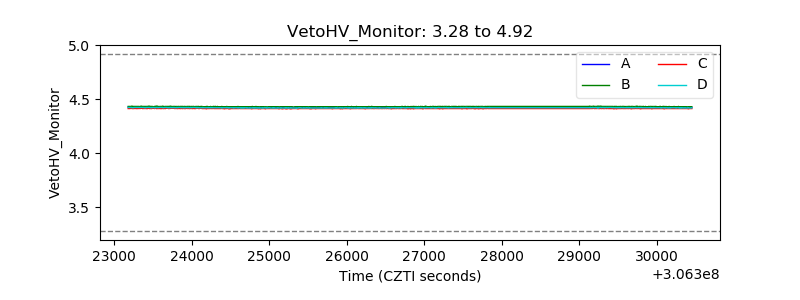 |
| Veto LLD | 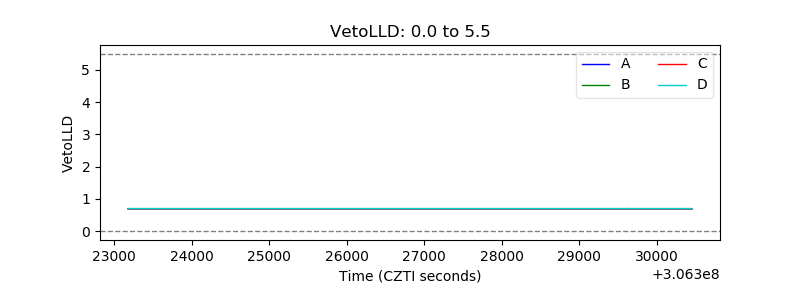 |
| Alpha Counter | 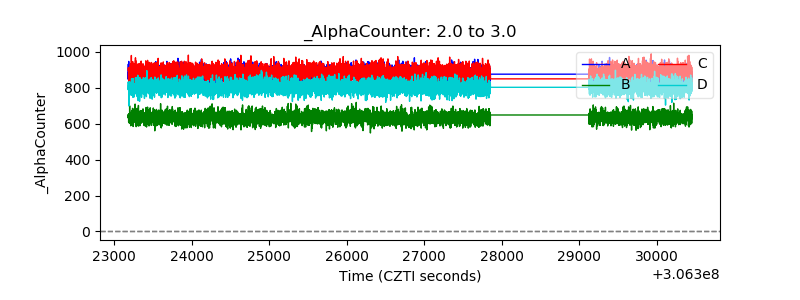 |
| _CPM_Rate | 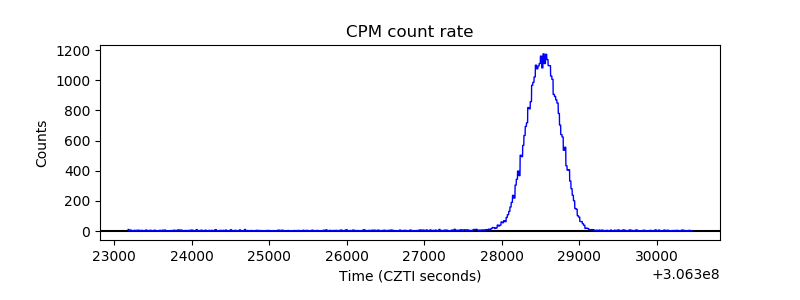 |
| CZT Counter | 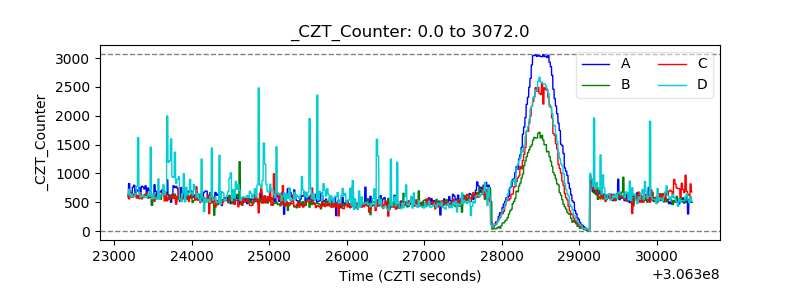 |
| +2.5 Volts monitor |  |
| +5 Volts monitor |  |
| _ROLL_ROT | 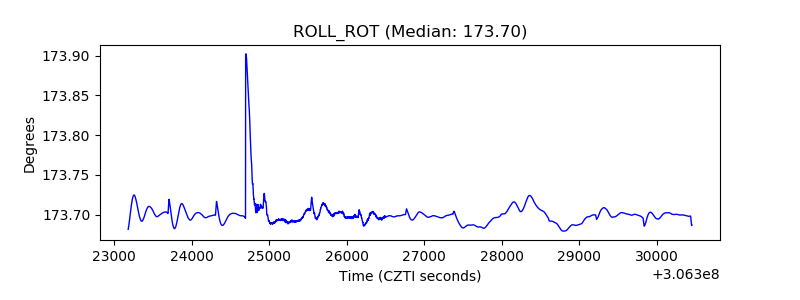 |
| _Roll_DEC | 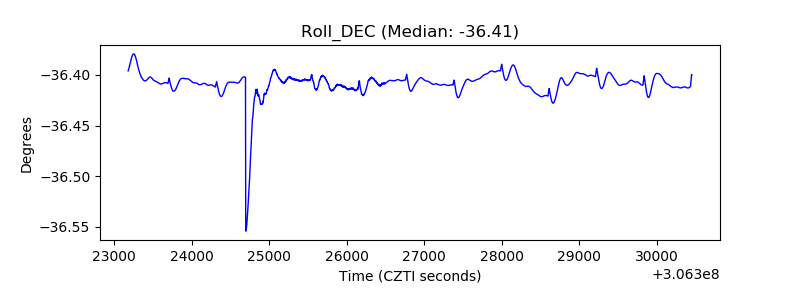 |
| _Roll_RA |  |
| Veto Counter | 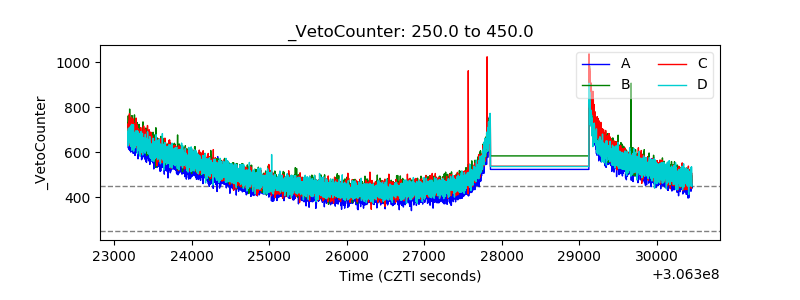 |