| Param | Original file | Final file |
|---|---|---|
| Filename | modeM0/AS1A06_009T05_9000003164_21453cztM0_level2.evt | modeM0/AS1A06_009T05_9000003164_21453cztM0_level2_quad_clean.evt |
| Size (bytes) | 106,211,520 | 28,546,560 |
| Size | 101.3 MB | 27.2 MB |
| Events in quadrant A | 684,300 | 197,592 |
| Events in quadrant B | 721,708 | 197,557 |
| Events in quadrant C | 877,100 | 186,234 |
| Events in quadrant D | 842,560 | 185,372 |
| Mode SS | |||
|---|---|---|---|
| Quadrant | BADHDUFLAG | Total packets | Discarded packets |
| A | 0 | 26 | 0 |
| B | 0 | 26 | 0 |
| C | 0 | 26 | 0 |
| D | 0 | 26 | 0 |
| Mode M0 | |||
|---|---|---|---|
| Quadrant | BADHDUFLAG | Total packets | Discarded packets |
| A | 0 | 2714 | 0 |
| B | 0 | 2860 | 0 |
| C | 0 | 3516 | 0 |
| D | 0 | 3315 | 0 |
| Quadrant | Total seconds | Saturated seconds | Saturation percentage |
|---|---|---|---|
| A | 1296 | 2 | 0.154321% |
| B | 1296 | 0 | 0.000000% |
| C | 1296 | 10 | 0.771605% |
| D | 1296 | 18 | 1.388889% |
Noise dominated data is calculated using 1-second bins in cleaned event files. If a bin has >2000 counts, and if more than 50% of those come from <1% of pixels, then it is considered to be noise-dominated and hence unusable.
| Quadrant | # 1 sec bins | Bins with >0 counts | Bins with >2000 counts | High rate bins dominated by noise | Noise dominated (total time) | Noise dominated (detector-on time) | Marked lightcurve |
|---|---|---|---|---|---|---|---|
| A | 1296 | 1296 | 0 | 0 | 0.00% | 0.00% | 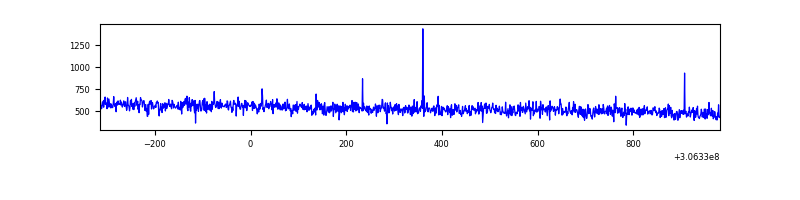 |
| B | 1296 | 1296 | 0 | 0 | 0.00% | 0.00% | 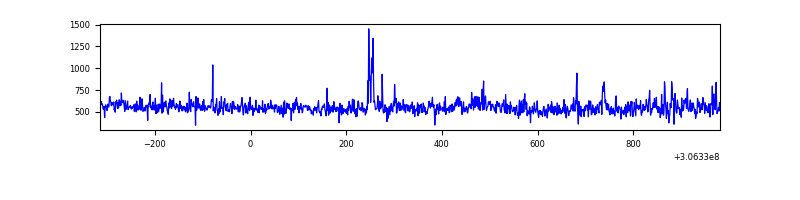 |
| C | 1296 | 1296 | 0 | 0 | 0.00% | 0.00% | 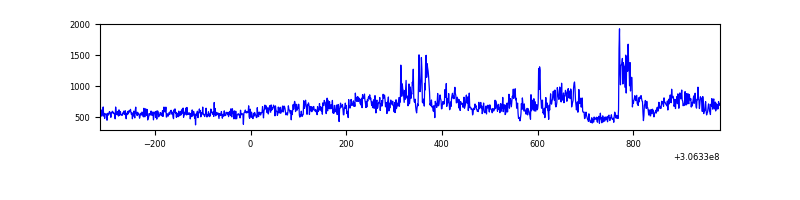 |
| D | 1296 | 1296 | 17 | 17 | 1.31% | 1.31% | 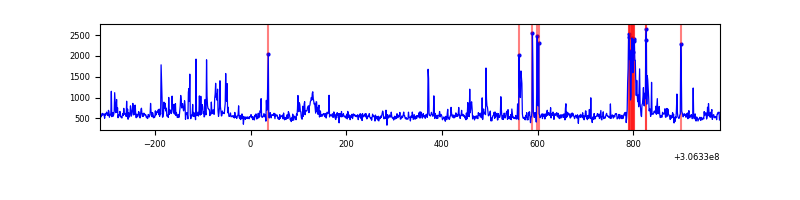 |
Top three noisy pixels from each quadrant. If the there are fewer than three noisy pixels in the level2.evt file, extra rows are filled as -1
| Pixel properties | Quadrant properties | ||||||
|---|---|---|---|---|---|---|---|
| Quadrant | DetID | PixID | Counts | Sigma | Mean | Median | Sigma |
| A | 11 | 47 | 7463 | 197.45 | 175 | 172 | 36.9 |
| A | 13 | 254 | 2435 | 61.29 | 175 | 172 | 36.9 |
| A | 0 | 226 | 1600 | 38.67 | 175 | 172 | 36.9 |
| B | 0 | 228 | 14154 | 412.03 | 169 | 166 | 33.9 |
| B | 0 | 190 | 9608 | 278.13 | 169 | 166 | 33.9 |
| B | 0 | 229 | 9515 | 275.39 | 169 | 166 | 33.9 |
| C | 3 | 233 | 223044 | 5754.6 | 160 | 162 | 38.7 |
| C | 14 | 238 | 26390 | 677.18 | 160 | 162 | 38.7 |
| C | 13 | 61 | 1179 | 26.26 | 160 | 162 | 38.7 |
| D | 12 | 235 | 52830 | 1249.22 | 168 | 163 | 42.2 |
| D | 6 | 143 | 34950 | 825.12 | 168 | 163 | 42.2 |
| D | 7 | 38 | 30134 | 710.89 | 168 | 163 | 42.2 |
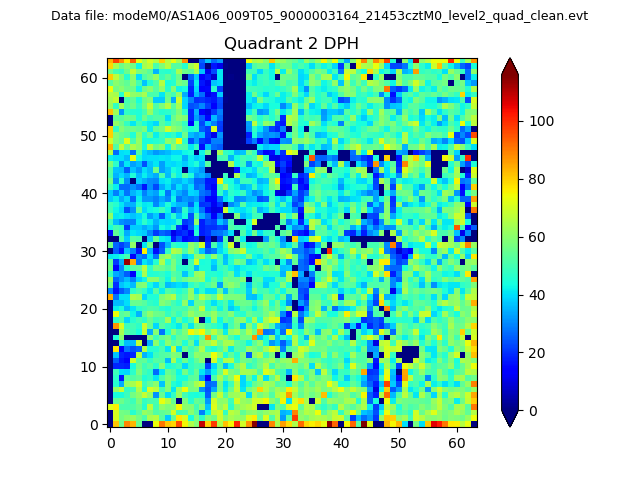
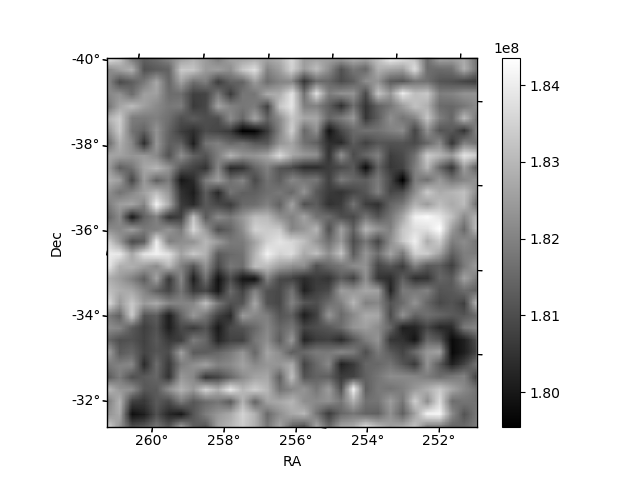
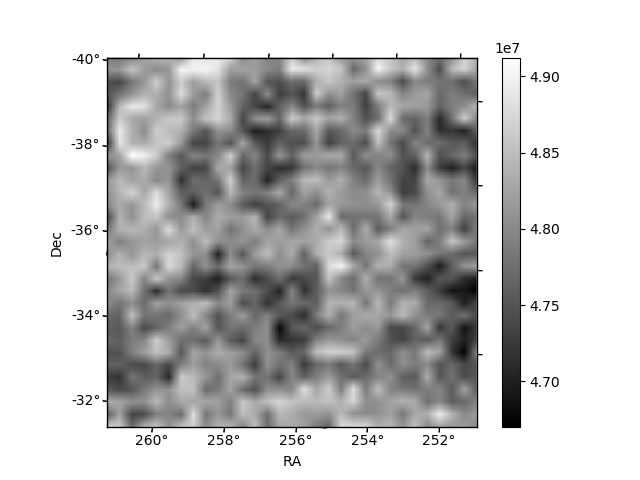
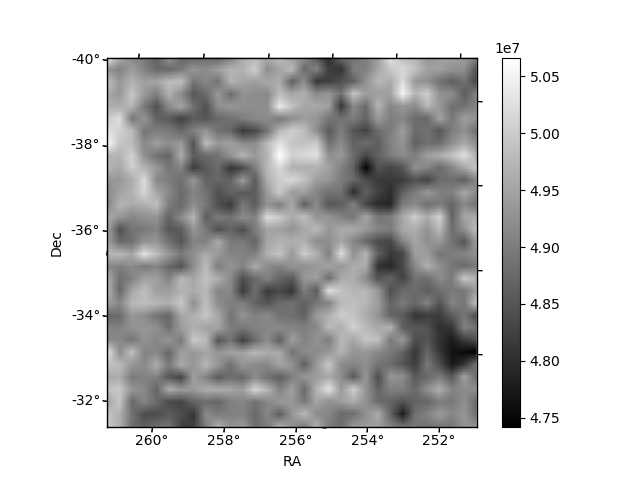
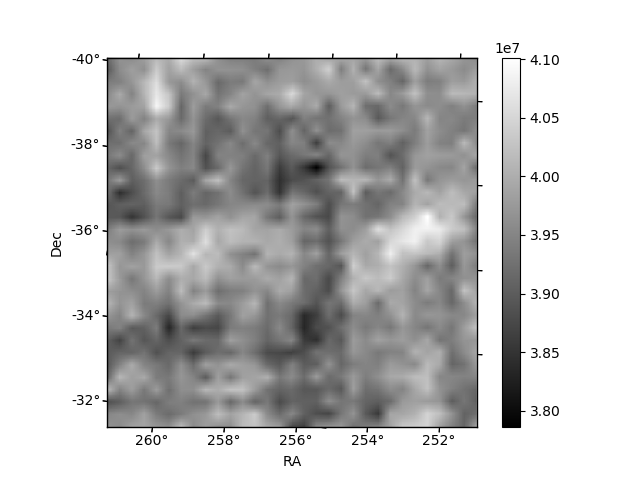
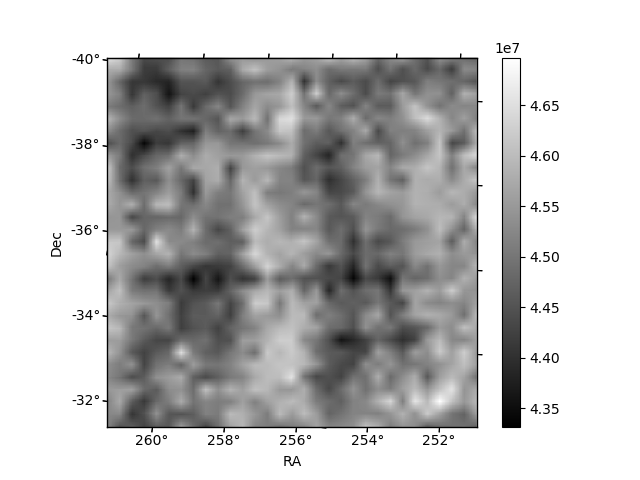
Histogram calculated using DETX and DETY for each event in the final _common_clean file
| Quadrant A | 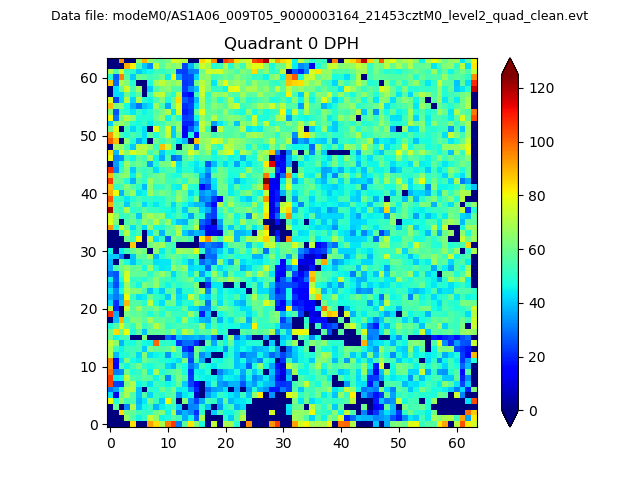 |
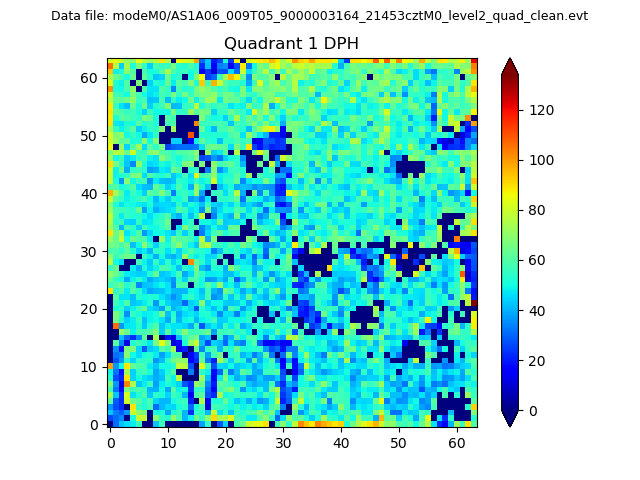 |
Quadrant B |
|---|---|---|---|
| Quadrant D | 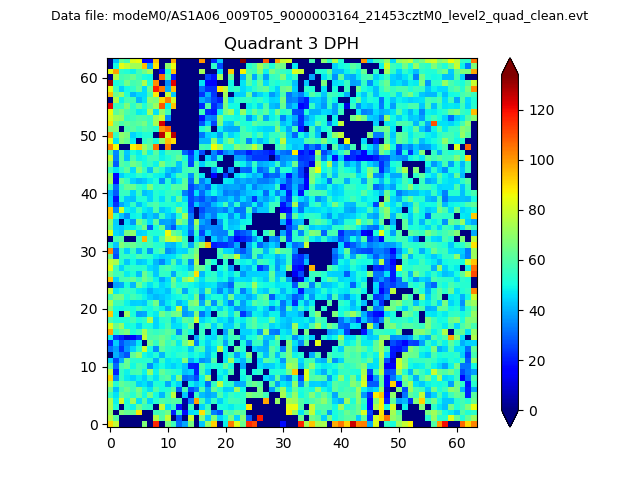 |
 |
Quadrant C |
| Plot type | Count rate plots | Images |
|---|---|---|
| Comparison with Poisson distribution Blue bars denote a histogram of data divided into 1 sec bins. Red curve is a Poisson curve with rate = median count rate of data. |
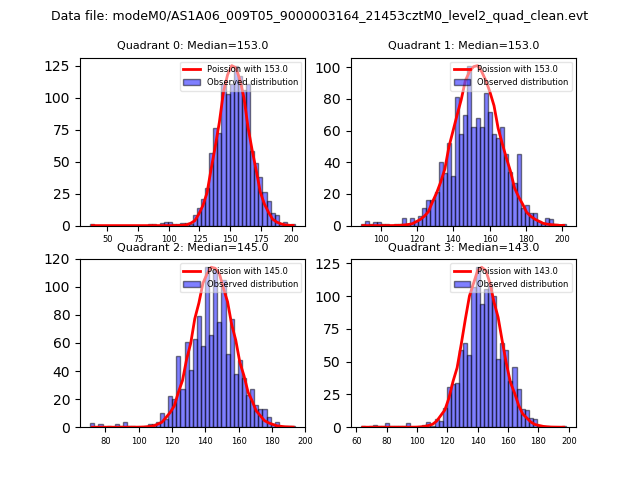 |
 |
| Quadrant-wise count rates Data is divided into 100 sec bins |
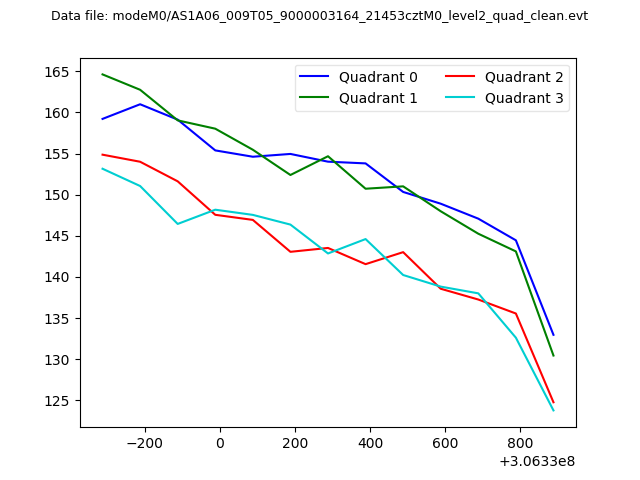 |
|
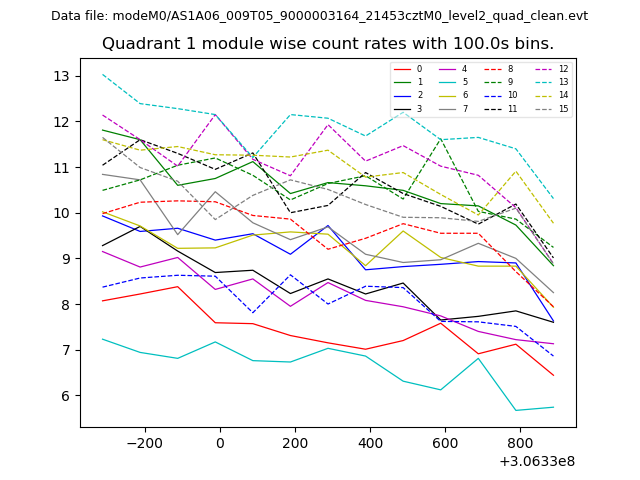
| Module-wise count rates for Quadrant A Data is divided into 100 sec bins |
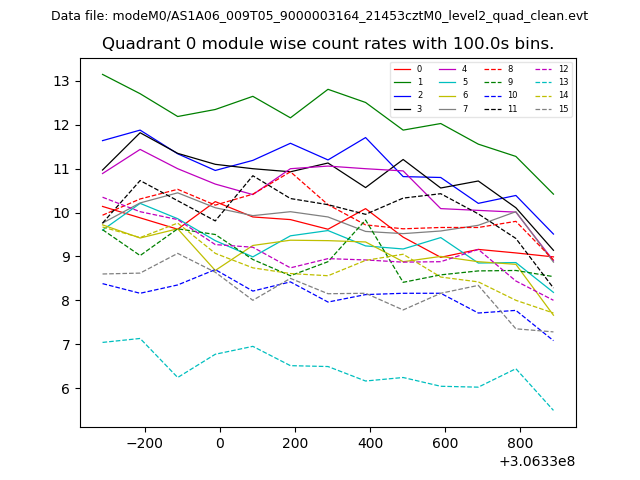 |
 |
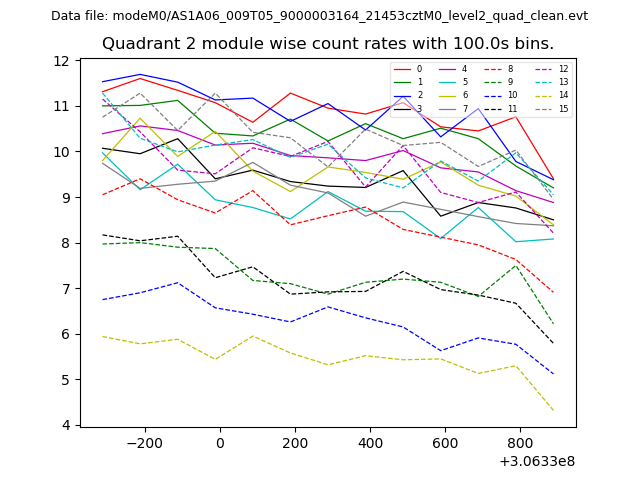
| Module-wise count rates for Quadrant B Data is divided into 100 sec bins |
 |
 |
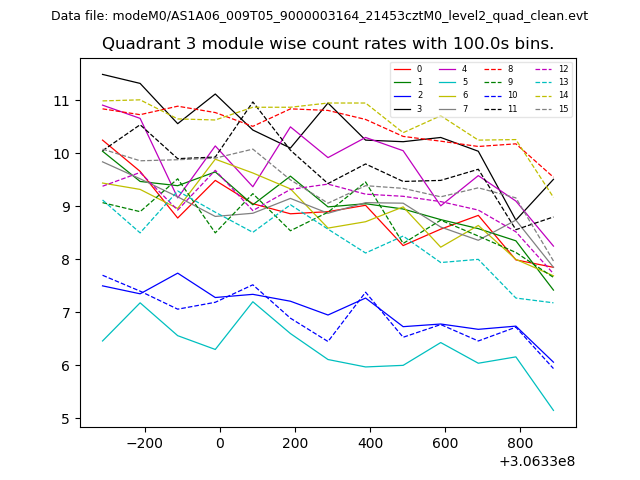
| Module-wise count rates for Quadrant C Data is divided into 100 sec bins |
 |
 |
| Module-wise count rates for Quadrant D Data is divided into 100 sec bins |
 |
 |
| Parameter | Plot |
|---|---|
| CZT HV Monitor |  |
| D_VDD | 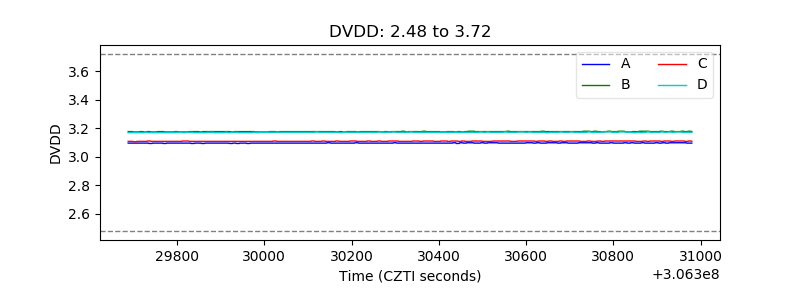 |
| Temperature 1 | 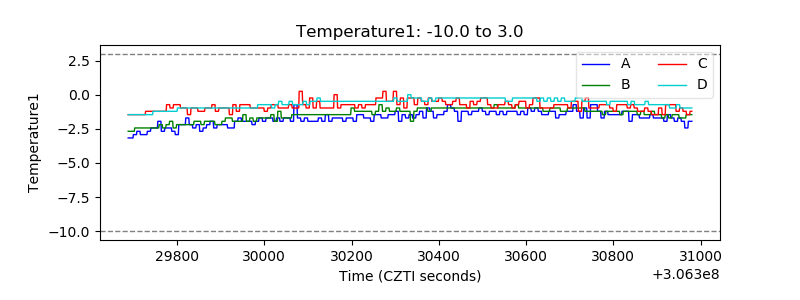 |
| Veto HV Monitor | 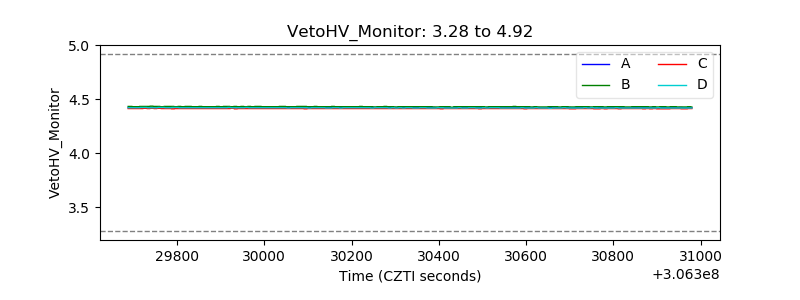 |
| Veto LLD | 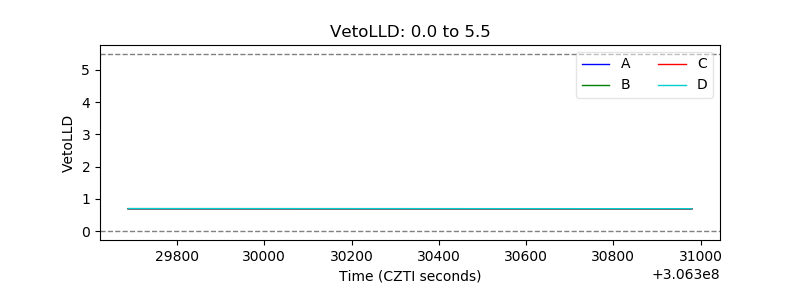 |
| Alpha Counter | 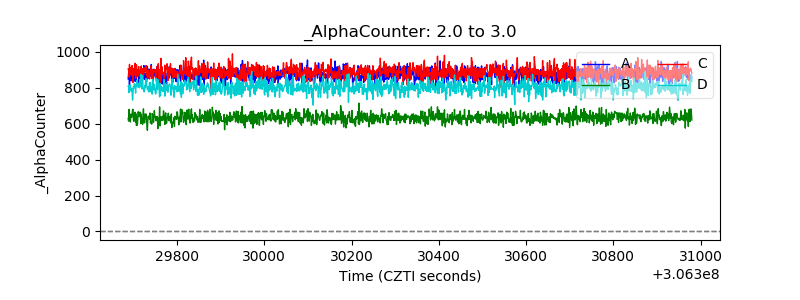 |
| _CPM_Rate | 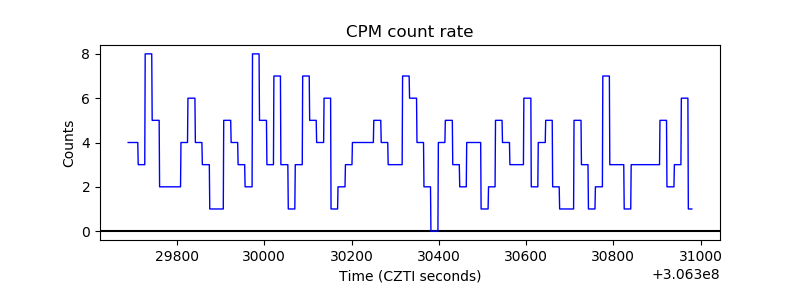 |
| CZT Counter | 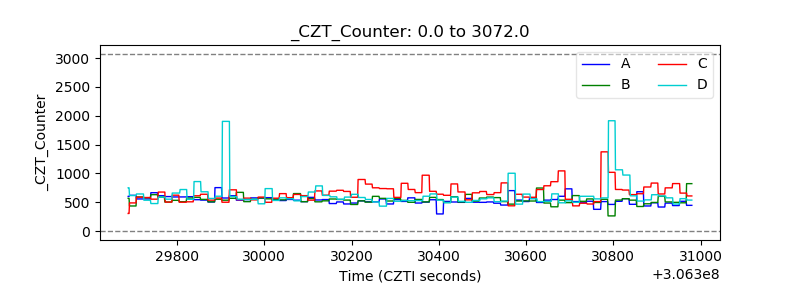 |
| +2.5 Volts monitor | 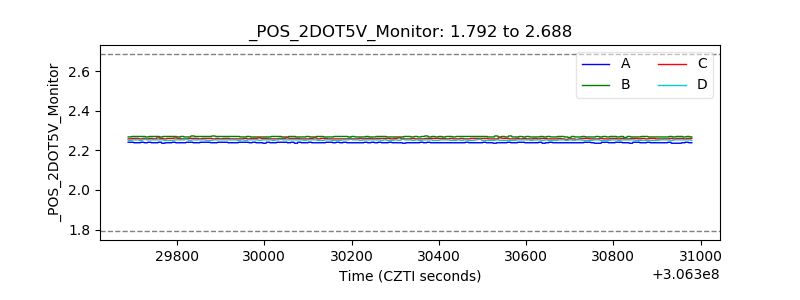 |
| +5 Volts monitor |  |
| _ROLL_ROT | 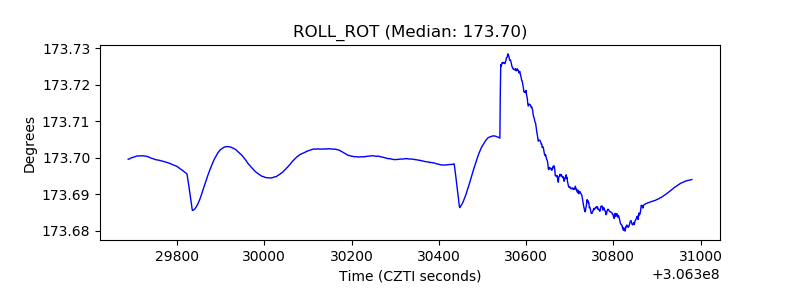 |
| _Roll_DEC | 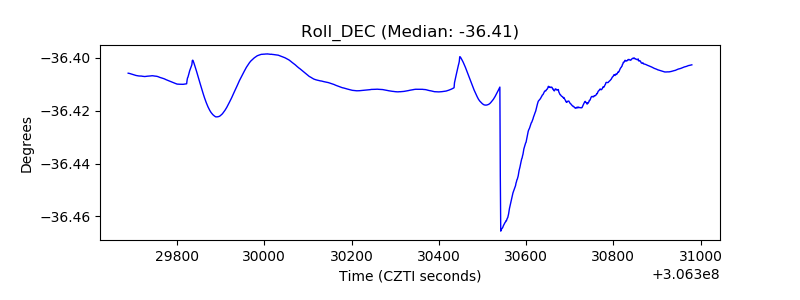 |
| _Roll_RA | 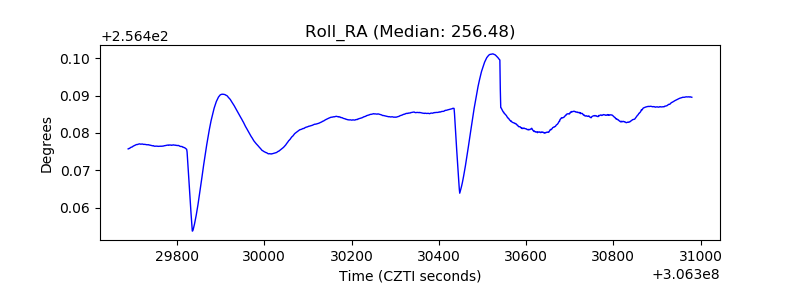 |
| Veto Counter | 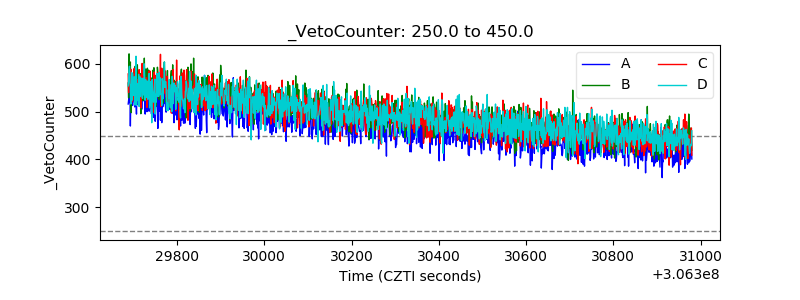 |