| Param | Original file | Final file |
|---|---|---|
| Filename | modeM0/AS1T03_138T01_9000003162cztM0_level2.fits | modeM0/AS1T03_138T01_9000003162cztM0_level2_quad_clean.evt |
| Size (bytes) | 57,173,760 | 16,790,400 |
| Size | 54.5 MB | 16.0 MB |
| Events in quadrant A | 372,226 | 42,733 |
| Events in quadrant B | 352,144 | 43,253 |
| Events in quadrant C | 350,972 | 39,721 |
| Events in quadrant D | 312,306 | 37,086 |
| Mode M0 | |||
|---|---|---|---|
| Quadrant | BADHDUFLAG | Total packets | Discarded packets |
| A | 0 | 10915 | 0 |
| B | 0 | 10864 | 0 |
| C | 0 | 10808 | 0 |
| D | 0 | 11463 | 0 |
| Mode M9 | |||
|---|---|---|---|
| Quadrant | BADHDUFLAG | Total packets | Discarded packets |
| A | 0 | 5 | 0 |
| B | 0 | 6 | 0 |
| C | 0 | 6 | 0 |
| D | 0 | 6 | 0 |
| Mode SS | |||
|---|---|---|---|
| Quadrant | BADHDUFLAG | Total packets | Discarded packets |
| A | 0 | 98 | 0 |
| B | 0 | 98 | 0 |
| C | 0 | 98 | 0 |
| D | 0 | 98 | 0 |
| Quadrant | Total seconds | Saturated seconds | Saturation percentage |
|---|---|---|---|
| A | 4907 | 75 | 1.528429% |
| B | 4907 | 83 | 1.691461% |
| C | 4907 | 94 | 1.915631% |
| D | 4907 | 63 | 1.283880% |
Noise dominated data is calculated using 1-second bins in cleaned event files. If a bin has >2000 counts, and if more than 50% of those come from <1% of pixels, then it is considered to be noise-dominated and hence unusable.
| Quadrant | # 1 sec bins | Bins with >0 counts | Bins with >2000 counts | High rate bins dominated by noise | Noise dominated (total time) | Noise dominated (detector-on time) | Marked lightcurve |
|---|---|---|---|---|---|---|---|
| A | 4905 | 4905 | 0 | 0 | 0.00% | 0.00% |  |
| B | 4905 | 4905 | 0 | 0 | 0.00% | 0.00% |  |
| C | 4905 | 4905 | 0 | 0 | 0.00% | 0.00% |  |
| D | 4905 | 4905 | 0 | 0 | 0.00% | 0.00% | 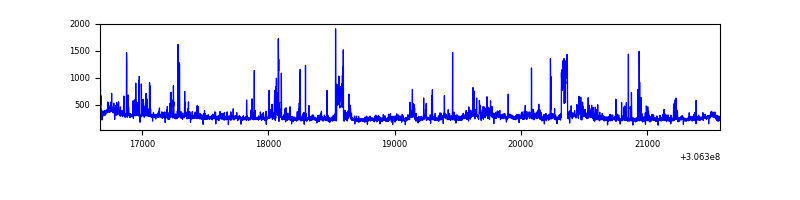 |
Top three noisy pixels from each quadrant. If the there are fewer than three noisy pixels in the level2.evt file, extra rows are filled as -1
| Pixel properties | Quadrant properties | ||||||
|---|---|---|---|---|---|---|---|
| Quadrant | DetID | PixID | Counts | Sigma | Mean | Median | Sigma |
| A | 0 | 29 | 348 | 10.16 | 97 | 92 | 25.2 |
| A | 14 | 79 | 282 | 7.54 | 97 | 92 | 25.2 |
| A | 7 | 110 | 276 | 7.3 | 97 | 92 | 25.2 |
| B | 2 | 9 | 263 | 8.38 | 93 | 89 | 20.8 |
| B | 2 | 8 | 237 | 7.13 | 93 | 89 | 20.8 |
| B | 5 | 128 | 233 | 6.94 | 93 | 89 | 20.8 |
| C | 1 | 81 | 268 | 7.02 | 92 | 87 | 25.8 |
| C | 12 | 241 | 251 | 6.36 | 92 | 87 | 25.8 |
| C | 1 | 80 | 250 | 6.32 | 92 | 87 | 25.8 |
| D | 10 | 189 | 231 | 5.96 | 89 | 82 | 25.0 |
| D | 15 | 46 | 223 | 5.64 | 89 | 82 | 25.0 |
| D | 10 | 113 | 223 | 5.64 | 89 | 82 | 25.0 |
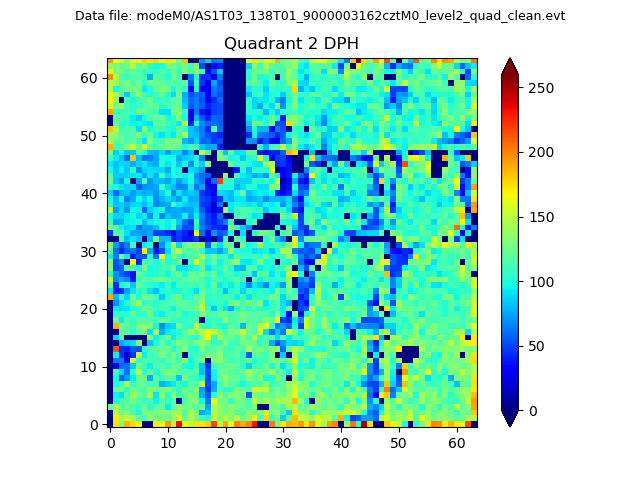
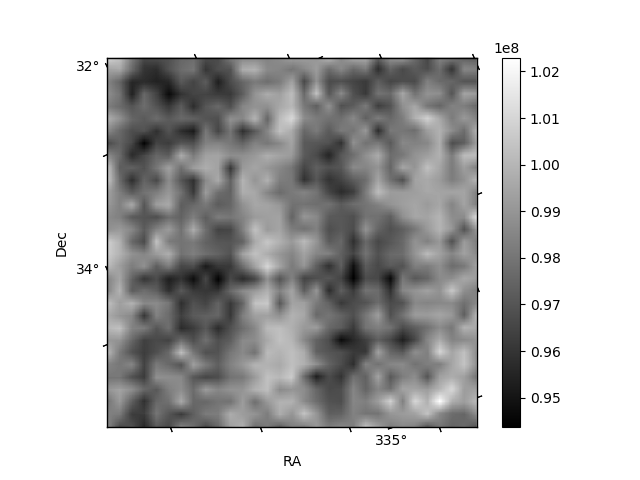
Histogram calculated using DETX and DETY for each event in the final _common_clean file
| Quadrant A | 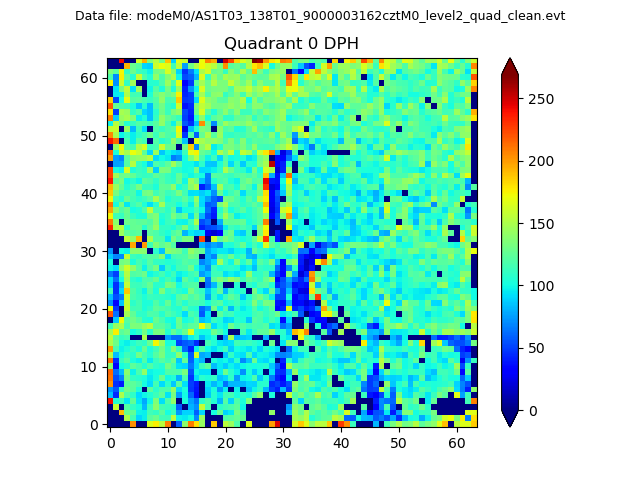 |
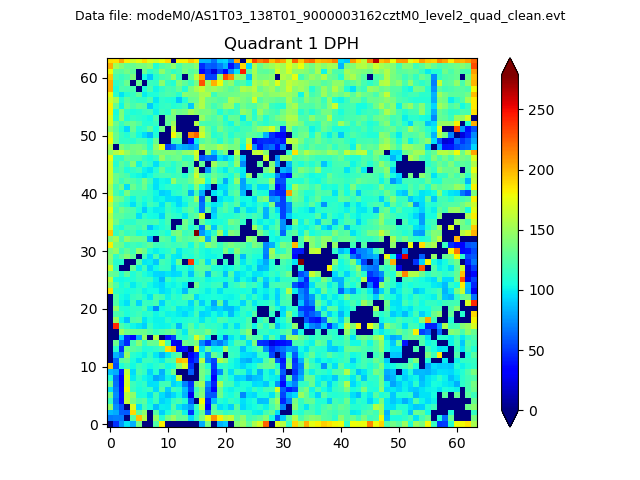 |
Quadrant B |
|---|---|---|---|
| Quadrant D | 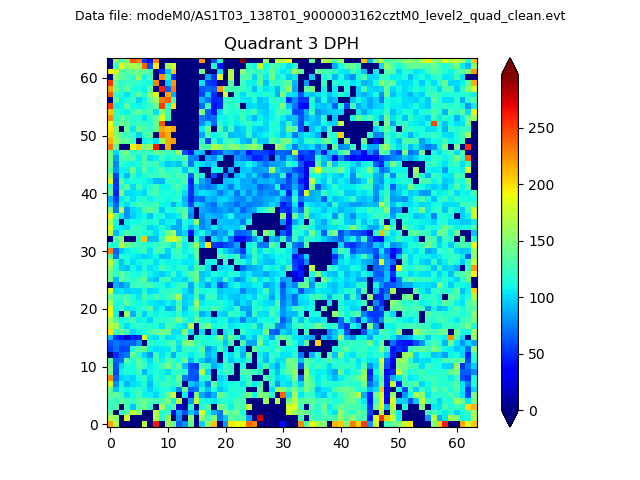 |
 |
Quadrant C |
| Plot type | Count rate plots | Images |
|---|---|---|
| Comparison with Poisson distribution Blue bars denote a histogram of data divided into 1 sec bins. Red curve is a Poisson curve with rate = median count rate of data. |
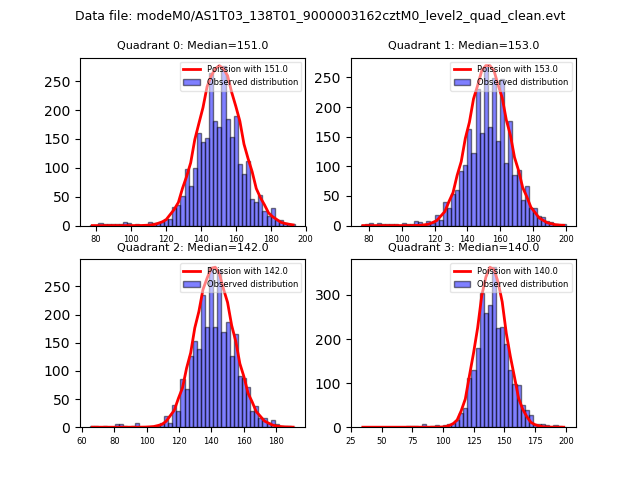 |
 |
| Quadrant-wise count rates Data is divided into 100 sec bins |
 |
|
| Module-wise count rates for Quadrant A Data is divided into 100 sec bins |
 |
 |
| Module-wise count rates for Quadrant B Data is divided into 100 sec bins |
 |
 |
| Module-wise count rates for Quadrant C Data is divided into 100 sec bins |
 |
 |
| Module-wise count rates for Quadrant D Data is divided into 100 sec bins |
 |
 |
| Parameter | Plot |
|---|---|
| CZT HV Monitor |  |
| D_VDD | 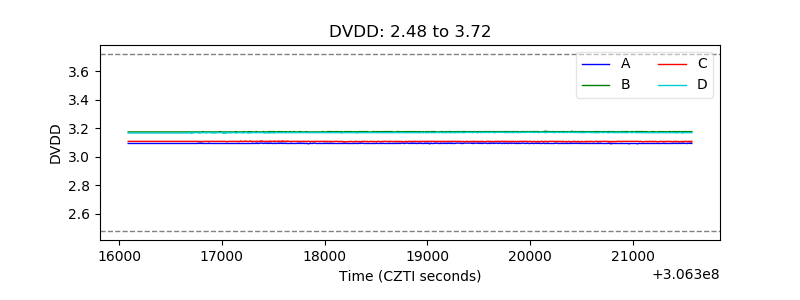 |
| Temperature 1 |  |
| Veto HV Monitor | 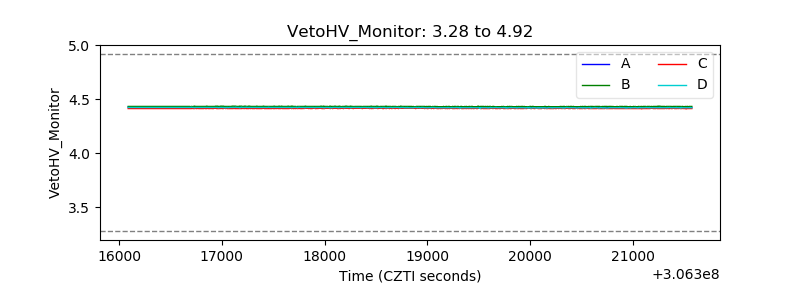 |
| Veto LLD |  |
| Alpha Counter | 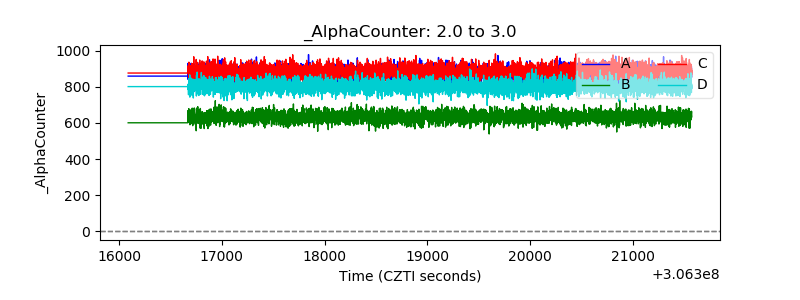 |
| _CPM_Rate | 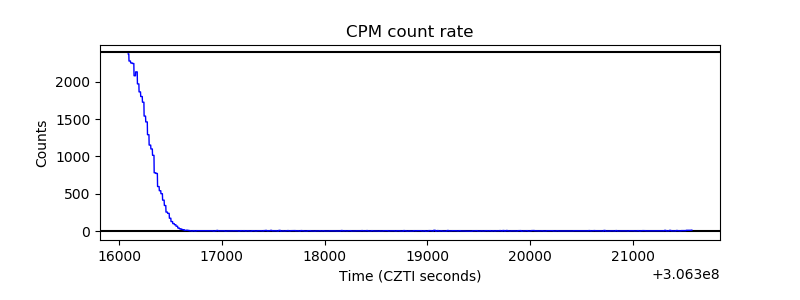 |
| CZT Counter |  |
| +2.5 Volts monitor | 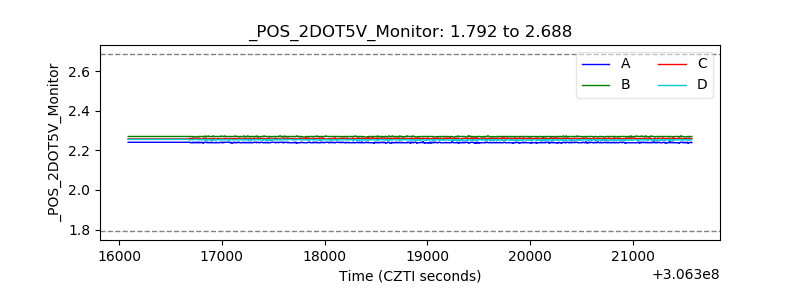 |
| +5 Volts monitor |  |
| _ROLL_ROT | 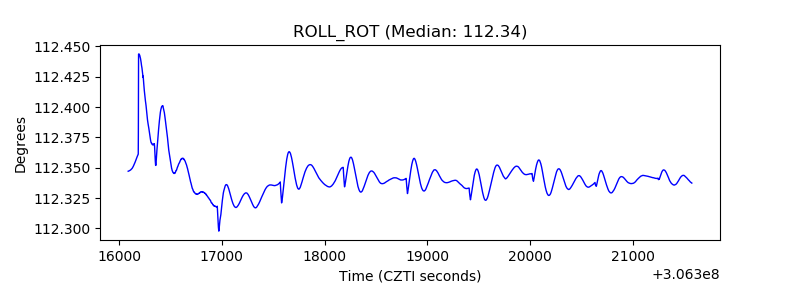 |
| _Roll_DEC | 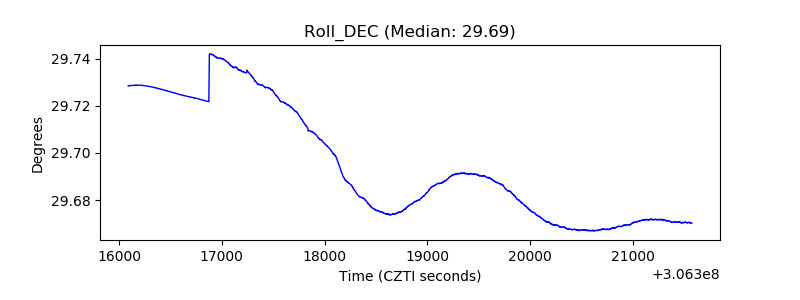 |
| _Roll_RA |  |
| Veto Counter |  |