| Param | Original file | Final file |
|---|---|---|
| Filename | modeM0/AS1A06_005T09_9000003168cztM0_level2.fits | modeM0/AS1A06_005T09_9000003168cztM0_level2_quad_clean.evt |
| Size (bytes) | 243,538,560 | 146,076,480 |
| Size | 232.3 MB | 139.3 MB |
| Events in quadrant A | 1,521,490 | 725,664 |
| Events in quadrant B | 1,472,414 | 737,933 |
| Events in quadrant C | 1,493,884 | 714,556 |
| Events in quadrant D | 1,294,476 | 650,249 |
| Mode SS | |||
|---|---|---|---|
| Quadrant | BADHDUFLAG | Total packets | Discarded packets |
| A | 0 | 546 | 0 |
| B | 0 | 546 | 0 |
| C | 0 | 548 | 0 |
| D | 0 | 546 | 0 |
| Mode M9 | |||
|---|---|---|---|
| Quadrant | BADHDUFLAG | Total packets | Discarded packets |
| A | 0 | 48 | 0 |
| B | 0 | 48 | 0 |
| C | 0 | 48 | 0 |
| D | 0 | 48 | 0 |
| Mode M0 | |||
|---|---|---|---|
| Quadrant | BADHDUFLAG | Total packets | Discarded packets |
| A | 0 | 48437 | 0 |
| B | 0 | 50667 | 0 |
| C | 0 | 50013 | 0 |
| D | 0 | 59127 | 0 |
| Quadrant | Total seconds | Saturated seconds | Saturation percentage |
|---|---|---|---|
| A | 22899 | 324 | 1.414909% |
| B | 22900 | 447 | 1.951965% |
| C | 22897 | 553 | 2.415164% |
| D | 22903 | 734 | 3.204820% |
Noise dominated data is calculated using 1-second bins in cleaned event files. If a bin has >2000 counts, and if more than 50% of those come from <1% of pixels, then it is considered to be noise-dominated and hence unusable.
| Quadrant | # 1 sec bins | Bins with >0 counts | Bins with >2000 counts | High rate bins dominated by noise | Noise dominated (total time) | Noise dominated (detector-on time) | Marked lightcurve |
|---|---|---|---|---|---|---|---|
| A | 25494 | 18194 | 0 | 0 | 0.00% | 0.00% |  |
| B | 25494 | 18193 | 0 | 0 | 0.00% | 0.00% | 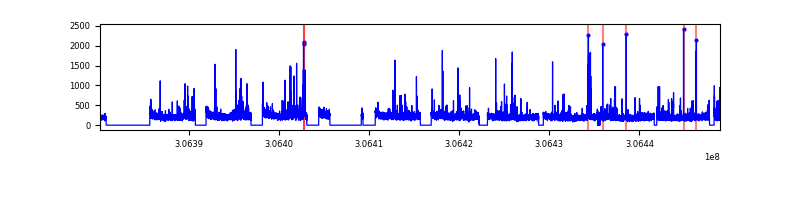 |
| C | 25494 | 18192 | 0 | 0 | 0.00% | 0.00% |  |
| D | 25492 | 18189 | 0 | 0 | 0.00% | 0.00% |  |
Top three noisy pixels from each quadrant. If the there are fewer than three noisy pixels in the level2.evt file, extra rows are filled as -1
| Pixel properties | Quadrant properties | ||||||
|---|---|---|---|---|---|---|---|
| Quadrant | DetID | PixID | Counts | Sigma | Mean | Median | Sigma |
| A | 0 | 29 | 1446 | 11.07 | 395 | 372 | 97.0 |
| A | 7 | 110 | 1208 | 8.62 | 395 | 372 | 97.0 |
| A | 0 | 30 | 1141 | 7.93 | 395 | 372 | 97.0 |
| B | 2 | 9 | 1157 | 9.91 | 389 | 373 | 79.1 |
| B | 2 | 8 | 1003 | 7.96 | 389 | 373 | 79.1 |
| B | 5 | 128 | 987 | 7.76 | 389 | 373 | 79.1 |
| C | 12 | 241 | 1033 | 6.63 | 394 | 372 | 99.7 |
| C | 7 | 111 | 1014 | 6.44 | 394 | 372 | 99.7 |
| C | 9 | 209 | 1012 | 6.42 | 394 | 372 | 99.7 |
| D | 7 | 3 | 982 | 6.59 | 370 | 340 | 97.4 |
| D | 10 | 189 | 916 | 5.92 | 370 | 340 | 97.4 |
| D | 6 | 67 | 908 | 5.83 | 370 | 340 | 97.4 |
Histogram calculated using DETX and DETY for each event in the final _common_clean file
| Quadrant A |  |
 |
Quadrant B |
|---|---|---|---|
| Quadrant D |  |
 |
Quadrant C |
| Plot type | Count rate plots | Images |
|---|---|---|
| Comparison with Poisson distribution Blue bars denote a histogram of data divided into 1 sec bins. Red curve is a Poisson curve with rate = median count rate of data. |
 |
 |
| Quadrant-wise count rates Data is divided into 100 sec bins |
 |
|
| Module-wise count rates for Quadrant A Data is divided into 100 sec bins |
 |
 |
| Module-wise count rates for Quadrant B Data is divided into 100 sec bins |
 |
 |
| Module-wise count rates for Quadrant C Data is divided into 100 sec bins |
 |
 |
| Module-wise count rates for Quadrant D Data is divided into 100 sec bins |
 |
 |
| Parameter | Plot |
|---|---|
| CZT HV Monitor |  |
| D_VDD |  |
| Temperature 1 |  |
| Veto HV Monitor |  |
| Veto LLD |  |
| Alpha Counter |  |
| _CPM_Rate |  |
| CZT Counter |  |
| +2.5 Volts monitor |  |
| +5 Volts monitor |  |
| _ROLL_ROT |  |
| _Roll_DEC |  |
| _Roll_RA |  |
| Veto Counter |  |