| Param | Original file | Final file |
|---|---|---|
| Filename | modeM0/AS1A06_005T09_9000003168_21460cztM0_level2.evt | modeM0/AS1A06_005T09_9000003168_21460cztM0_level2_quad_clean.evt |
| Size (bytes) | 60,606,720 | 9,270,720 |
| Size | 57.8 MB | 8.8 MB |
| Events in quadrant A | 296,481 | 59,656 |
| Events in quadrant B | 306,418 | 61,265 |
| Events in quadrant C | 307,215 | 57,039 |
| Events in quadrant D | 876,113 | 47,313 |
| Mode SS | |||
|---|---|---|---|
| Quadrant | BADHDUFLAG | Total packets | Discarded packets |
| A | 0 | 14 | 0 |
| B | 0 | 14 | 0 |
| C | 0 | 14 | 0 |
| D | 0 | 14 | 0 |
| Mode M0 | |||
|---|---|---|---|
| Quadrant | BADHDUFLAG | Total packets | Discarded packets |
| A | 0 | 1350 | 0 |
| B | 0 | 1349 | 0 |
| C | 0 | 1351 | 0 |
| D | 0 | 3053 | 0 |
| Quadrant | Total seconds | Saturated seconds | Saturation percentage |
|---|---|---|---|
| A | 674 | 1 | 0.148368% |
| B | 674 | 0 | 0.000000% |
| C | 674 | 4 | 0.593472% |
| D | 674 | 138 | 20.474777% |
Noise dominated data is calculated using 1-second bins in cleaned event files. If a bin has >2000 counts, and if more than 50% of those come from <1% of pixels, then it is considered to be noise-dominated and hence unusable.
| Quadrant | # 1 sec bins | Bins with >0 counts | Bins with >2000 counts | High rate bins dominated by noise | Noise dominated (total time) | Noise dominated (detector-on time) | Marked lightcurve |
|---|---|---|---|---|---|---|---|
| A | 674 | 674 | 0 | 0 | 0.00% | 0.00% | 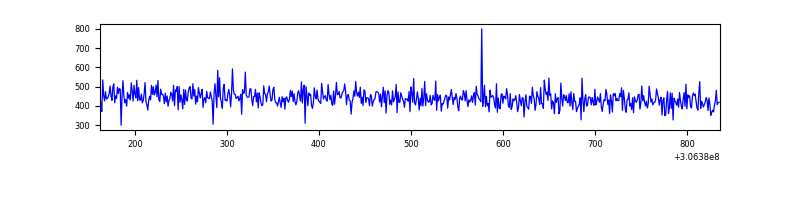 |
| B | 674 | 674 | 0 | 0 | 0.00% | 0.00% | 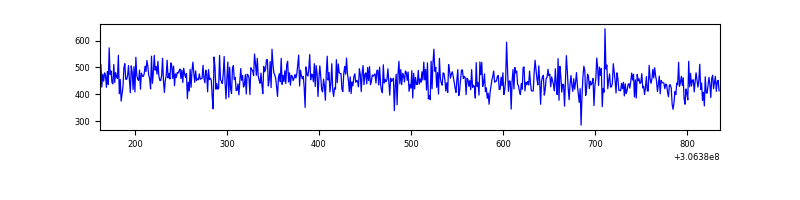 |
| C | 674 | 674 | 0 | 0 | 0.00% | 0.00% | 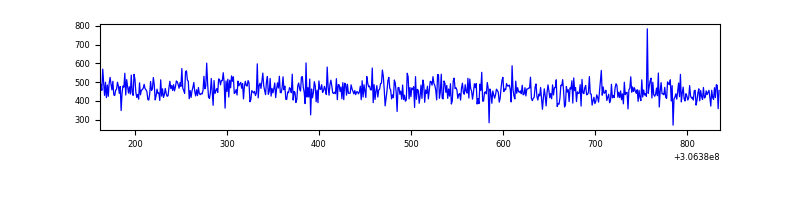 |
| D | 673 | 673 | 170 | 170 | 25.26% | 25.26% | 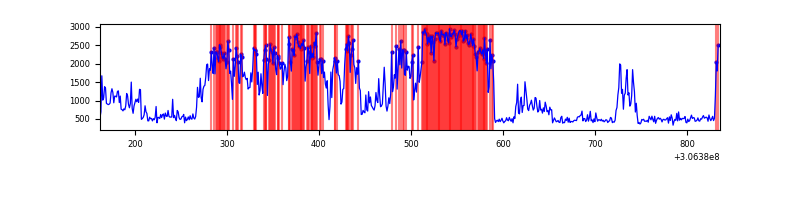 |
Top three noisy pixels from each quadrant. If the there are fewer than three noisy pixels in the level2.evt file, extra rows are filled as -1
| Pixel properties | Quadrant properties | ||||||
|---|---|---|---|---|---|---|---|
| Quadrant | DetID | PixID | Counts | Sigma | Mean | Median | Sigma |
| A | 13 | 254 | 847 | 43.68 | 76 | 74 | 17.7 |
| A | 3 | 137 | 682 | 34.35 | 76 | 74 | 17.7 |
| A | 0 | 226 | 662 | 33.22 | 76 | 74 | 17.7 |
| B | 12 | 111 | 1866 | 104.22 | 78 | 76 | 17.2 |
| B | 11 | 111 | 1550 | 85.82 | 78 | 76 | 17.2 |
| B | 14 | 111 | 1397 | 76.91 | 78 | 76 | 17.2 |
| C | 14 | 238 | 12198 | 617.04 | 75 | 76 | 19.6 |
| C | 13 | 61 | 508 | 21.99 | 75 | 76 | 19.6 |
| C | 3 | 202 | 225 | 7.58 | 75 | 76 | 19.6 |
| D | 12 | 235 | 576266 | 30529.27 | 69 | 67 | 18.9 |
| D | 13 | 174 | 18232 | 962.45 | 69 | 67 | 18.9 |
| D | 14 | 35 | 8943 | 470.29 | 69 | 67 | 18.9 |
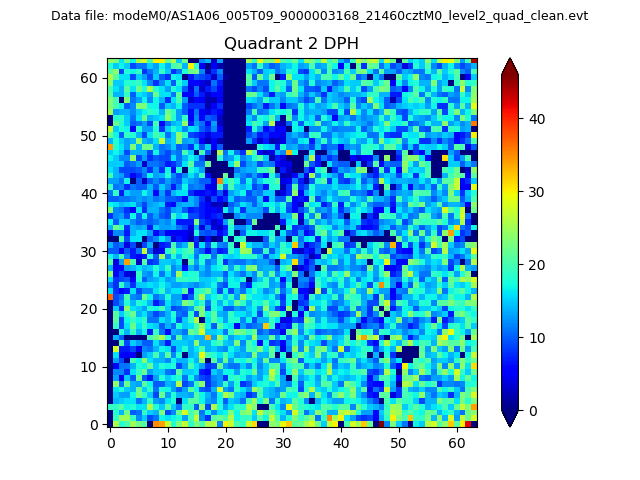
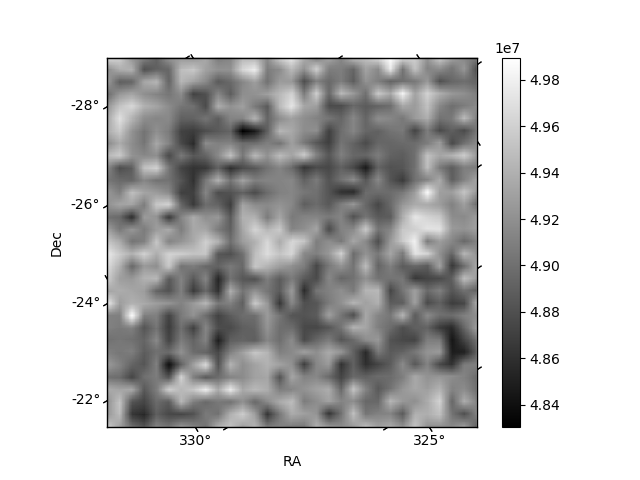
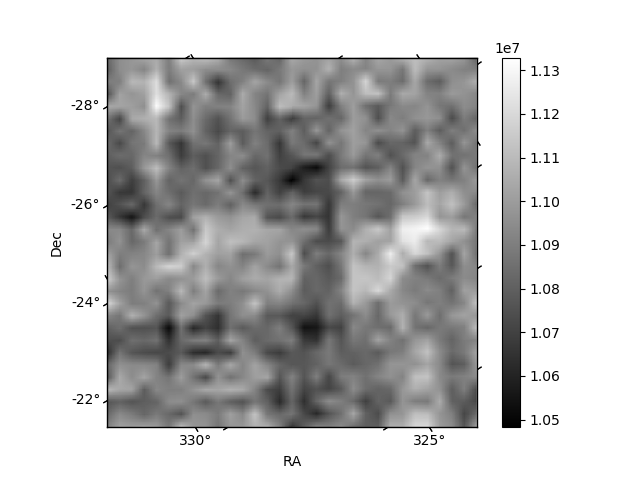
Histogram calculated using DETX and DETY for each event in the final _common_clean file
| Quadrant A | 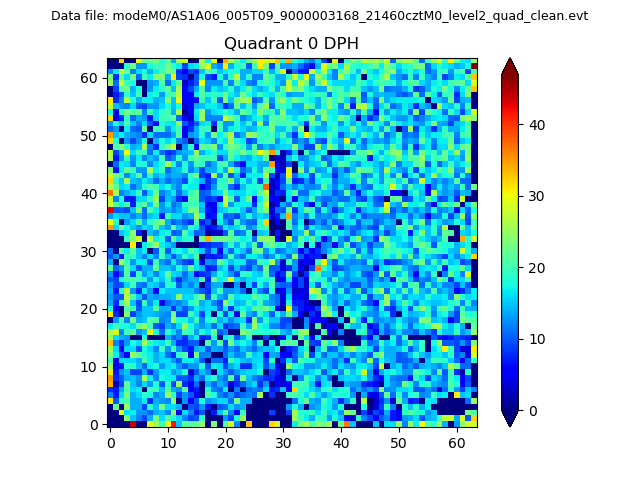 |
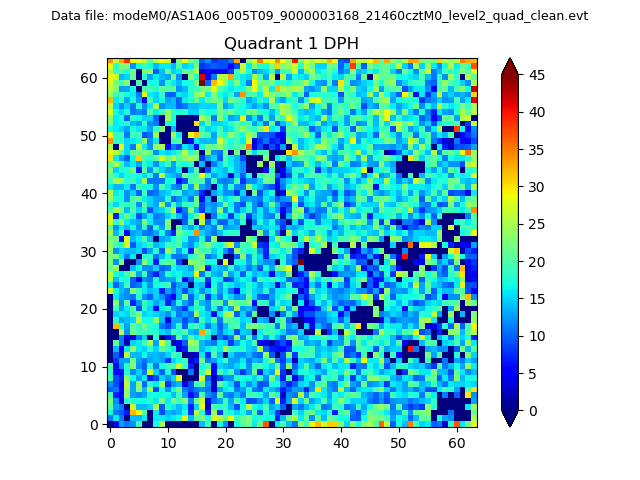 |
Quadrant B |
|---|---|---|---|
| Quadrant D | 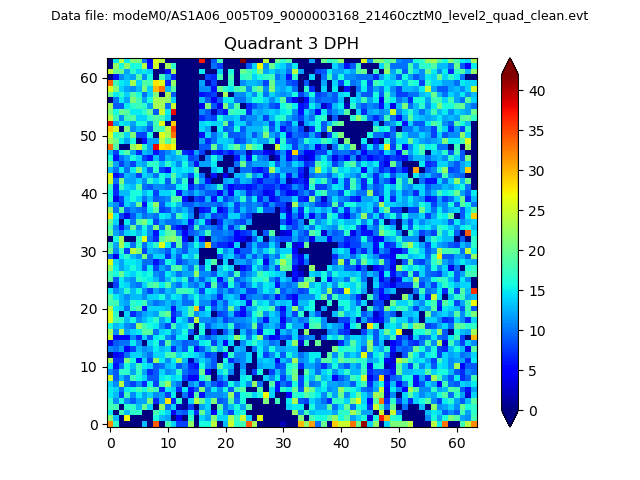 |
 |
Quadrant C |
| Plot type | Count rate plots | Images |
|---|---|---|
| Comparison with Poisson distribution Blue bars denote a histogram of data divided into 1 sec bins. Red curve is a Poisson curve with rate = median count rate of data. |
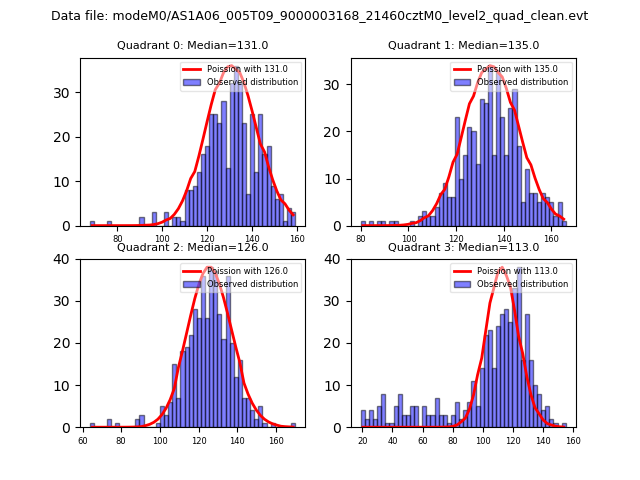 |
 |
| Quadrant-wise count rates Data is divided into 100 sec bins |
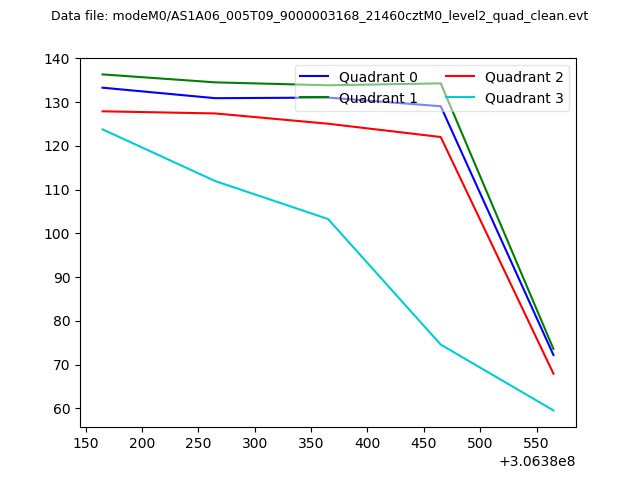 |
|
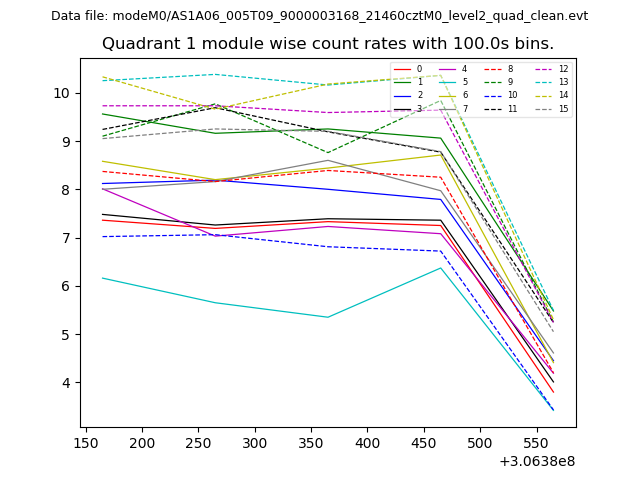
| Module-wise count rates for Quadrant A Data is divided into 100 sec bins |
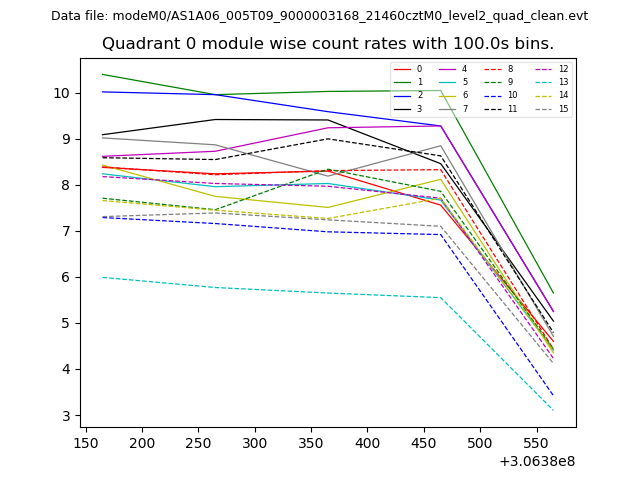 |
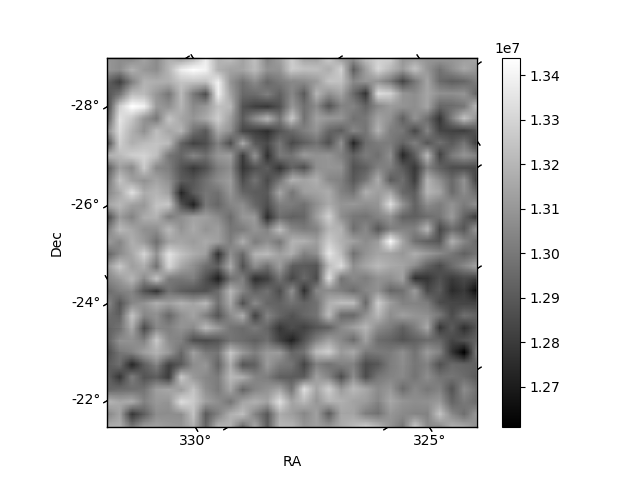 |
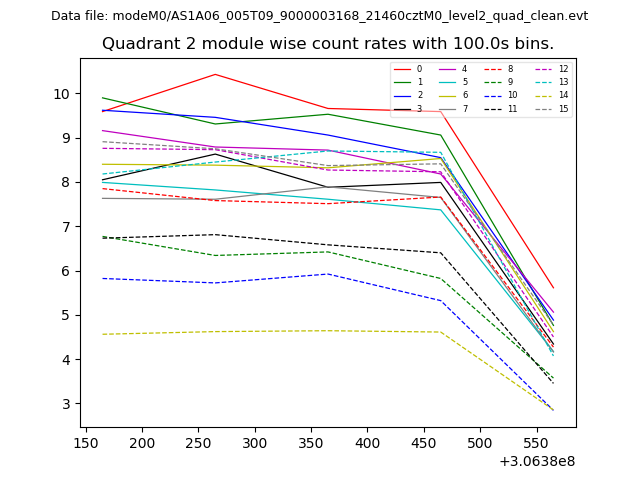
| Module-wise count rates for Quadrant B Data is divided into 100 sec bins |
 |
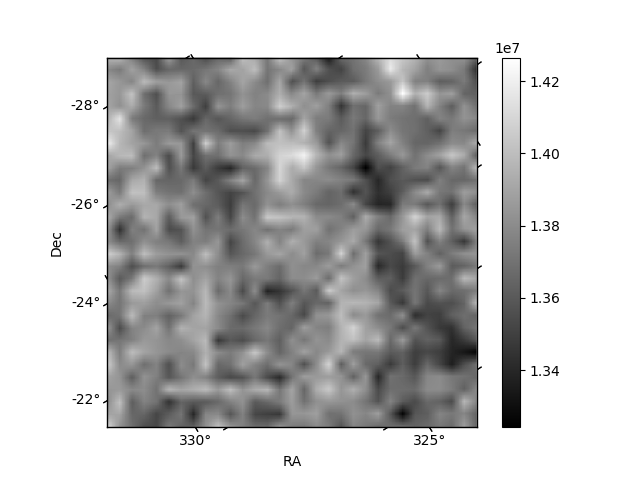 |
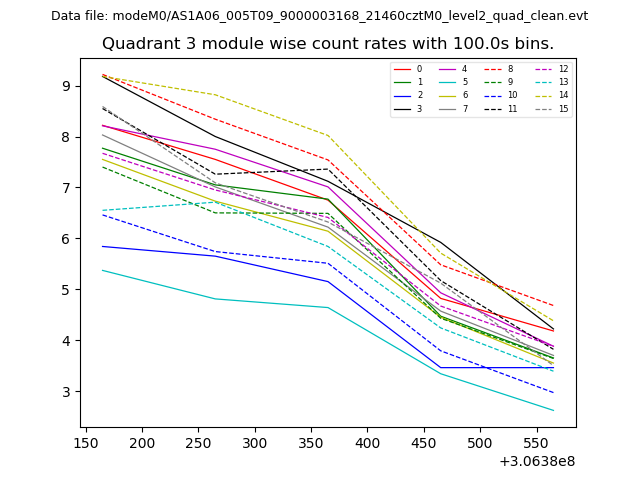
| Module-wise count rates for Quadrant C Data is divided into 100 sec bins |
 |
 |
| Module-wise count rates for Quadrant D Data is divided into 100 sec bins |
 |
 |
| Parameter | Plot |
|---|---|
| CZT HV Monitor | 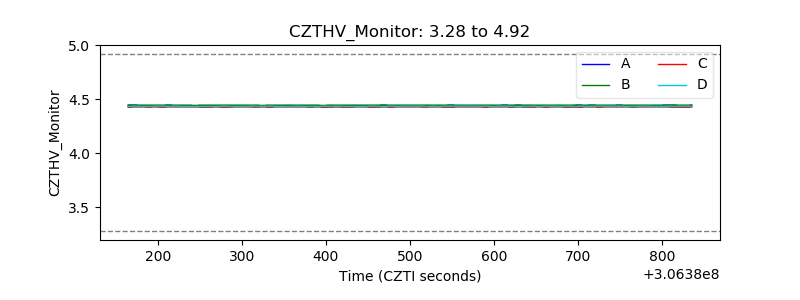 |
| D_VDD | 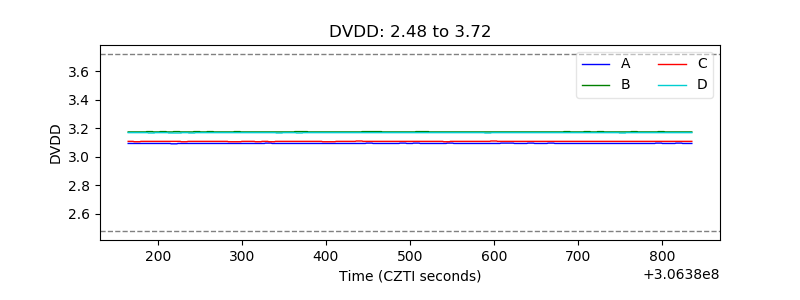 |
| Temperature 1 | 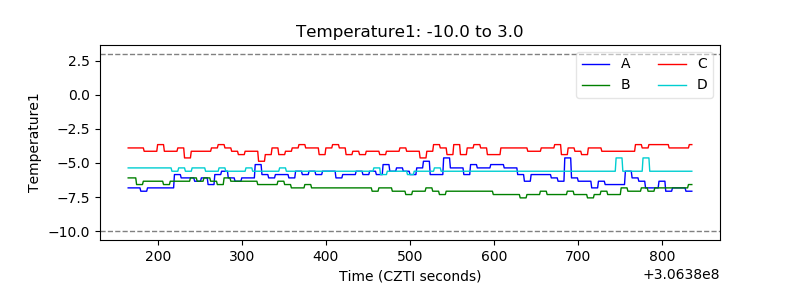 |
| Veto HV Monitor |  |
| Veto LLD | 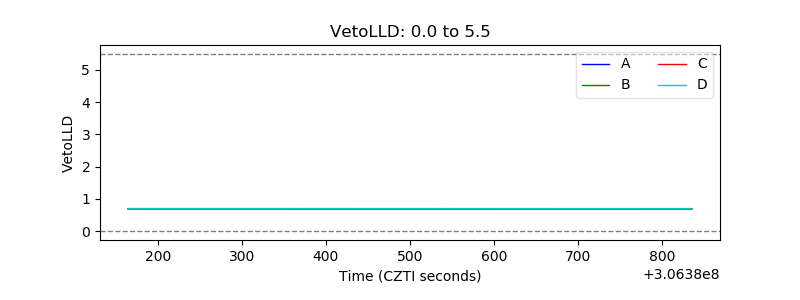 |
| Alpha Counter |  |
| _CPM_Rate |  |
| CZT Counter | 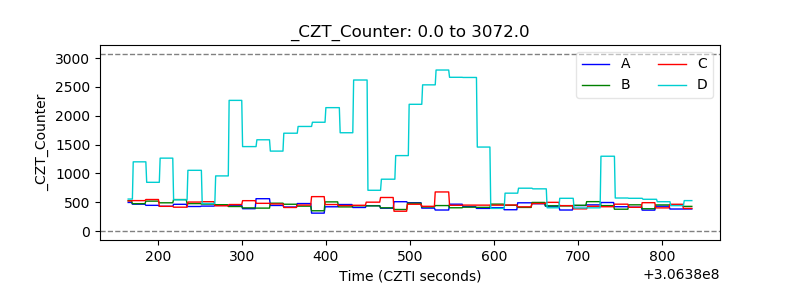 |
| +2.5 Volts monitor |  |
| +5 Volts monitor |  |
| _ROLL_ROT | 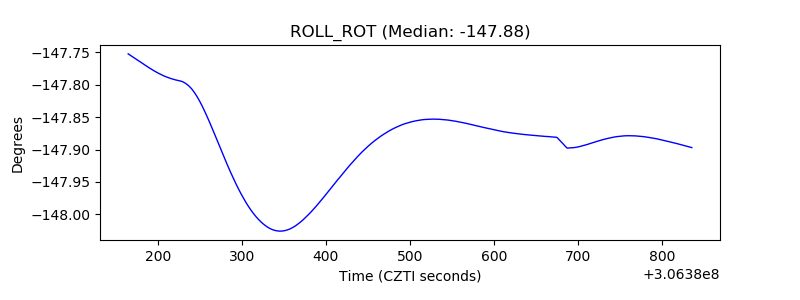 |
| _Roll_DEC | 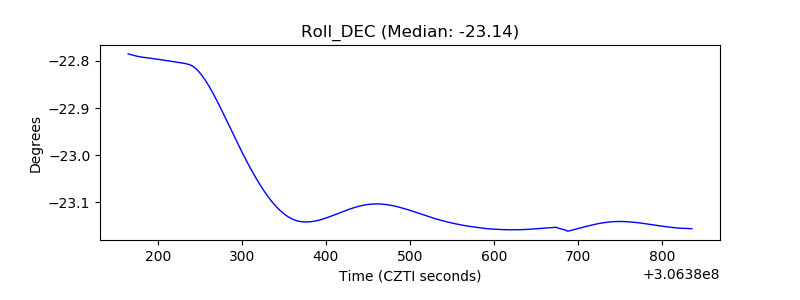 |
| _Roll_RA | 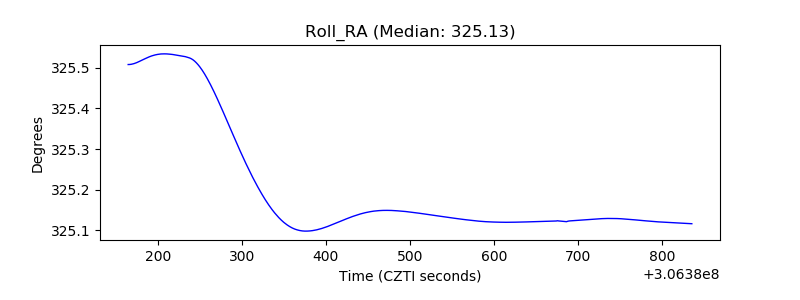 |
| Veto Counter | 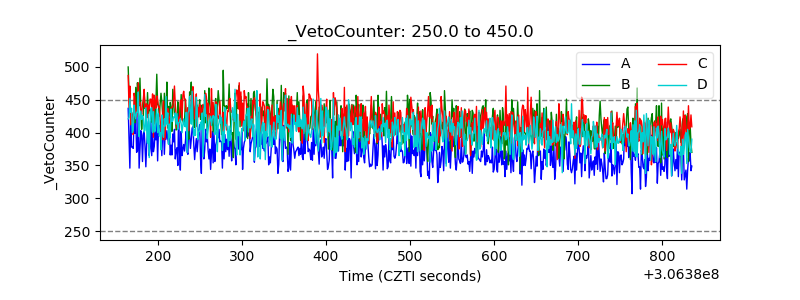 |