| Param | Original file | Final file |
|---|---|---|
| Filename | modeM0/AS1A06_005T09_9000003168_21464cztM0_level2.evt | modeM0/AS1A06_005T09_9000003168_21464cztM0_level2_quad_clean.evt |
| Size (bytes) | 499,993,920 | 69,096,960 |
| Size | 476.8 MB | 65.9 MB |
| Events in quadrant A | 3,355,651 | 414,714 |
| Events in quadrant B | 3,534,330 | 426,807 |
| Events in quadrant C | 3,464,656 | 413,331 |
| Events in quadrant D | 4,357,625 | 394,793 |
| Mode SS | |||
|---|---|---|---|
| Quadrant | BADHDUFLAG | Total packets | Discarded packets |
| A | 0 | 132 | 0 |
| B | 0 | 132 | 0 |
| C | 0 | 132 | 0 |
| D | 0 | 132 | 0 |
| Mode M9 | |||
|---|---|---|---|
| Quadrant | BADHDUFLAG | Total packets | Discarded packets |
| A | 0 | 24 | 0 |
| B | 0 | 24 | 0 |
| C | 0 | 24 | 0 |
| D | 0 | 24 | 0 |
| Mode M0 | |||
|---|---|---|---|
| Quadrant | BADHDUFLAG | Total packets | Discarded packets |
| A | 0 | 13721 | 2 |
| B | 0 | 14331 | 2 |
| C | 0 | 14183 | 2 |
| D | 0 | 17055 | 2 |
| Quadrant | Total seconds | Saturated seconds | Saturation percentage |
|---|---|---|---|
| A | 6336 | 48 | 0.757576% |
| B | 6337 | 83 | 1.309768% |
| C | 6337 | 116 | 1.830519% |
| D | 6337 | 170 | 2.682657% |
Noise dominated data is calculated using 1-second bins in cleaned event files. If a bin has >2000 counts, and if more than 50% of those come from <1% of pixels, then it is considered to be noise-dominated and hence unusable.
| Quadrant | # 1 sec bins | Bins with >0 counts | Bins with >2000 counts | High rate bins dominated by noise | Noise dominated (total time) | Noise dominated (detector-on time) | Marked lightcurve |
|---|---|---|---|---|---|---|---|
| A | 8791 | 6336 | 0 | 0 | 0.00% | 0.00% | 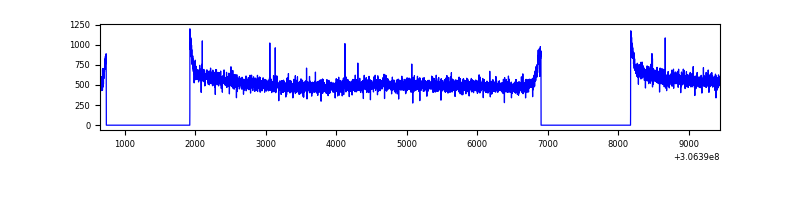 |
| B | 8792 | 6337 | 1 | 1 | 0.01% | 0.02% | 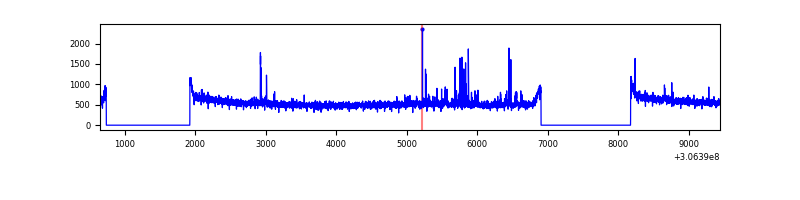 |
| C | 8792 | 6337 | 0 | 0 | 0.00% | 0.00% | 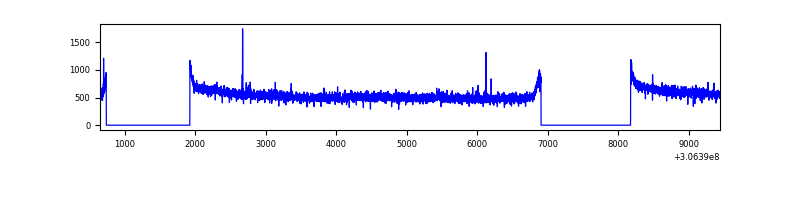 |
| D | 8792 | 6337 | 122 | 122 | 1.39% | 1.93% | 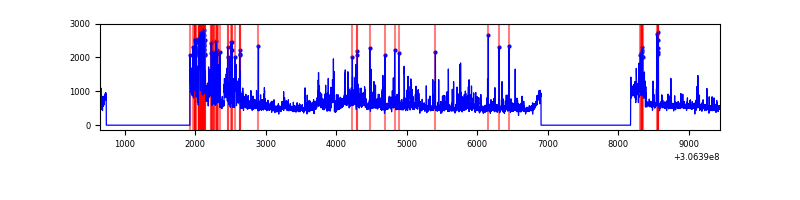 |
Top three noisy pixels from each quadrant. If the there are fewer than three noisy pixels in the level2.evt file, extra rows are filled as -1
| Pixel properties | Quadrant properties | ||||||
|---|---|---|---|---|---|---|---|
| Quadrant | DetID | PixID | Counts | Sigma | Mean | Median | Sigma |
| A | 11 | 47 | 19809 | 110.75 | 866 | 850 | 171.2 |
| A | 13 | 254 | 8685 | 45.77 | 866 | 850 | 171.2 |
| A | 0 | 226 | 7306 | 37.71 | 866 | 850 | 171.2 |
| B | 0 | 197 | 51658 | 312.49 | 873 | 853 | 162.6 |
| B | 0 | 230 | 26332 | 156.71 | 873 | 853 | 162.6 |
| B | 0 | 190 | 26302 | 156.53 | 873 | 853 | 162.6 |
| C | 14 | 238 | 136926 | 704.42 | 847 | 858 | 193.2 |
| C | 3 | 233 | 20171 | 99.98 | 847 | 858 | 193.2 |
| C | 13 | 61 | 5962 | 26.42 | 847 | 858 | 193.2 |
| D | 1 | 20 | 448064 | 2225.23 | 844 | 824 | 201.0 |
| D | 13 | 174 | 436376 | 2167.08 | 844 | 824 | 201.0 |
| D | 1 | 52 | 156633 | 775.22 | 844 | 824 | 201.0 |
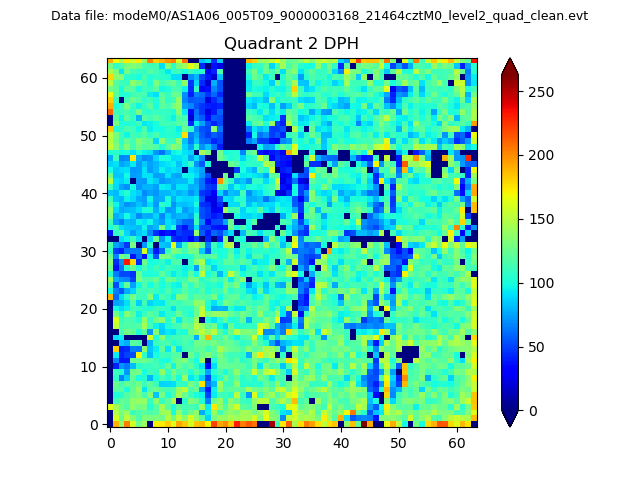
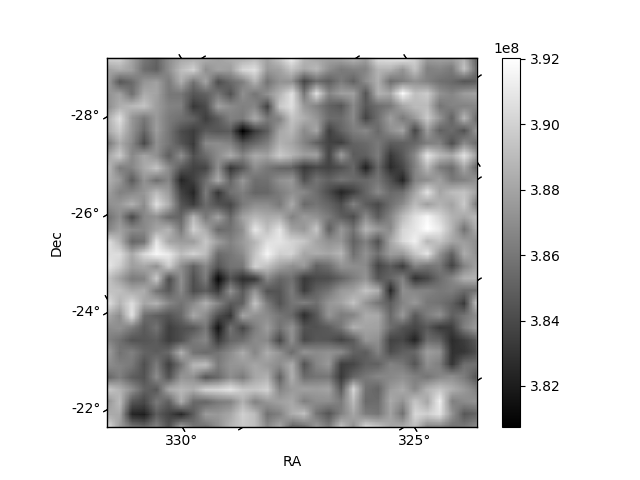
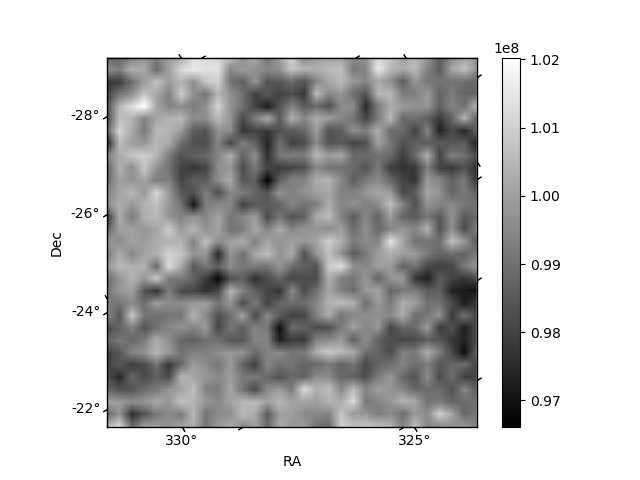
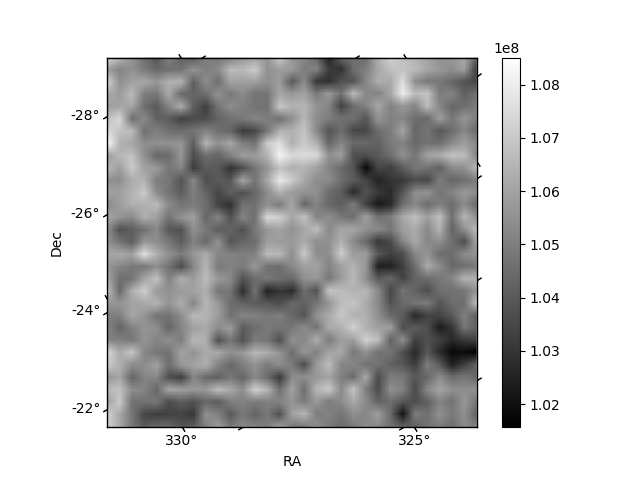
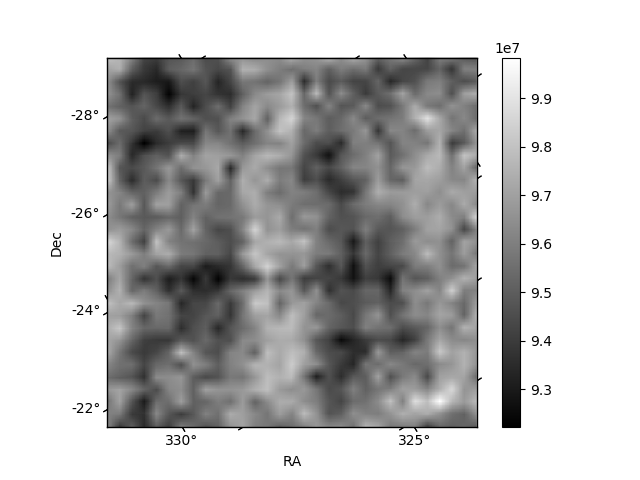
Histogram calculated using DETX and DETY for each event in the final _common_clean file
| Quadrant A | 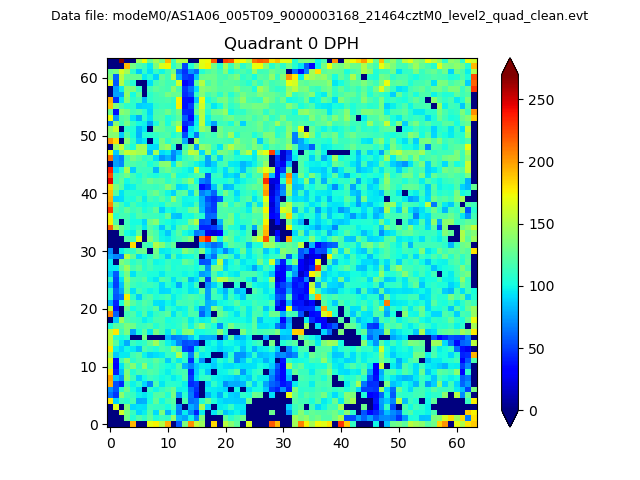 |
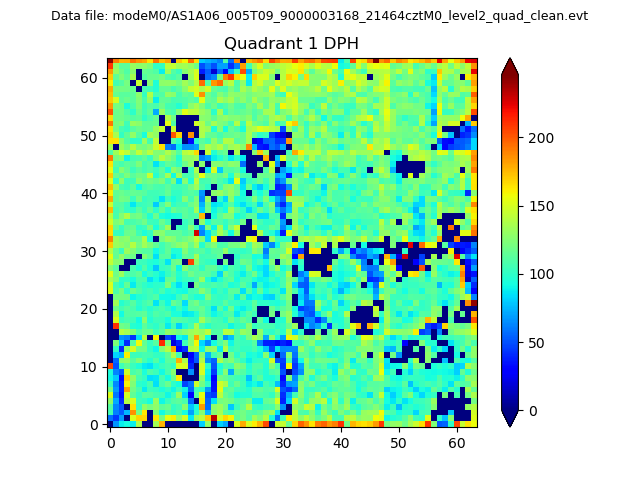 |
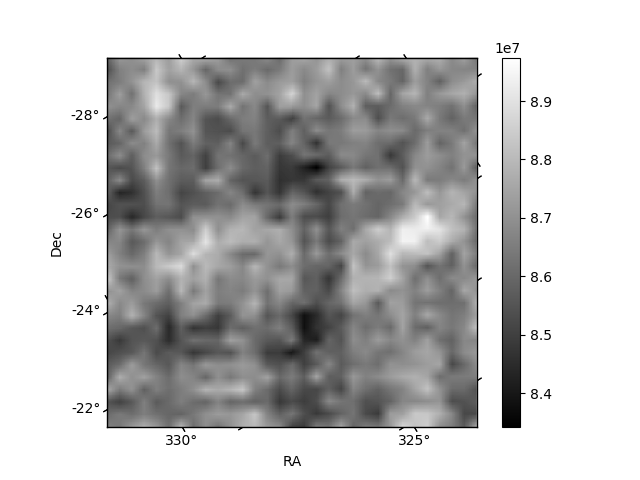
Quadrant B |
|---|---|---|---|
| Quadrant D | 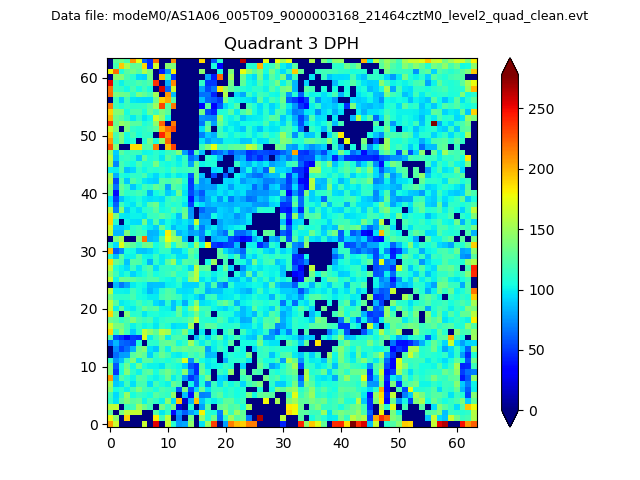 |
 |
Quadrant C |
| Plot type | Count rate plots | Images |
|---|---|---|
| Comparison with Poisson distribution Blue bars denote a histogram of data divided into 1 sec bins. Red curve is a Poisson curve with rate = median count rate of data. |
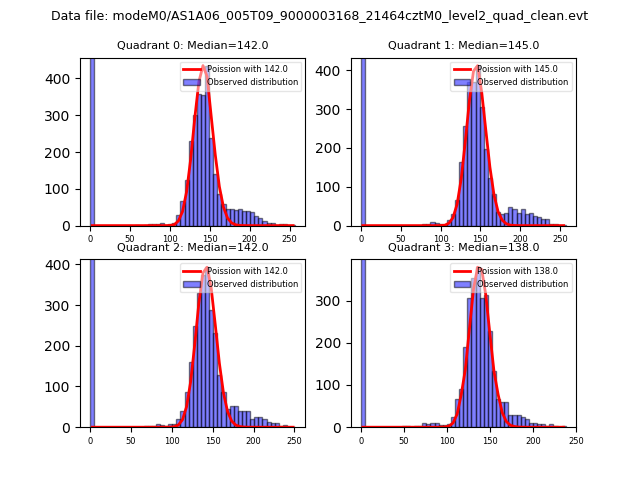 |
 |
| Quadrant-wise count rates Data is divided into 100 sec bins |
 |
|
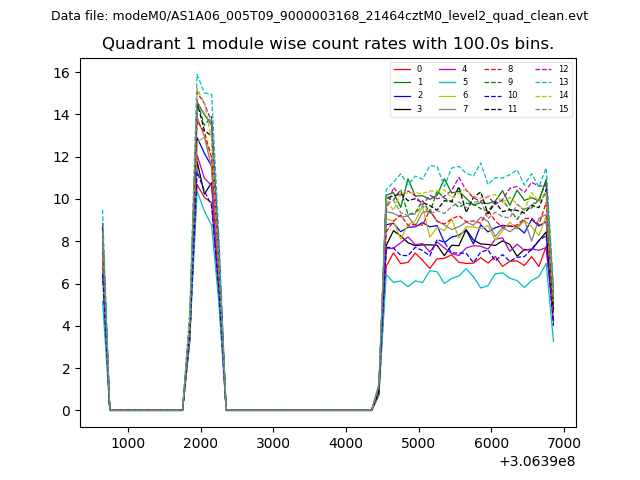
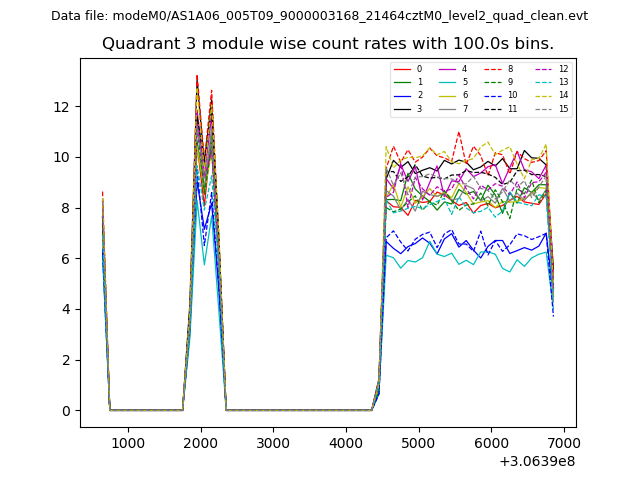
| Module-wise count rates for Quadrant A Data is divided into 100 sec bins |
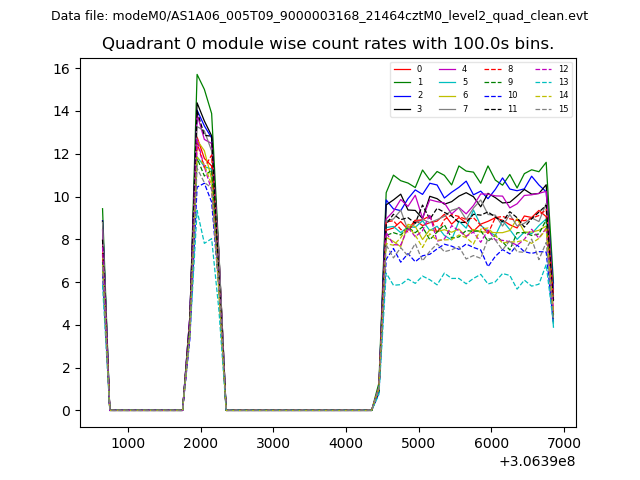 |
 |
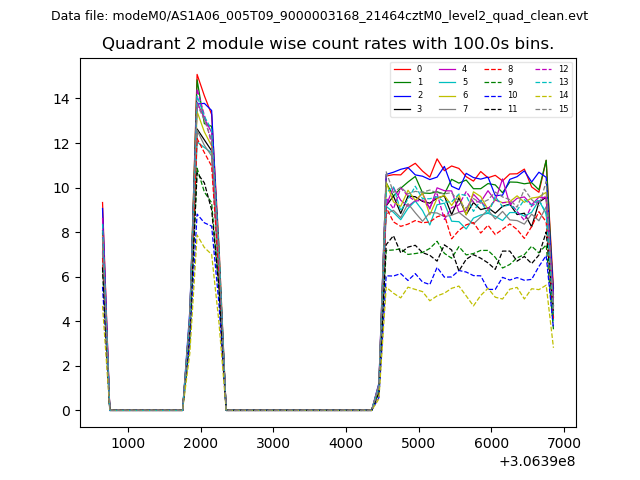
| Module-wise count rates for Quadrant B Data is divided into 100 sec bins |
 |
 |
| Module-wise count rates for Quadrant C Data is divided into 100 sec bins |
 |
 |
| Module-wise count rates for Quadrant D Data is divided into 100 sec bins |
 |
 |
| Parameter | Plot |
|---|---|
| CZT HV Monitor | 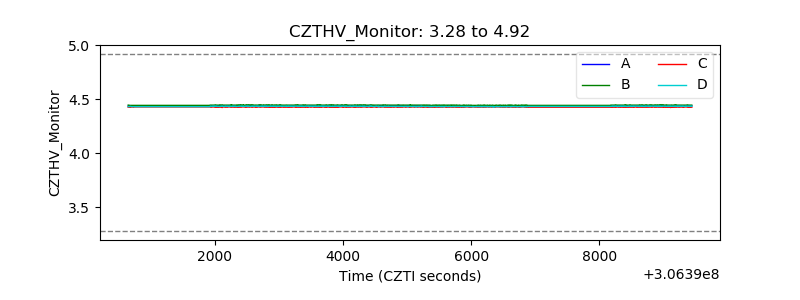 |
| D_VDD | 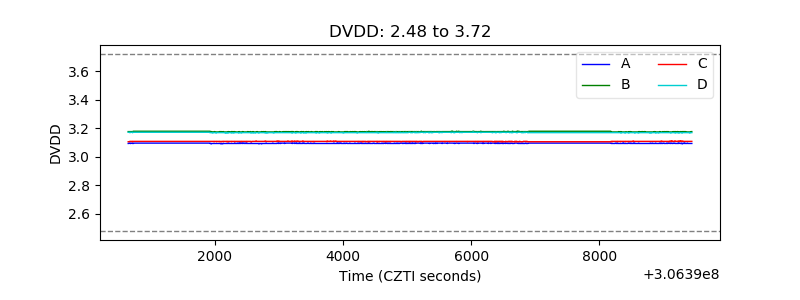 |
| Temperature 1 | 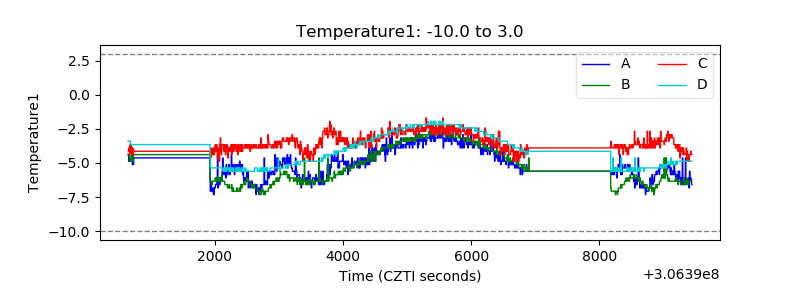 |
| Veto HV Monitor | 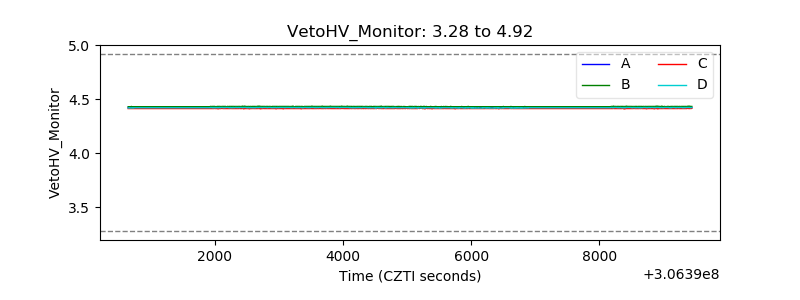 |
| Veto LLD | 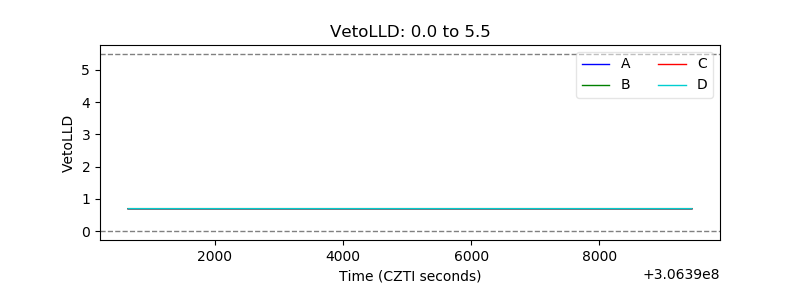 |
| Alpha Counter | 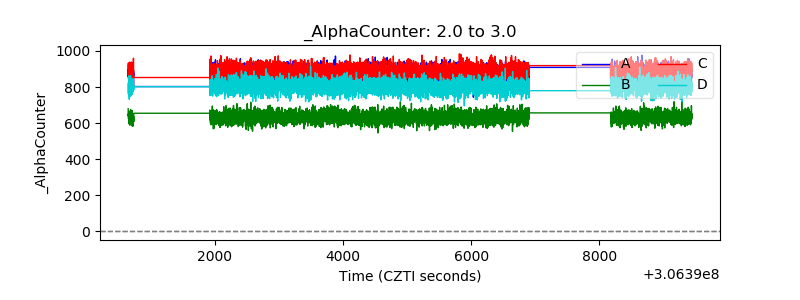 |
| _CPM_Rate | 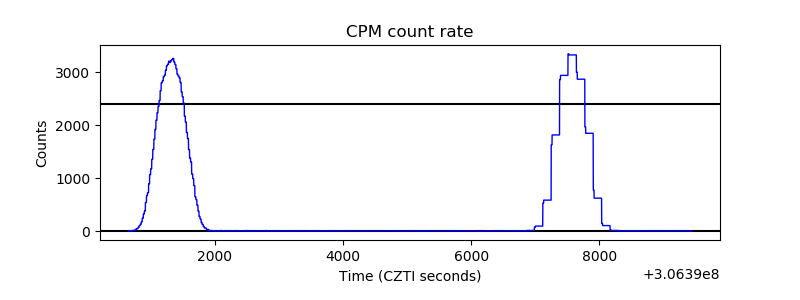 |
| CZT Counter | 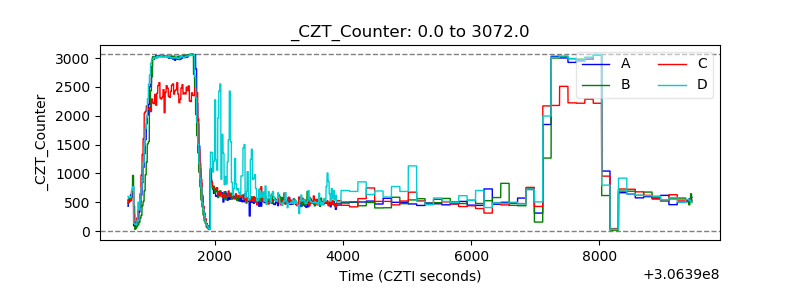 |
| +2.5 Volts monitor |  |
| +5 Volts monitor |  |
| _ROLL_ROT | 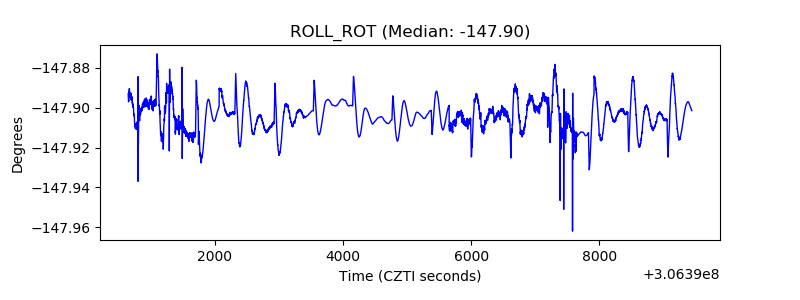 |
| _Roll_DEC | 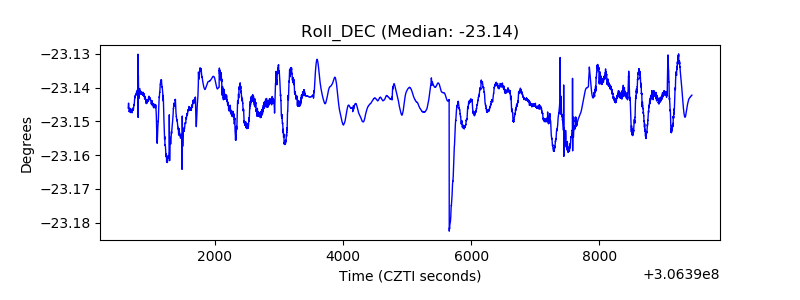 |
| _Roll_RA | 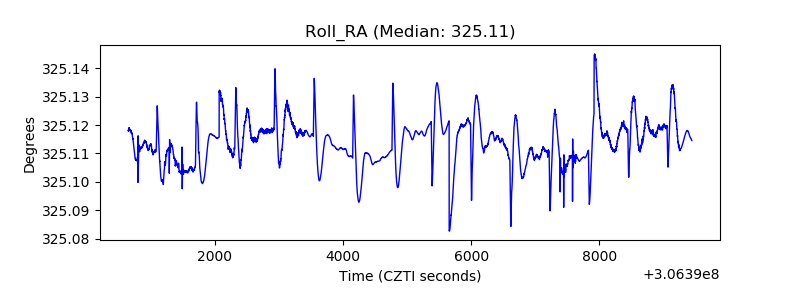 |
| Veto Counter | 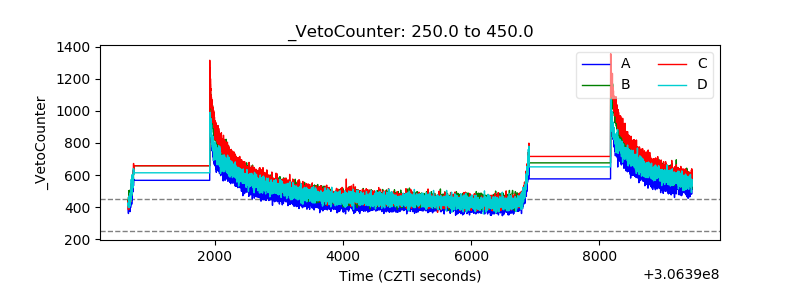 |