| Param | Original file | Final file |
|---|---|---|
| Filename | modeM0/AS1A06_005T09_9000003168_21465cztM0_level2.evt | modeM0/AS1A06_005T09_9000003168_21465cztM0_level2_quad_clean.evt |
| Size (bytes) | 499,656,960 | 66,058,560 |
| Size | 476.5 MB | 63.0 MB |
| Events in quadrant A | 3,446,585 | 392,949 |
| Events in quadrant B | 3,665,790 | 403,544 |
| Events in quadrant C | 3,484,093 | 391,888 |
| Events in quadrant D | 4,118,508 | 382,022 |
| Mode SS | |||
|---|---|---|---|
| Quadrant | BADHDUFLAG | Total packets | Discarded packets |
| A | 0 | 126 | 0 |
| B | 0 | 126 | 0 |
| C | 0 | 126 | 0 |
| D | 0 | 126 | 0 |
| Mode M9 | |||
|---|---|---|---|
| Quadrant | BADHDUFLAG | Total packets | Discarded packets |
| A | 0 | 20 | 0 |
| B | 0 | 21 | 0 |
| C | 0 | 21 | 0 |
| D | 0 | 21 | 0 |
| Mode M0 | |||
|---|---|---|---|
| Quadrant | BADHDUFLAG | Total packets | Discarded packets |
| A | 0 | 13918 | 2 |
| B | 0 | 14710 | 2 |
| C | 0 | 14249 | 2 |
| D | 0 | 16266 | 4 |
| Quadrant | Total seconds | Saturated seconds | Saturation percentage |
|---|---|---|---|
| A | 6152 | 62 | 1.007802% |
| B | 6152 | 97 | 1.576723% |
| C | 6152 | 120 | 1.950585% |
| D | 6151 | 79 | 1.284344% |
Noise dominated data is calculated using 1-second bins in cleaned event files. If a bin has >2000 counts, and if more than 50% of those come from <1% of pixels, then it is considered to be noise-dominated and hence unusable.
| Quadrant | # 1 sec bins | Bins with >0 counts | Bins with >2000 counts | High rate bins dominated by noise | Noise dominated (total time) | Noise dominated (detector-on time) | Marked lightcurve |
|---|---|---|---|---|---|---|---|
| A | 7482 | 6152 | 0 | 0 | 0.00% | 0.00% | 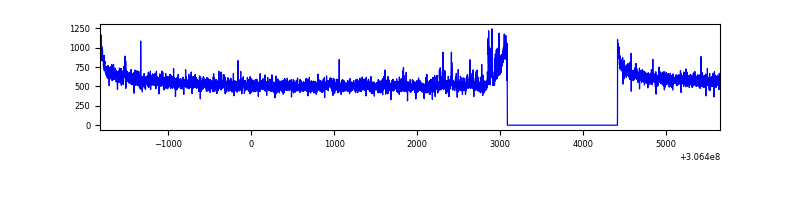 |
| B | 7482 | 6152 | 10 | 10 | 0.13% | 0.16% | 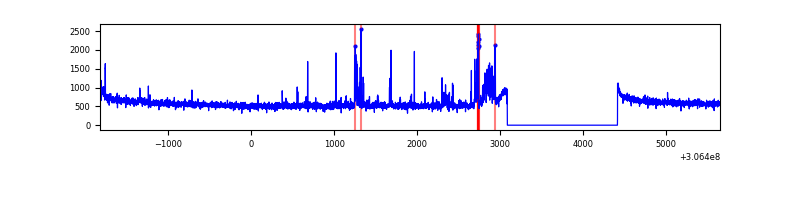 |
| C | 7482 | 6152 | 0 | 0 | 0.00% | 0.00% | 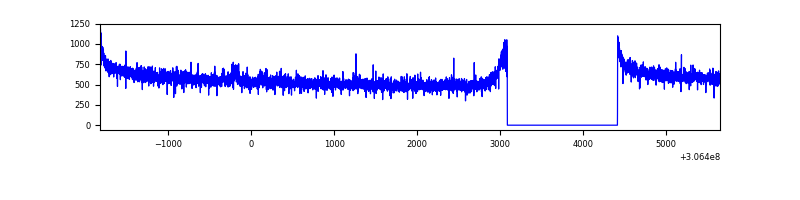 |
| D | 7481 | 6151 | 29 | 29 | 0.39% | 0.47% | 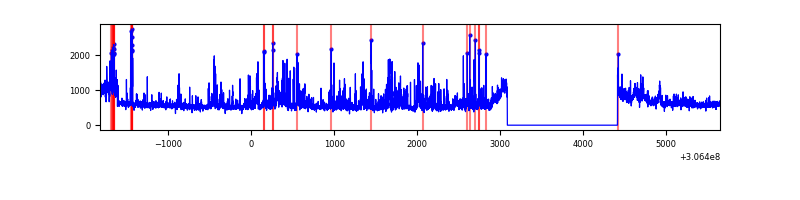 |
Top three noisy pixels from each quadrant. If the there are fewer than three noisy pixels in the level2.evt file, extra rows are filled as -1
| Pixel properties | Quadrant properties | ||||||
|---|---|---|---|---|---|---|---|
| Quadrant | DetID | PixID | Counts | Sigma | Mean | Median | Sigma |
| A | 11 | 47 | 80544 | 461.76 | 874 | 861 | 172.6 |
| A | 13 | 254 | 8434 | 43.89 | 874 | 861 | 172.6 |
| A | 0 | 226 | 7469 | 38.29 | 874 | 861 | 172.6 |
| B | 0 | 197 | 186436 | 1136.47 | 878 | 858 | 163.3 |
| B | 0 | 190 | 24199 | 142.94 | 878 | 858 | 163.3 |
| B | 0 | 230 | 22697 | 133.74 | 878 | 858 | 163.3 |
| C | 14 | 238 | 136980 | 704.91 | 849 | 858 | 193.1 |
| C | 3 | 233 | 37131 | 187.84 | 849 | 858 | 193.1 |
| C | 13 | 61 | 5971 | 26.48 | 849 | 858 | 193.1 |
| D | 13 | 174 | 425387 | 2082.58 | 855 | 835 | 203.9 |
| D | 1 | 20 | 232723 | 1137.49 | 855 | 835 | 203.9 |
| D | 1 | 52 | 139816 | 681.75 | 855 | 835 | 203.9 |
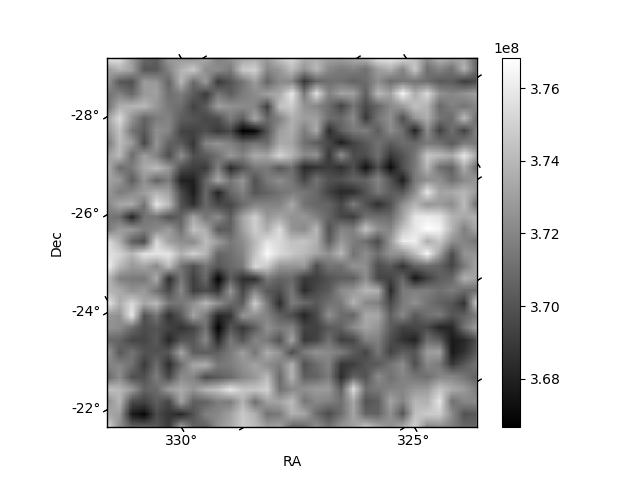
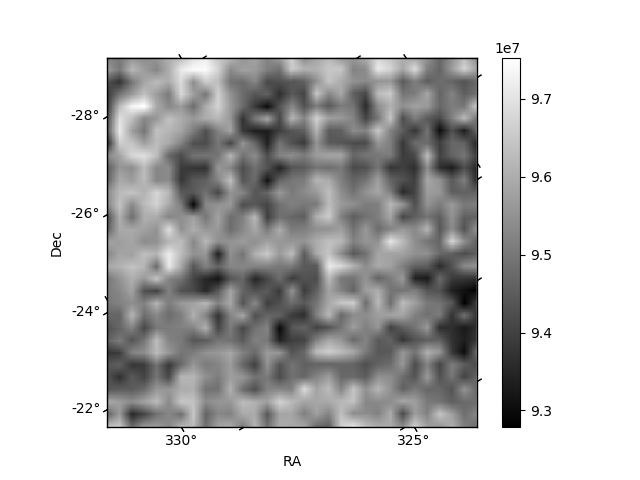
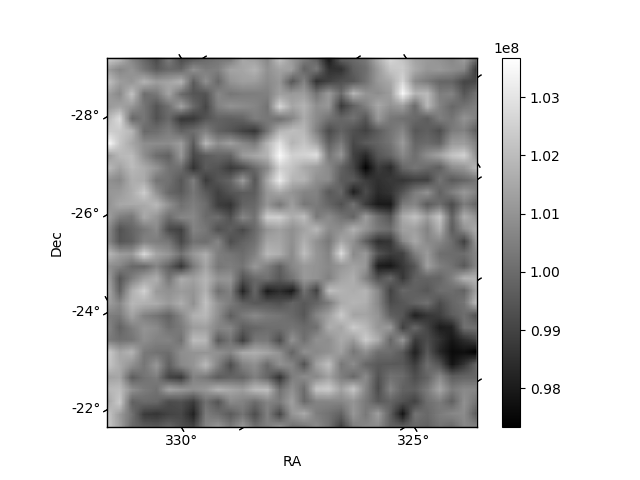
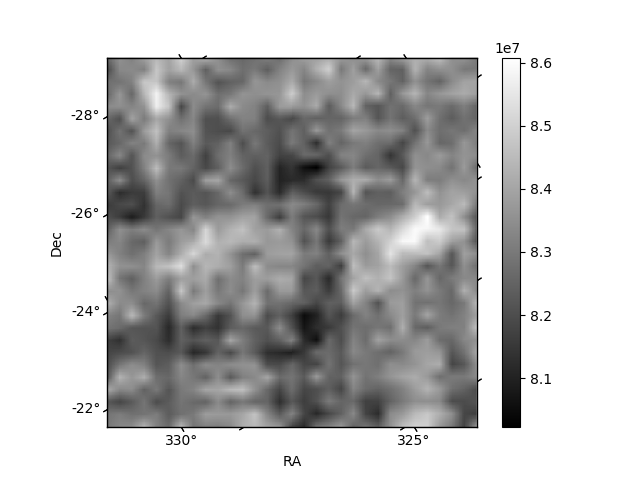
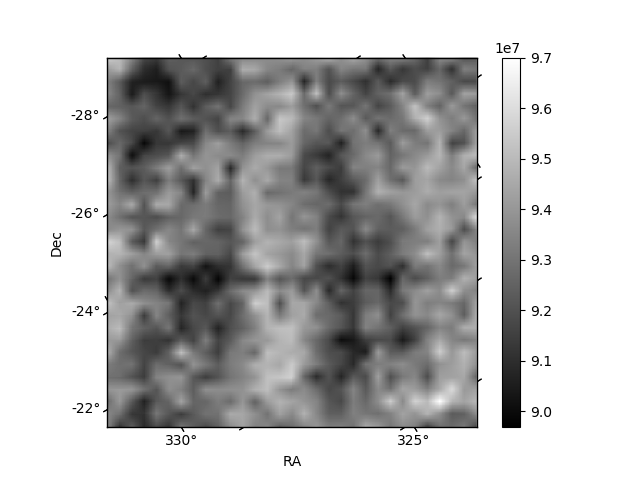
Histogram calculated using DETX and DETY for each event in the final _common_clean file
| Quadrant A | 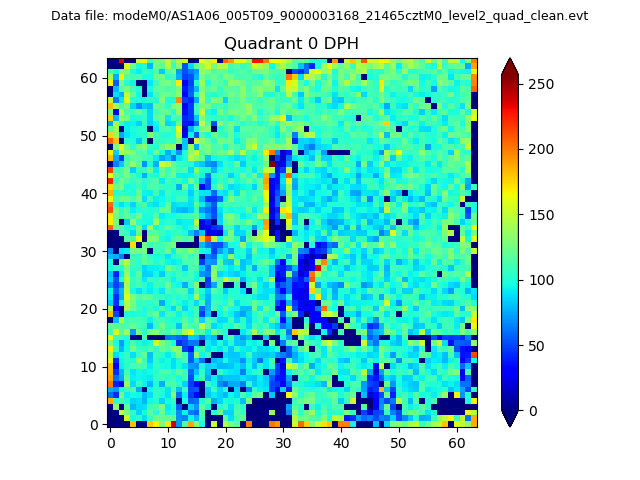 |
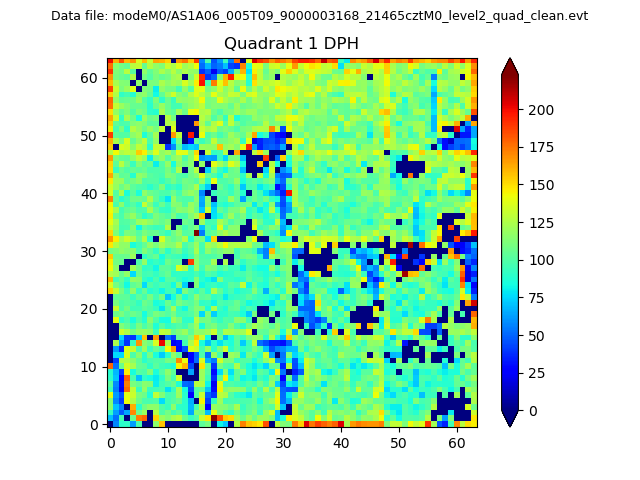 |
Quadrant B |
|---|---|---|---|
| Quadrant D |  |
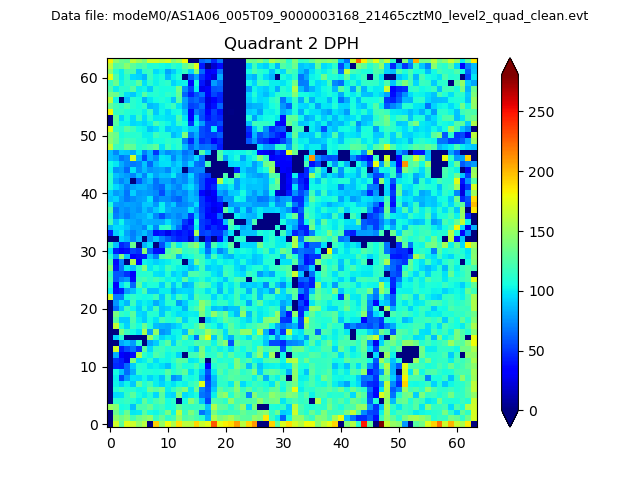 |
Quadrant C |
| Plot type | Count rate plots | Images |
|---|---|---|
| Comparison with Poisson distribution Blue bars denote a histogram of data divided into 1 sec bins. Red curve is a Poisson curve with rate = median count rate of data. |
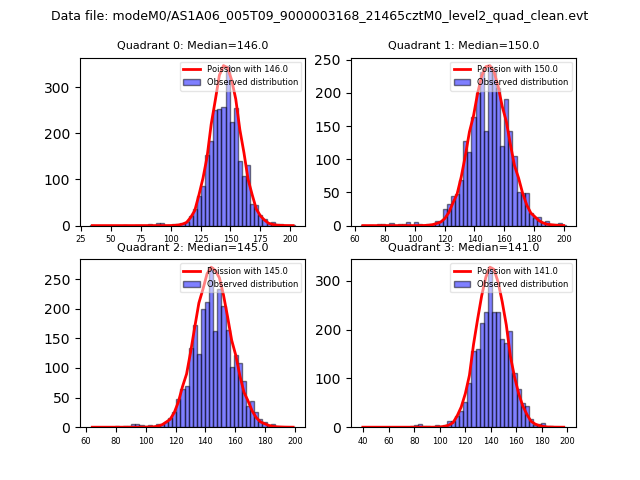 |
 |
| Quadrant-wise count rates Data is divided into 100 sec bins |
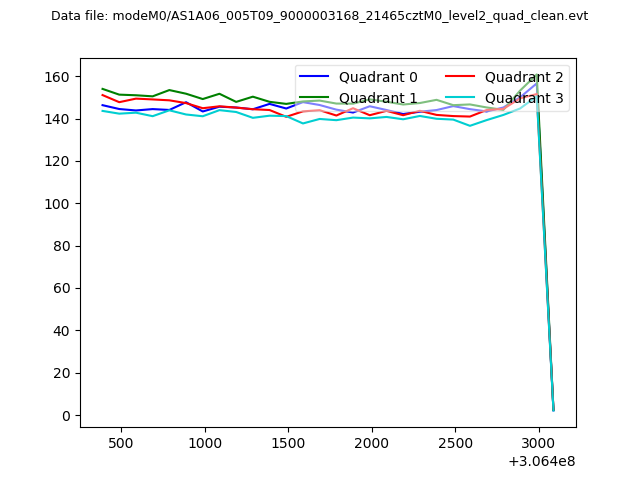 |
|
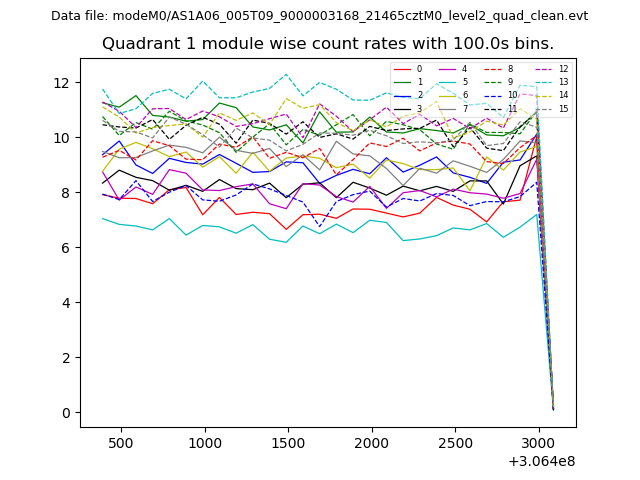
| Module-wise count rates for Quadrant A Data is divided into 100 sec bins |
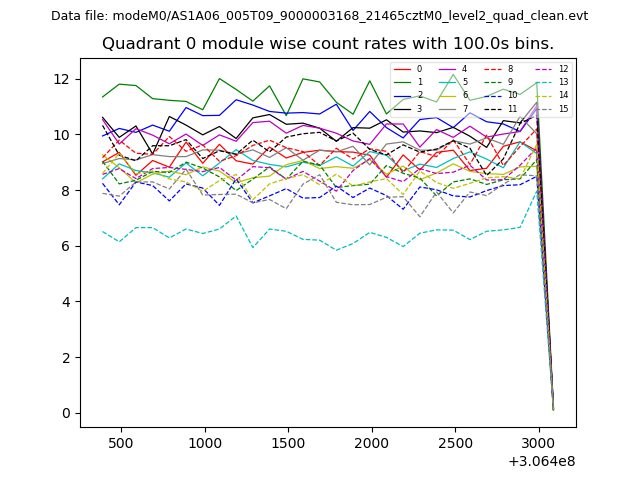 |
 |
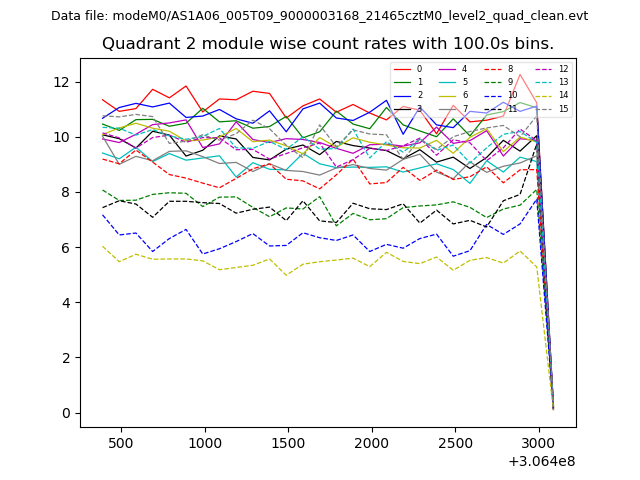
| Module-wise count rates for Quadrant B Data is divided into 100 sec bins |
 |
 |
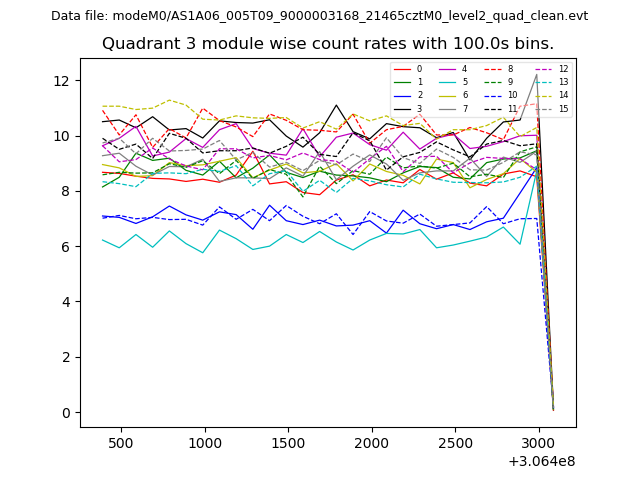
| Module-wise count rates for Quadrant C Data is divided into 100 sec bins |
 |
 |
| Module-wise count rates for Quadrant D Data is divided into 100 sec bins |
 |
 |
| Parameter | Plot |
|---|---|
| CZT HV Monitor | 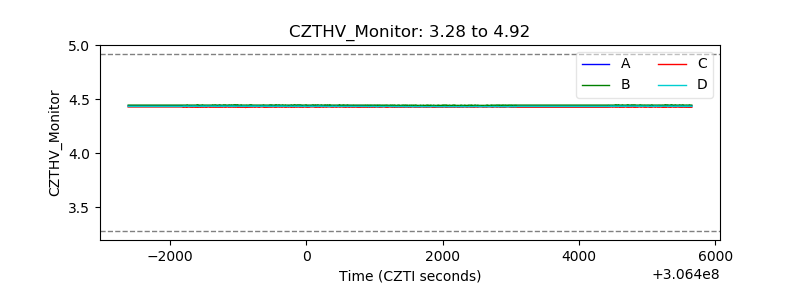 |
| D_VDD | 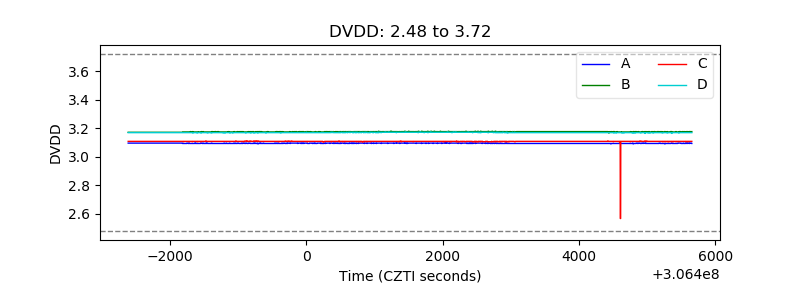 |
| Temperature 1 | 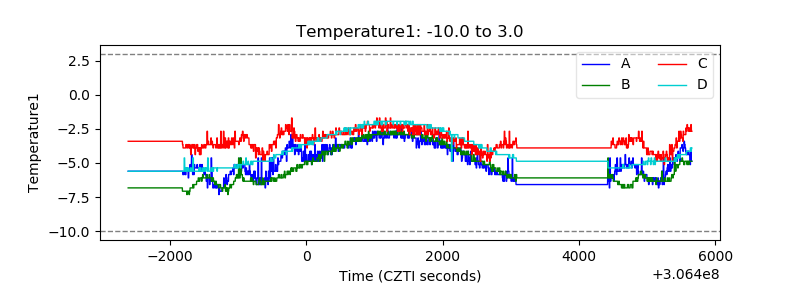 |
| Veto HV Monitor | 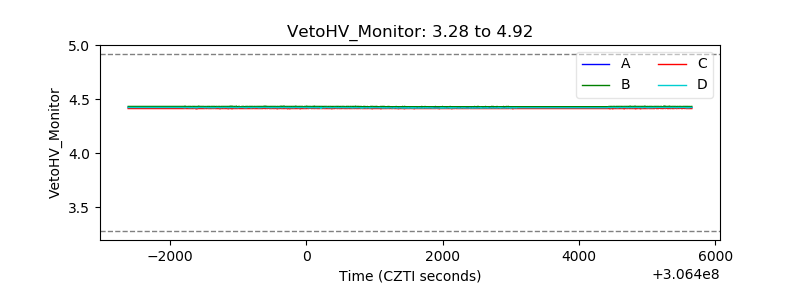 |
| Veto LLD | 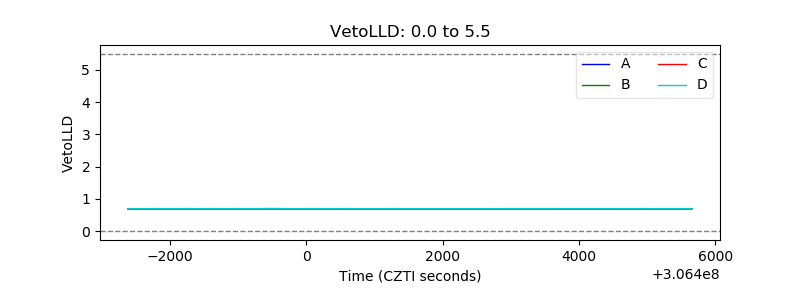 |
| Alpha Counter | 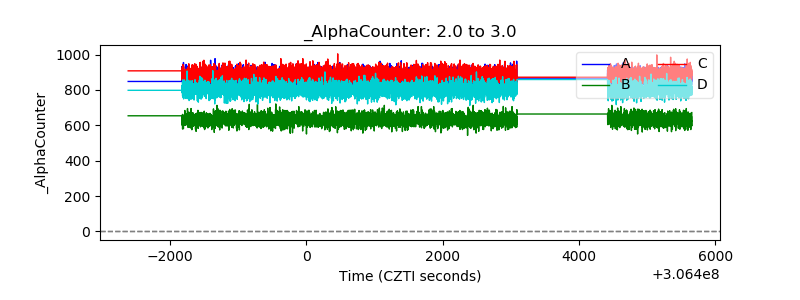 |
| _CPM_Rate | 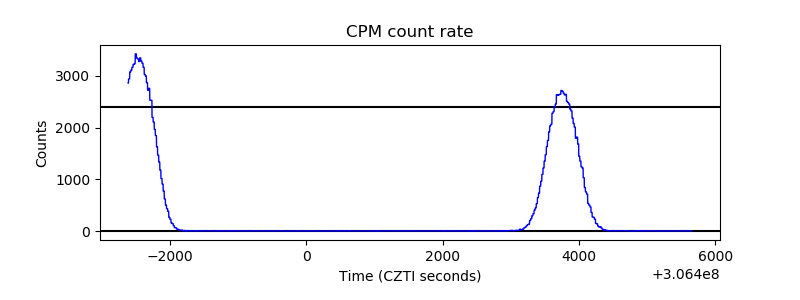 |
| CZT Counter | 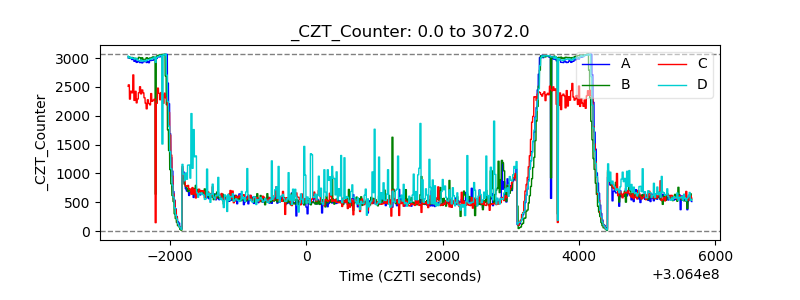 |
| +2.5 Volts monitor | 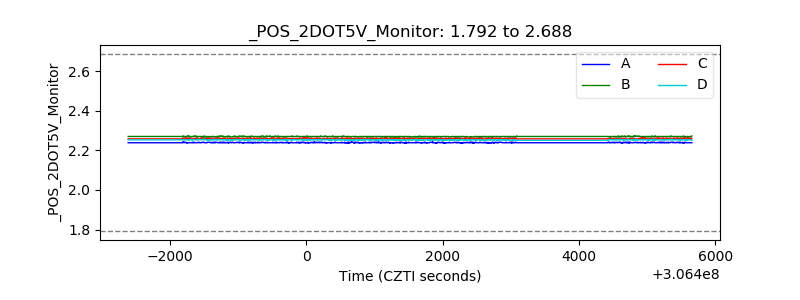 |
| +5 Volts monitor |  |
| _ROLL_ROT | 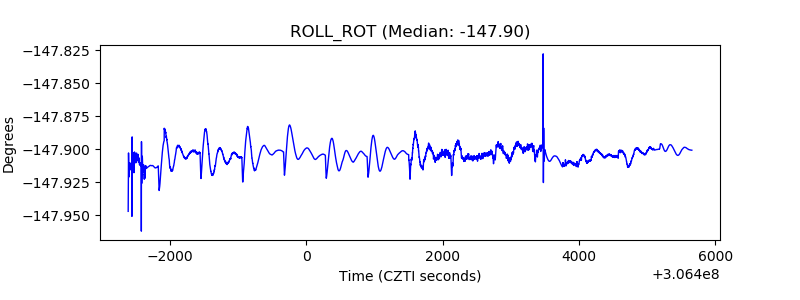 |
| _Roll_DEC | 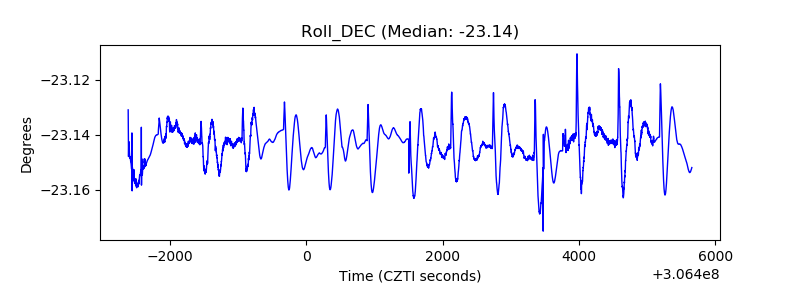 |
| _Roll_RA | 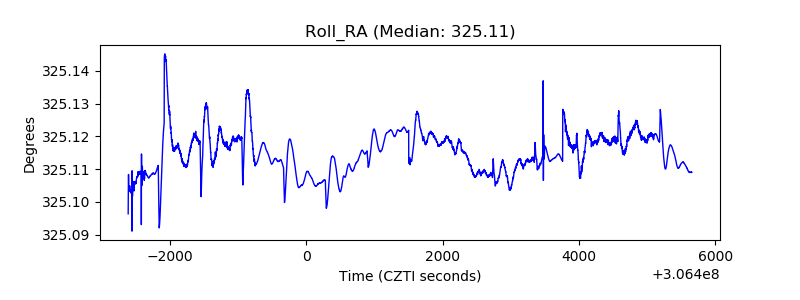 |
| Veto Counter | 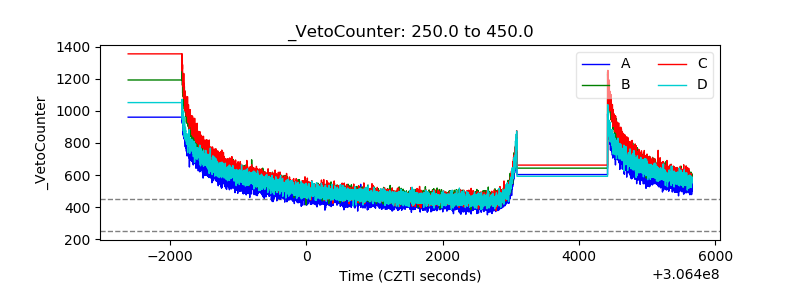 |