| Param | Original file | Final file |
|---|---|---|
| Filename | modeM0/AS1A06_005T09_9000003168_21466cztM0_level2.evt | modeM0/AS1A06_005T09_9000003168_21466cztM0_level2_quad_clean.evt |
| Size (bytes) | 409,944,960 | 70,894,080 |
| Size | 391.0 MB | 67.6 MB |
| Events in quadrant A | 2,875,668 | 448,313 |
| Events in quadrant B | 2,934,577 | 459,296 |
| Events in quadrant C | 2,855,891 | 442,394 |
| Events in quadrant D | 3,389,896 | 427,121 |
| Mode SS | |||
|---|---|---|---|
| Quadrant | BADHDUFLAG | Total packets | Discarded packets |
| A | 0 | 126 | 16 |
| B | 0 | 126 | 20 |
| C | 0 | 126 | 18 |
| D | 0 | 126 | 22 |
| Mode M9 | |||
|---|---|---|---|
| Quadrant | BADHDUFLAG | Total packets | Discarded packets |
| A | 0 | 19 | 3 |
| B | 0 | 20 | 3 |
| C | 0 | 20 | 3 |
| D | 0 | 20 | 5 |
| Mode M0 | |||
|---|---|---|---|
| Quadrant | BADHDUFLAG | Total packets | Discarded packets |
| A | 0 | 14007 | 2422 |
| B | 0 | 14250 | 2441 |
| C | 0 | 14160 | 2573 |
| D | 0 | 16342 | 3012 |
| Quadrant | Total seconds | Saturated seconds | Saturation percentage |
|---|---|---|---|
| A | 5300 | 56 | 1.056604% |
| B | 5310 | 73 | 1.374765% |
| C | 5270 | 110 | 2.087287% |
| D | 5223 | 87 | 1.665709% |
Noise dominated data is calculated using 1-second bins in cleaned event files. If a bin has >2000 counts, and if more than 50% of those come from <1% of pixels, then it is considered to be noise-dominated and hence unusable.
| Quadrant | # 1 sec bins | Bins with >0 counts | Bins with >2000 counts | High rate bins dominated by noise | Noise dominated (total time) | Noise dominated (detector-on time) | Marked lightcurve |
|---|---|---|---|---|---|---|---|
| A | 7598 | 5621 | 0 | 0 | 0.00% | 0.00% | 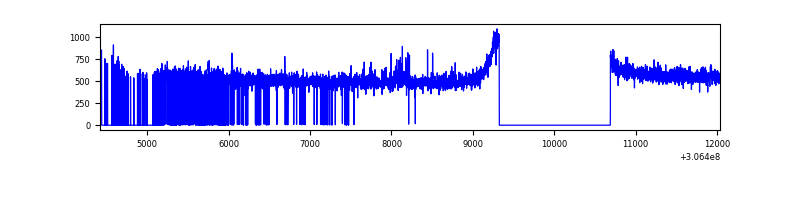 |
| B | 7617 | 5611 | 0 | 0 | 0.00% | 0.00% | 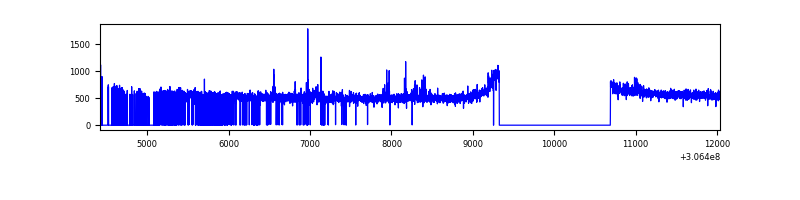 |
| C | 7617 | 5588 | 0 | 0 | 0.00% | 0.00% | 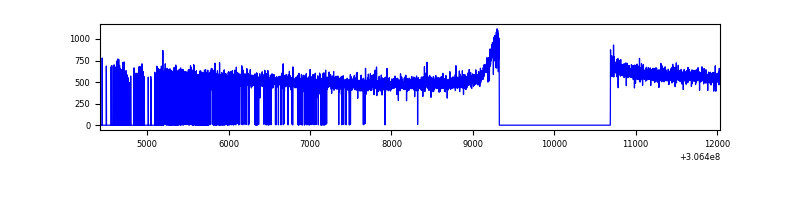 |
| D | 7616 | 5556 | 24 | 24 | 0.32% | 0.43% | 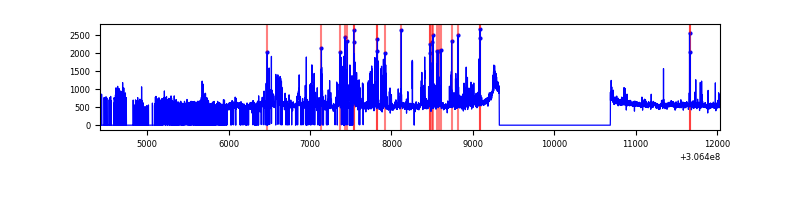 |
Top three noisy pixels from each quadrant. If the there are fewer than three noisy pixels in the level2.evt file, extra rows are filled as -1
| Pixel properties | Quadrant properties | ||||||
|---|---|---|---|---|---|---|---|
| Quadrant | DetID | PixID | Counts | Sigma | Mean | Median | Sigma |
| A | 11 | 47 | 40960 | 274.77 | 736 | 723 | 146.4 |
| A | 13 | 254 | 7372 | 45.41 | 736 | 723 | 146.4 |
| A | 0 | 226 | 6407 | 38.82 | 736 | 723 | 146.4 |
| B | 0 | 230 | 18867 | 131.29 | 736 | 721 | 138.2 |
| B | 0 | 190 | 17646 | 122.45 | 736 | 721 | 138.2 |
| B | 3 | 64 | 17211 | 119.31 | 736 | 721 | 138.2 |
| C | 14 | 238 | 113259 | 702.49 | 703 | 713 | 160.2 |
| C | 13 | 61 | 4848 | 25.81 | 703 | 713 | 160.2 |
| C | 10 | 91 | 3876 | 19.74 | 703 | 713 | 160.2 |
| D | 13 | 174 | 356303 | 2094.25 | 707 | 689 | 169.8 |
| D | 1 | 52 | 120917 | 708.04 | 707 | 689 | 169.8 |
| D | 1 | 20 | 94392 | 551.83 | 707 | 689 | 169.8 |
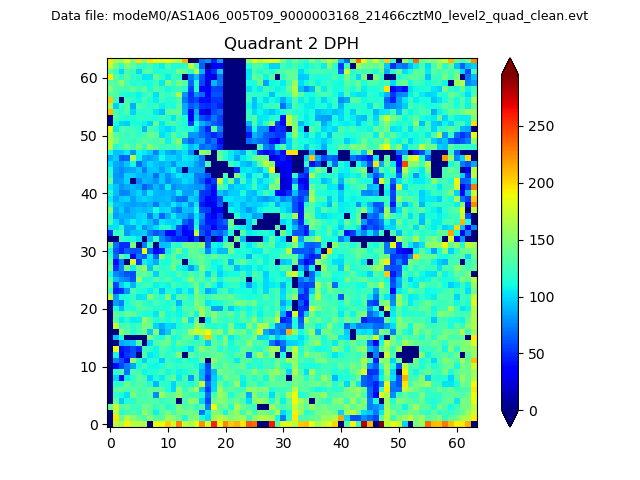
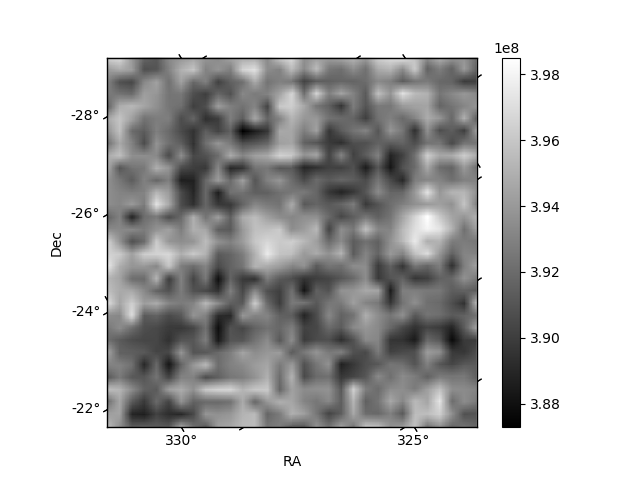
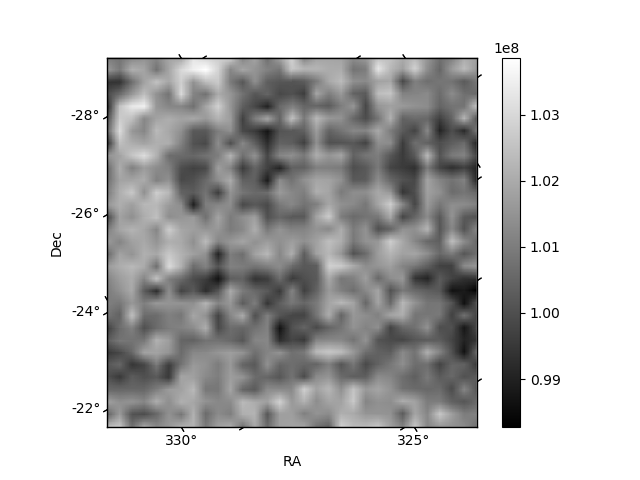
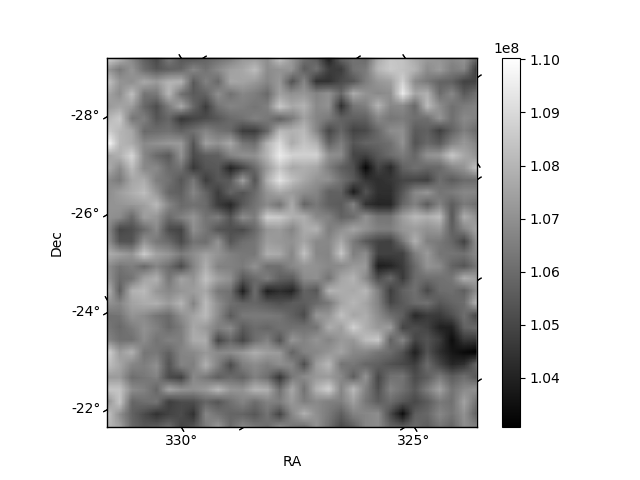
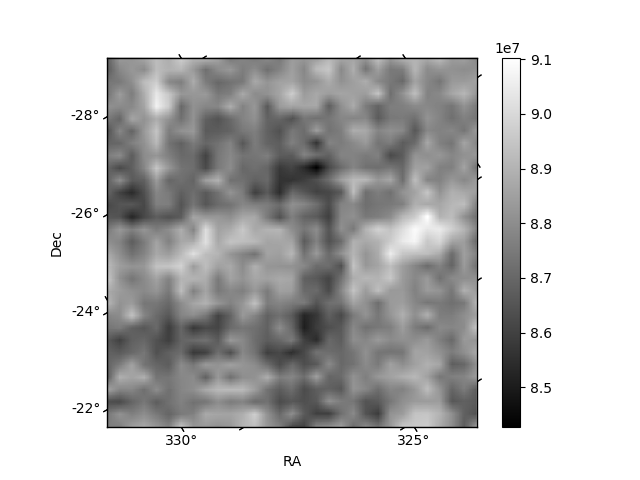
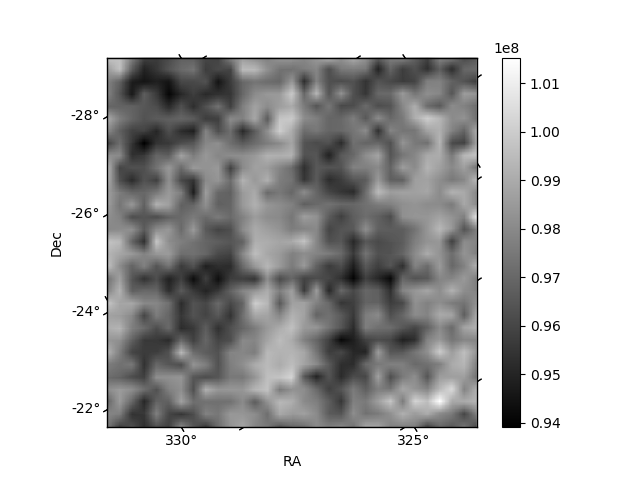
Histogram calculated using DETX and DETY for each event in the final _common_clean file
| Quadrant A | 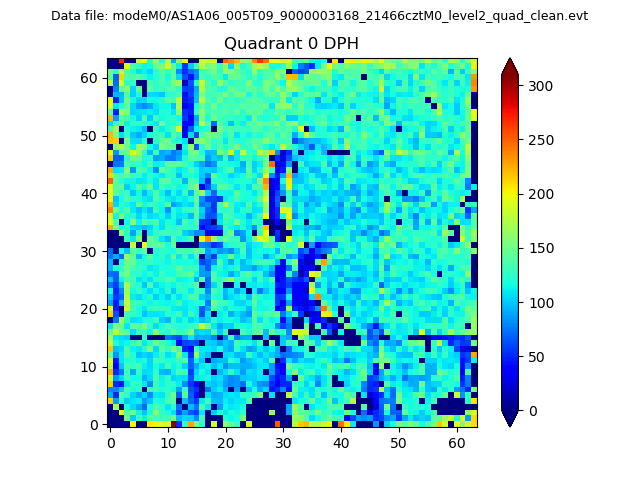 |
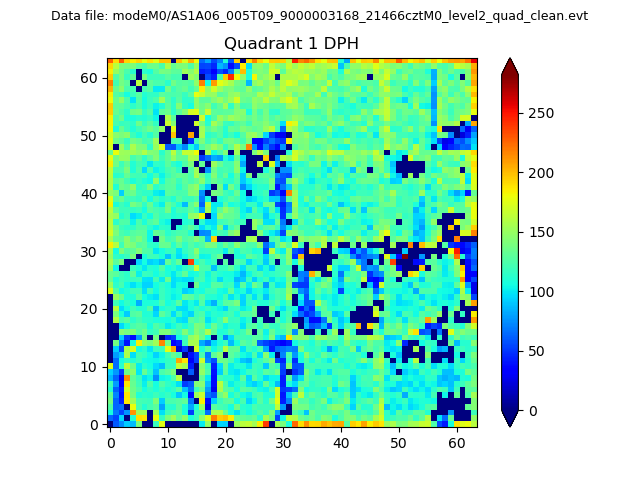 |
Quadrant B |
|---|---|---|---|
| Quadrant D | 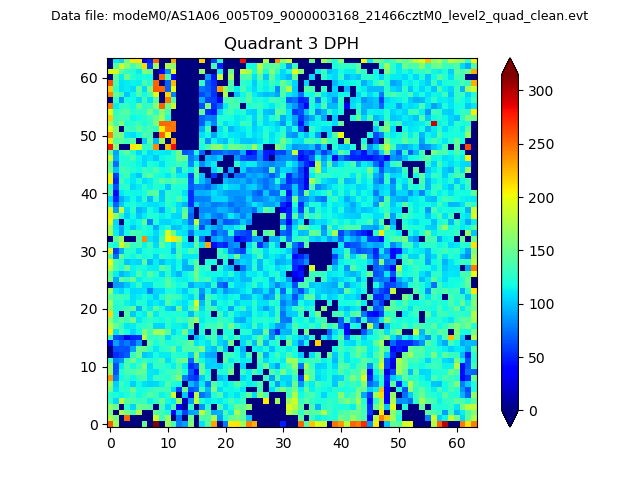 |
 |
Quadrant C |
| Plot type | Count rate plots | Images |
|---|---|---|
| Comparison with Poisson distribution Blue bars denote a histogram of data divided into 1 sec bins. Red curve is a Poisson curve with rate = median count rate of data. |
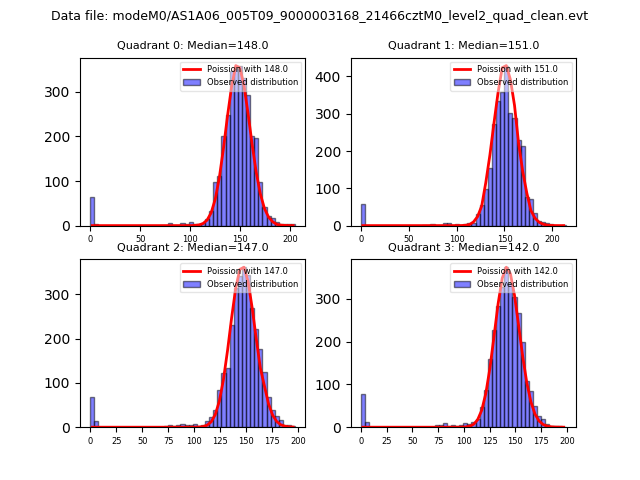 |
 |
| Quadrant-wise count rates Data is divided into 100 sec bins |
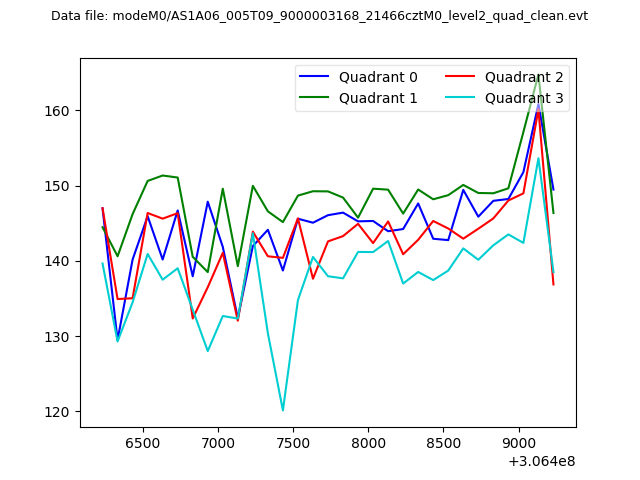 |
|
| Module-wise count rates for Quadrant A Data is divided into 100 sec bins |
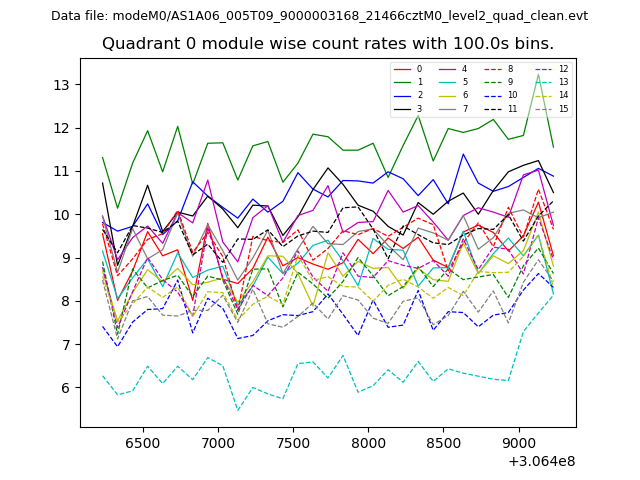 |
 |
| Module-wise count rates for Quadrant B Data is divided into 100 sec bins |
 |
 |
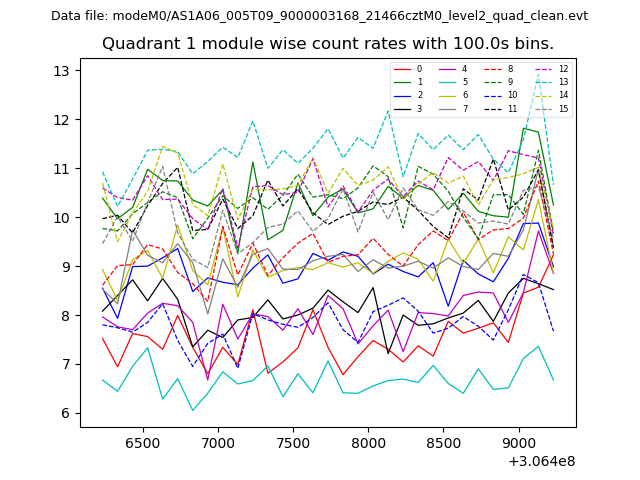
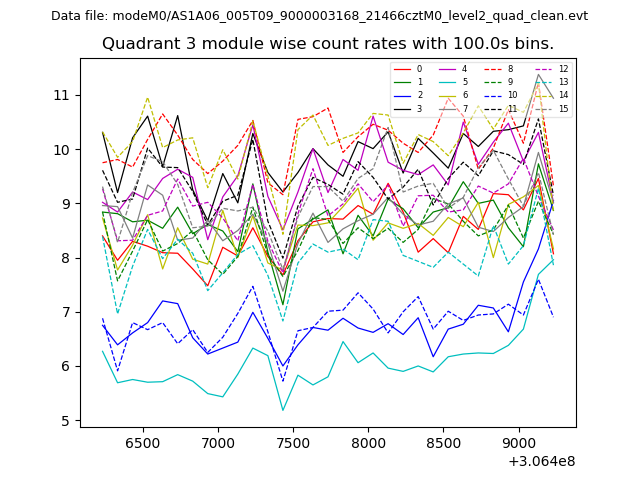
| Module-wise count rates for Quadrant C Data is divided into 100 sec bins |
 |
 |
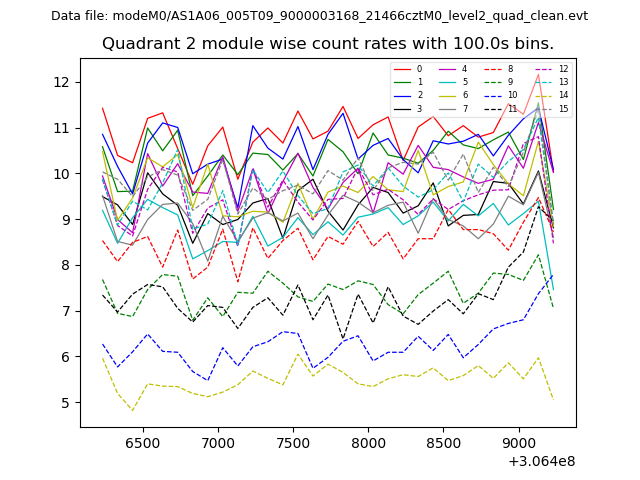
| Module-wise count rates for Quadrant D Data is divided into 100 sec bins |
 |
 |
| Parameter | Plot |
|---|---|
| CZT HV Monitor | 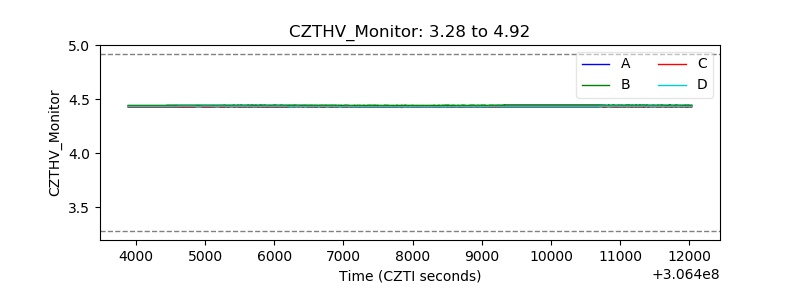 |
| D_VDD | 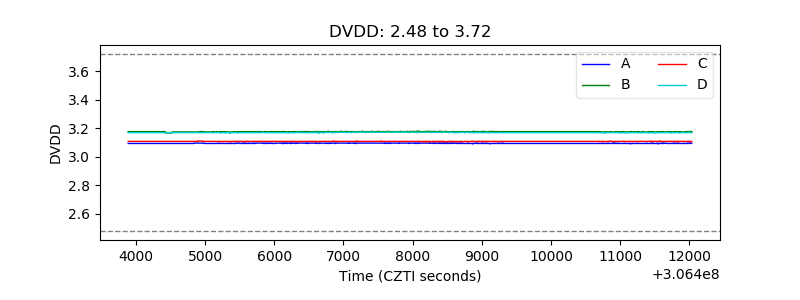 |
| Temperature 1 | 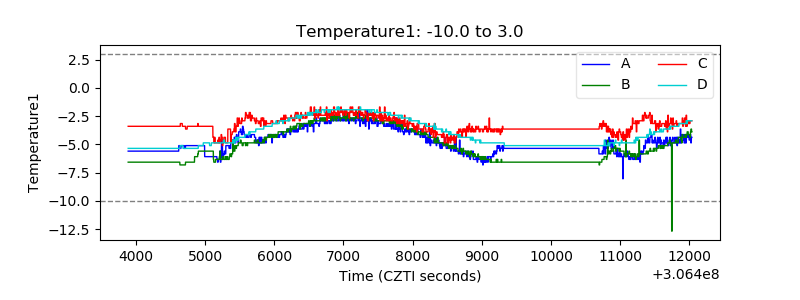 |
| Veto HV Monitor | 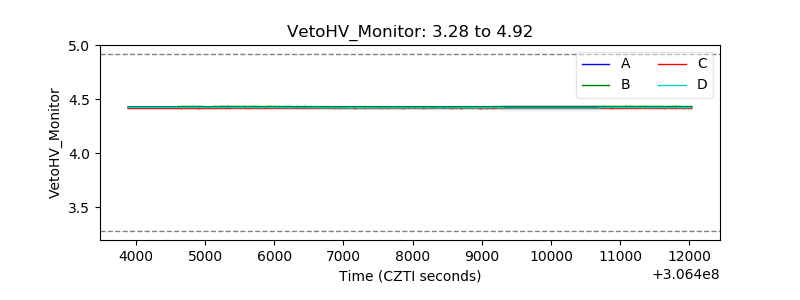 |
| Veto LLD | 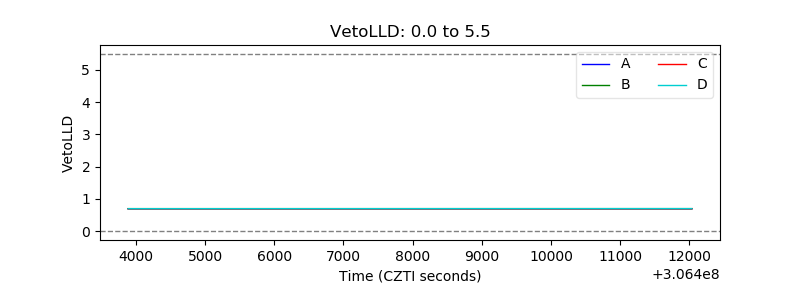 |
| Alpha Counter | 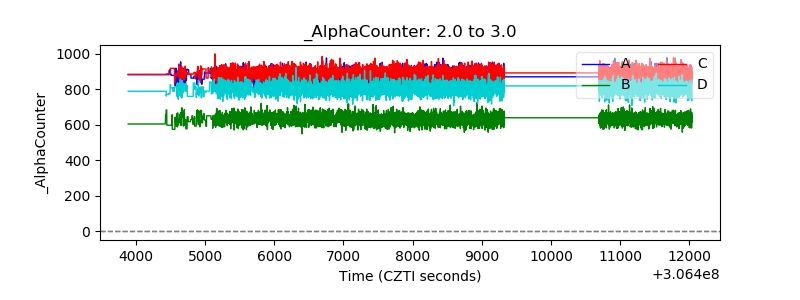 |
| _CPM_Rate | 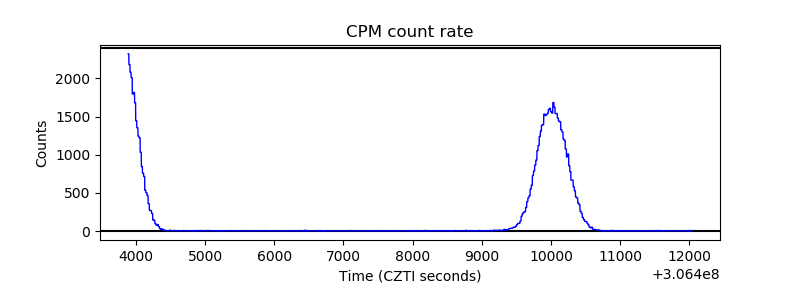 |
| CZT Counter | 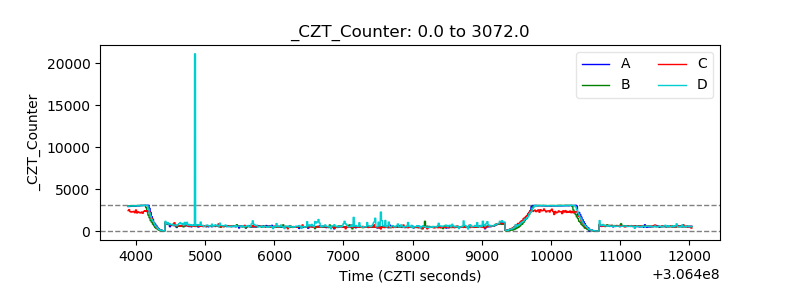 |
| +2.5 Volts monitor | 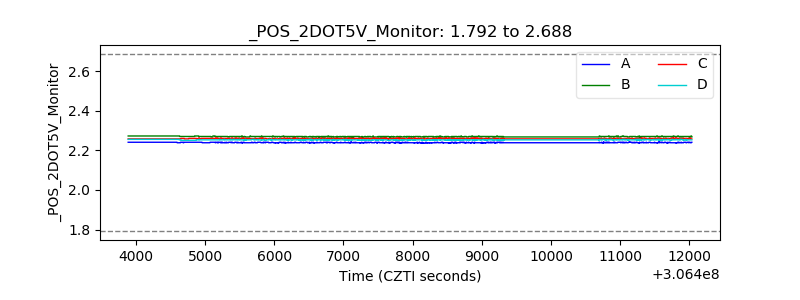 |
| +5 Volts monitor |  |
| _ROLL_ROT | 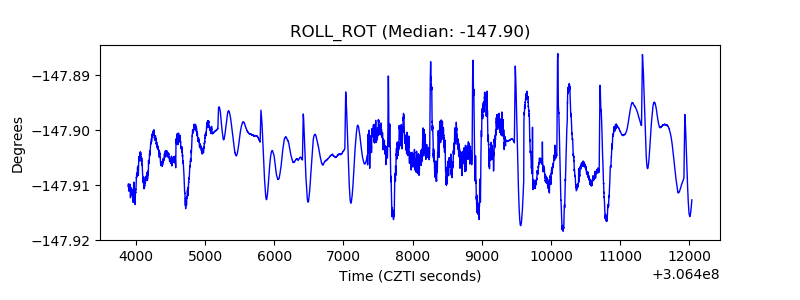 |
| _Roll_DEC | 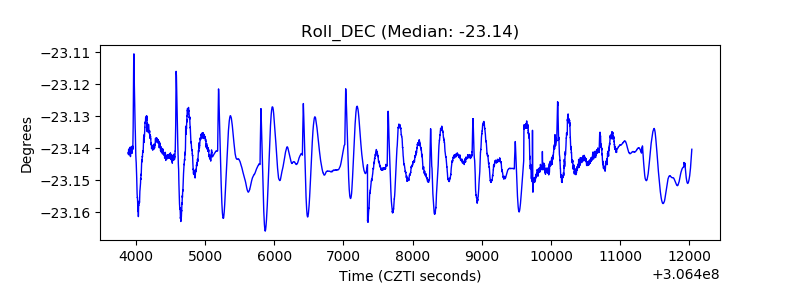 |
| _Roll_RA | 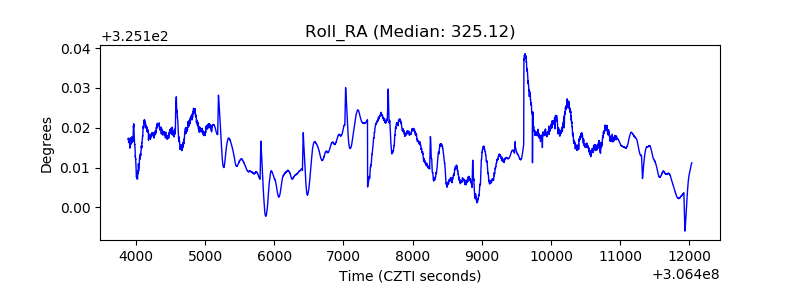 |
| Veto Counter | 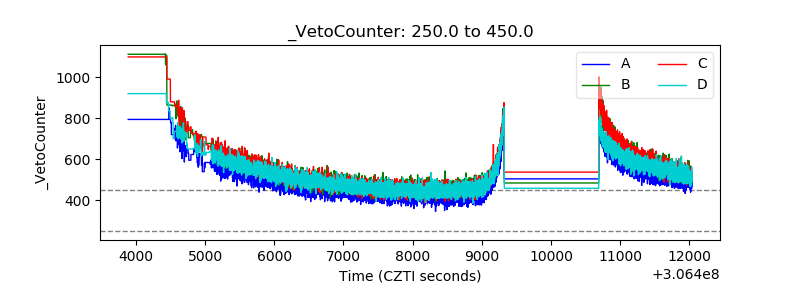 |